Races in Conning Towers-Nautilus Park, Connecticut (CT) Detailed Stats
Ancestries, Foreign-born residents, place of birth
Settings
X


Discuss Conning Towers-Nautilus Park, Connecticut races on our local forum with over 2,400,000 registered users
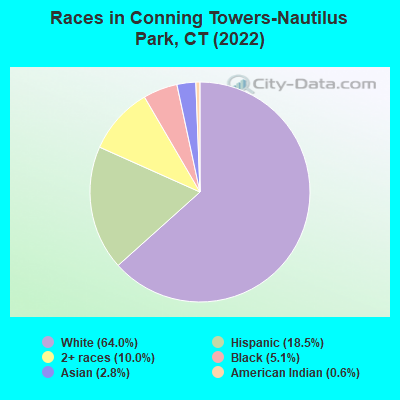
According to 2022 data, the most numerous races in Conning Towers-Nautilus Park, CT are White alone (5,350 residents), Hispanic (1,551 residents), and Black alone (424 residents). 90.4% of Conning Towers-Nautilus Park residents speak English at home. 2.5% of Conning Towers-Nautilus Park, CT residents are foreign-born (1.0% born in Europe, 1.0% born in Asia, 0.4% born in Latin America), which is 489.0% less than the foreign-born rate of 15.0% across the entire state of Connecticut.
Race distribution in Conning Towers-Nautilus Park
2000
2022

- 8,03978.5%White alone
- 9439.2%Black alone
- 6356.2%Hispanic
- 2782.7%Two or more races
- 2292.2%Asian alone
- 520.5%American Indian alone
- 320.3%Other race alone
- 330.3%Native Hawaiian and Other
Pacific Islander alone

-
- 5,35064.0%White alone
- 1,55118.5%Hispanic
- 83910.0%Two or more races
- 4245.1%Black alone
- 2312.8%Asian alone
- 510.6%American Indian alone
2000
2022
-
- 2,638,84577.5%White alone
- 320,3239.4%Hispanic
- 295,5718.7%Black alone
- 81,5642.4%Asian alone
- 52,8961.6%Two or more races
- 8,1410.2%Other race alone
- 7,2670.2%American Indian alone
- 9580.03%Native Hawaiian and Other
Pacific Islander alone

-
- 2,246,91362.0%White alone
- 658,97818.2%Hispanic
- 353,9739.8%Black alone
- 172,9294.8%Asian alone
- 159,6314.4%Two or more races
- 29,7610.8%Other race alone
- 3,4280.09%American Indian alone
- 5920.02%Native Hawaiian and Other
Pacific Islander alone

Income and house value in Conning Towers-Nautilus Park
- Median household income in 2022
- $73,097White non-Hispanic householders
- $146,392Black householders
- $60,663Asian householders
- $102,344Some other race householders
- $52,098Two or more races householders
- $108,974Hispanic or Latino race householders
- Median 2022 house value
- $287,402White Non-Hispanic householders
- $376,940Black or African American householders
- $249,360Asian householders
- $220,365Two or more races householders
Household income for White non-Hispanic householders

Household income for Black householders

Household income for American Indian and Alaska Native householders

Household income for Asian householders

Household income for Some other race householders

Household income for Two or more races householders

Household income for Hispanic or Latino race householders

Median age by race in Conning Towers-Nautilus Park
- 25.7Median age for White residents
- 25.5Males
- 27.3Females
- 22.0Median age for Black or African American residents
- 20.3Males
- 33.5Females
- 57.9Median age for American Indian / Alaska Native residents
- -701,030,927.1Males
- -704,477,611.2Females
- 40.4Median age for Asian residents
- 25.6Males
- 51.4Females
- -641,269,840.6Median age for Native Hawaiian / Pacific Islander residents
- -414,239,481.8Males
- -691,588,784.4Females
- 24.6Median age for Other race residents
- 25.4Males
- 22.7Females
- 17.1Median age for Two or more races residents
- 16.9Males
- 16.9Females
- 25.8Median age for White alone residents
- 25.3Males
- 27.7Females
- 18.8Median age for Hispanic or Latino residents
- 21.1Males
- 8.1Females
Owner/renter occupied households by race in Conning Towers-Nautilus Park
- House owners and renters - White residents
- 47622.6%Owner occupied
- 1,63577.4%Renter occupied
- House owners and renters - Black or African American residents
- 812.7%Owner occupied
- 5287.3%Renter occupied
- House owners and renters - American Indian / Alaska Native residents
- 28100.0%Renter occupied
- House owners and renters - Asian residents
- 1636.2%Owner occupied
- 2863.8%Renter occupied
- House owners and renters - Other race residents
- 12100.0%Renter occupied
- House owners and renters - Two or more races residents
- 4117.8%Owner occupied
- 19182.2%Renter occupied
- House owners and renters - White alone residents
- 47021.7%Owner occupied
- 1,69478.3%Renter occupied
- House owners and renters - Hispanic or Latino residents
- 4129.7%Owner occupied
- 9770.3%Renter occupied
Language usage in Conning Towers-Nautilus Park
- English speakers - Total
- 90.4% of residents of Conning Towers-Nautilus Park speak English at home.
- 6.1% of residents speak Spanish at home
- 43194.9%Speak English very well
- 235.1%Speak English less than very well
- 2.8% of residents speak other language at home
- 11052.6%Speak English very well
- 9947.4%Speak English less than very well
- English speakers - Born in the United States
- 94.0% of residents of Conning Towers-Nautilus Park speak English at home.
- 3.8% of residents speak Spanish at home
- 20297.6%Speak English very well
- 52.4%Speak English less than very well
- 1.4% of residents speak other language at home
- 5063.3%Speak English very well
- 2936.7%Speak English less than very well
- English speakers - Native, born elsewhere
- 71.0% of residents of Conning Towers-Nautilus Park speak English at home.
- 24.1% of residents speak Spanish at home
- 1851.4%Speak English very well
- 1748.6%Speak English less than very well
- 11.0% of residents speak other language at home
- 16100.0%Speak English very well
- English speakers - Foreign-born
- 33.3% of residents of Conning Towers-Nautilus Park speak English at home.
- 14.6% of residents speak Spanish at home
- 31100.0%Speak English very well
- 51.2% of residents speak other language at home
- 4844.0%Speak English very well
- 6156.0%Speak English less than very well
White (Caucasian) - Speak only English
| Native: | 96.7% (5,132) |
| Foreign-born: | 51.1% (40) |
White (Caucasian) - Speak another language
| Native: | 3.9% (205) |
| Foreign-born: | 52.5% (41) |
Black or African American - Speak another language
| Native: | 16.2% (85) |
| Foreign-born: | 83.6% (9) |
Asian - Speak only English
| Native: | 85.7% (119) |
| Foreign-born: | 28.5% (24) |
Asian - Speak another language
| Native: | 16.0% (22) |
| Foreign-born: | 70.7% (60) |
Other race - Speak another language
| Native: | 64.5% (54) |
| Foreign-born: | 100.0% (18) |
White alone - Speak only English
| Native: | 98.6% (4,815) |
| Foreign-born: | 52.3% (41) |
White alone - Speak another language
| Native: | 1.4% (68) |
| Foreign-born: | 48.3% (38) |
Hispanic or Latino - Speak only English
| Native: | 65.2% (712) |
| Foreign-born: | 20.4% (8) |
Hispanic or Latino - Speak another language
| Native: | 36.5% (398) |
| Foreign-born: | 76.6% (30) |
Foreign-born residents in Conning Towers-Nautilus Park
213 residents are foreign born (1.0% Europe, 1.0% Asia, 0.4% Latin America).
| This city: | 2.5% |
| Connecticut: | 15.0% |


Marital status for residents in Conning Towers-Nautilus Park
Marital status - White (Caucasian) population 15 years and over
- Males
- 45.3%Never married
- 47.4%Now married
- 0.3%Separated
- 0.7%Widowed
- 6.4%Divorced
- Females
- 14.4%Never married
- 64.2%Now married
- 4.0%Separated
- 5.3%Widowed
- 12.1%Divorced
Women who gave birth in the past 12 months
| Now married: | 97.0% (331) |
| Unmarried: | 3.0% (10) |
Women who did not give birth in the past 12 months
| Now married: | 69.0% (711) |
| Unmarried: | 31.0% (319) |
Marital status - Black or African American population 15 years and over
- Males
- 50.6%Never married
- 37.5%Now married
- 2.6%Separated
- 7.8%Widowed
- 1.5%Divorced
- Females
- 53.1%Never married
- 46.9%Now married
- 0.0%Separated
- 0.0%Widowed
- 0.0%Divorced
Women who gave birth in the past 12 months
| Now married: | 100.0% (8) |
| Unmarried: | 0.0% (0) |
Women who did not give birth in the past 12 months
| Now married: | 39.3% (43) |
| Unmarried: | 60.7% (67) |
Marital status - American Indian / Alaska Native population 15 years and over
- Males
- 6.7%Never married
- 93.3%Now married
- 0.0%Separated
- 0.0%Widowed
- 0.0%Divorced
- Females
- 0.0%Never married
- 32.5%Now married
- 0.0%Separated
- 67.5%Widowed
- 0.0%Divorced
Marital status - Asian population 15 years and over
- Males
- 63.4%Never married
- 36.6%Now married
- 0.0%Separated
- 0.0%Widowed
- 0.0%Divorced
- Females
- 15.4%Never married
- 48.1%Now married
- 0.0%Separated
- 8.7%Widowed
- 27.9%Divorced
Women who did not give birth in the past 12 months
| Now married: | 73.3% (43) |
| Unmarried: | 26.7% (16) |
Marital status - Other race population 15 years and over
- Males
- 86.4%Never married
- 13.6%Now married
- 0.0%Separated
- 0.0%Widowed
- 0.0%Divorced
- Females
- 58.8%Never married
- 41.2%Now married
- 0.0%Separated
- 0.0%Widowed
- 0.0%Divorced
Women who did not give birth in the past 12 months
| Now married: | 37.5% (7) |
| Unmarried: | 62.5% (12) |
Marital status - Two or more races population 15 years and over
- Males
- 79.9%Never married
- 14.7%Now married
- 0.0%Separated
- 1.1%Widowed
- 4.2%Divorced
- Females
- 60.6%Never married
- 27.7%Now married
- 4.2%Separated
- 0.0%Widowed
- 7.6%Divorced
Women who gave birth in the past 12 months
| Now married: | 100.0% (5) |
| Unmarried: | 0.0% (0) |
Women who did not give birth in the past 12 months
| Now married: | 31.3% (118) |
| Unmarried: | 68.7% (258) |
Marital status - White alone, not Hispanic / Latino population 15 years and over
- Males
- 45.0%Never married
- 46.4%Now married
- 0.3%Separated
- 0.8%Widowed
- 7.5%Divorced
- Females
- 14.2%Never married
- 64.1%Now married
- 4.1%Separated
- 5.4%Widowed
- 12.2%Divorced
Women who gave birth in the past 12 months
| Now married: | 97.0% (349) |
| Unmarried: | 3.0% (11) |
Women who did not give birth in the past 12 months
| Now married: | 68.9% (729) |
| Unmarried: | 31.1% (329) |
Marital status - Hispanic or Latino population 15 years and over
- Males
- 55.4%Never married
- 44.6%Now married
- 0.0%Separated
- 0.0%Widowed
- 0.0%Divorced
- Females
- 74.8%Never married
- 21.4%Now married
- 0.0%Separated
- 3.8%Widowed
- 0.0%Divorced
Women who gave birth in the past 12 months
| Now married: | 100.0% (12) |
| Unmarried: | 0.0% (0) |
Women who did not give birth in the past 12 months
| Now married: | 18.4% (40) |
| Unmarried: | 81.6% (178) |
Ancestries in Conning Towers-Nautilus Park

- 36011.4%Irish
- 34110.8%German
- 33710.7%Italian
- 1424.5%European
- 1334.2%French
- 1274.0%American
- 902.9%English
- 622.0%Welsh
- 571.8%French Canadian
- 381.2%Scottish
- 321.0%British
- 290.9%Greek
- 270.9%Liberian
- 180.6%Polish
- 130.4%Norwegian
- 120.4%Russian
- 110.3%Haitian
- 80.3%Guyanese
- 70.2%African
- 60.2%Brazilian
- 50.2%Romanian
- 40.1%Northern European
- 40.1%Sudanese
- 30.10%Portuguese
- 30.10%Swedish
- 30.10%Ukrainian
- 20.06%Scotch-Irish

Geographical mobility in Conning Towers-Nautilus Park

- Same house 1 year ago
- 3,75366.4%White (Caucasian)
- 37862.8%Black or African American
- 1524.1%American Indian / Alaska Native
- 17572.2%Asian
- 4743.3%Other race
- 89563.7%Two or more races
- 3,33964.4%White alone, not Hispanic / Latino
- 1,01872.8%Hispanic or Latino

-
- Moved within same county
- 3766.7%White / Caucasian
- 142.4%Black or African American
- 1218.6%American Indian / Alaska Native
- 43.7%Other race
- 1369.7%Two or more races
- 3576.9%White alone, not Hispanic / Latino
- 1178.3%Hispanic or Latino

-
- Moved within same state
- 340.6%White / Caucasian
- 32.4%Other race
- 350.7%White alone, not Hispanic / Latino
- 30.2%Hispanic or Latino

-
- Moved from different state
- 1,94534.4%White / Caucasian
- 31351.9%Black or African American
- 5485.9%American Indian / Alaska Native
- 8434.8%Asian
- 7871.0%Other race
- 33924.2%Two or more races
- 1,89436.5%White alone, not Hispanic / Latino
- 31922.8%Hispanic or Latino

-
- Moved from abroad
- 370.7%White
- 193.1%Black or African American
- 553.9%Two or more races
- 310.6%White alone, not Hispanic / Latino
- 141.0%Hispanic or Latino

Children Nativity (place of birth) in Conning Towers-Nautilus Park
Place of birth for residents in Conning Towers-Nautilus Park
![Place of birth for the foreign-born population - Regions]()
- 83Europe
- 83Asia
- 65South Eastern Asia
- 41Americas
- 37Southern Europe
- 35Latin America
- 25Northern Europe
- 20Eastern Europe
- 19Caribbean
- 13Central America
- 12Eastern Asia
- 12China
- 6Northern America
- 5South Central Asia
- 4Africa
- 4Northern Africa
- 2South America

![Place of birth for the foreign-born population - Countries]()
- 65Philippines
- 18Greece
- 18Italy
- 15Norway
- 14Russia
- 13Dominican Republic
- 13El Salvador
- 12China
- 6Ukraine
- 6Haiti
- 6Canada
- 5England
- 5India
- 4United Kingdom
- 4Sudan
- 2Ecuador

Zip codes: 06340.