Races in Concord, Tennessee (TN) Detailed Stats
Ancestries, Foreign-born residents, place of birth
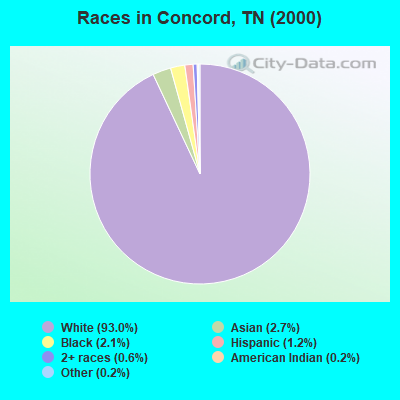
Race distribution in Concord

- 23,61593.0%White alone
- 6812.7%Asian alone
- 5402.1%Black alone
- 2961.2%Hispanic
- 1620.6%Two or more races
- 390.2%Other race alone
- 460.2%American Indian alone
2000
2022
-
- 4,505,93079.2%White alone
- 928,20416.3%Black alone
- 123,8382.2%Hispanic
- 54,8241.0%Two or more races
- 56,0771.0%Asian alone
- 13,8200.2%American Indian alone
- 4,7800.08%Other race alone
- 1,8100.03%Native Hawaiian and Other
Pacific Islander alone

-
- 5,070,02671.9%White alone
- 1,089,73815.5%Black alone
- 442,6296.3%Hispanic
- 279,3814.0%Two or more races
- 131,8171.9%Asian alone
- 26,9720.4%Other race alone
- 6,3870.09%American Indian alone
- 4,3890.06%Native Hawaiian and Other
Pacific Islander alone

Income and house value in Concord
- Median household income in 2022
- $143,534White non-Hispanic householders
- $140,472Black householders
- $57,848American Indian and Alaska Native householders
- over $200,000Asian householders
- $71,732Some other race householders
- $90,383Two or more races householders
- $63,706Hispanic or Latino race householders
- Median 2022 house value
- $574,100White Non-Hispanic householders
- $510,595Black or African American householders
- $79,142American Indian or Alaska Native householders
- $702,707Asian householders
- $303,166Some other race householders
- $335,397Two or more races householders
- $302,527Hispanic or Latino householders
Household income for White non-Hispanic householders

Household income for Black householders

Household income for American Indian and Alaska Native householders

Household income for Asian householders

Household income for Two or more races householders

Household income for Hispanic or Latino race householders

Zip code: 37922