Races in Columbus, Mississippi (MS) Detailed Stats
Data:
Races - White alone (%)
Races - White alone (% change since 2000)
Races - Black alone (%)
Races - Black alone (% change since 2000)
Races - American Indian alone (%)
Races - American Indian alone (% change since 2000)
Races - Asian alone (%)
Races - Asian alone (% change since 2000)
Races - Hispanic (%)
Races - Hispanic (% change since 2000)
Races - Native Hawaiian and Other Pacific Islander alone (%)
Races - Native Hawaiian and Other Pacific Islander alone (% change since 2000)
Races - Two or more races(%)
Races - Two or more races(% change since 2000)
Races - Other race alone (%)
Races - Other race alone (% change since 2000)
Racial diversity
Place of birth - Born in state of residence (%)
Place of birth - Born in state of residence (%) - White
Place of birth - Born in state of residence (%) - Black or African American
Place of birth - Born in state of residence (%) - Asian
Place of birth - Born in state of residence (%) - Hispanic or Latino
Place of birth - Born in state of residence (%) - American Indian and Alaska Native
Place of birth - Born in state of residence (%) - Multirace
Place of birth - Born in state of residence (%) - Other Race
Place of birth - Born in other state (%)
Place of birth - Born in other state (%) - White
Place of birth - Born in other state (%) - Black or African American
Place of birth - Born in other state (%) - Asian
Place of birth - Born in other state (%) - Hispanic or Latino
Place of birth - Born in other state (%) - American Indian and Alaska Native
Place of birth - Born in other state (%) - Multirace
Place of birth - Born in other state (%) - Other Race
Place of birth - Native, outside of US (%)
Place of birth - Native, outside of US (%) - White
Place of birth - Native, outside of US (%) - Black or African American
Place of birth - Native, outside of US (%) - Asian
Place of birth - Native, outside of US (%) - Hispanic or Latino
Place of birth - Native, outside of US (%) - American Indian and Alaska Native
Place of birth - Native, outside of US (%) - Multirace
Place of birth - Native, outside of US (%) - Other Race
Place of birth - Foreign born (%)
Place of birth - Foreign born (%) - White
Place of birth - Foreign born (%) - Black or African American
Place of birth - Foreign born (%) - Asian
Place of birth - Foreign born (%) - Hispanic or Latino
Place of birth - Foreign born (%) - American Indian and Alaska Native
Place of birth - Foreign born (%) - Multirace
Place of birth - Foreign born (%) - Other Race
Residents speaking English at home (%)
Residents speaking English at home - Born in the United States (%)
Residents speaking English at home - Native, born elsewhere (%)
Residents speaking English at home - Foreign born (%)
Residents speaking Spanish at home (%)
Residents speaking Spanish at home - Born in the United States (%)
Residents speaking Spanish at home - Native, born elsewhere (%)
Residents speaking Spanish at home - Foreign born (%)
Residents speaking other language at home (%)
Residents speaking other language at home - Born in the United States (%)
Residents speaking other language at home - Native, born elsewhere (%)
Residents speaking other language at home - Foreign born (%)
Marital status - Never married (%)
Marital status - Now married (%)
Marital status - Separated (%)
Marital status - Widowed (%)
Marital status - Divorced (%)
Ancestries Reported - Arab (%)
Ancestries Reported - Czech (%)
Ancestries Reported - Danish (%)
Ancestries Reported - Dutch (%)
Ancestries Reported - English (%)
Ancestries Reported - French (%)
Ancestries Reported - French Canadian (%)
Ancestries Reported - German (%)
Ancestries Reported - Greek (%)
Ancestries Reported - Hungarian (%)
Ancestries Reported - Irish (%)
Ancestries Reported - Italian (%)
Ancestries Reported - Lithuanian (%)
Ancestries Reported - Norwegian (%)
Ancestries Reported - Polish (%)
Ancestries Reported - Portuguese (%)
Ancestries Reported - Russian (%)
Ancestries Reported - Scotch-Irish (%)
Ancestries Reported - Scottish (%)
Ancestries Reported - Slovak (%)
Ancestries Reported - Subsaharan African (%)
Ancestries Reported - Swedish (%)
Ancestries Reported - Swiss (%)
Ancestries Reported - Ukrainian (%)
Ancestries Reported - United States (%)
Ancestries Reported - Welsh (%)
Ancestries Reported - West Indian (%)
Ancestries Reported - Other (%)
Geographical mobility - Same house 1 year ago (%)
Geographical mobility - Same house 1 year ago (%) - White
Geographical mobility - Same house 1 year ago (%) - Black or African American
Geographical mobility - Same house 1 year ago (%) - Asian
Geographical mobility - Same house 1 year ago (%) - Hispanic or Latino
Geographical mobility - Same house 1 year ago (%) - American Indian and Alaska Native
Geographical mobility - Same house 1 year ago (%) - Multirace
Geographical mobility - Same house 1 year ago (%) - Other Race
Geographical mobility - Moved within same county (%)
Geographical mobility - Moved within same county (%) - White
Geographical mobility - Moved within same county (%) - Black or African American
Geographical mobility - Moved within same county (%) - Asian
Geographical mobility - Moved within same county (%) - Hispanic or Latino
Geographical mobility - Moved within same county (%) - American Indian and Alaska Native
Geographical mobility - Moved within same county (%) - Multirace
Geographical mobility - Moved within same county (%) - Other Race
Geographical mobility - Moved from different county within same state (%)
Geographical mobility - Moved from different county within same state (%) - White
Geographical mobility - Moved from different county within same state (%) - Black or African American
Geographical mobility - Moved from different county within same state (%) - Asian
Geographical mobility - Moved from different county within same state (%) - Hispanic or Latino
Geographical mobility - Moved from different county within same state (%) - American Indian and Alaska Native
Geographical mobility - Moved from different county within same state (%) - Multirace
Geographical mobility - Moved from different county within same state (%) - Other Race
Geographical mobility - Moved from different state (%)
Geographical mobility - Moved from different state (%) - White
Geographical mobility - Moved from different state (%) - Black or African American
Geographical mobility - Moved from different state (%) - Asian
Geographical mobility - Moved from different state (%) - Hispanic or Latino
Geographical mobility - Moved from different state (%) - American Indian and Alaska Native
Geographical mobility - Moved from different state (%) - Multirace
Geographical mobility - Moved from different state (%) - Other Race
Geographical mobility - Moved from abroad (%)
Geographical mobility - Moved from abroad (%) - White
Geographical mobility - Moved from abroad (%) - Black or African American
Geographical mobility - Moved from abroad (%) - Asian
Geographical mobility - Moved from abroad (%) - Hispanic or Latino
Geographical mobility - Moved from abroad (%) - American Indian and Alaska Native
Geographical mobility - Moved from abroad (%) - Multirace
Geographical mobility - Moved from abroad (%) - Other Race
Place of birth for the foreign-born population - Ireland (%)
Place of birth for the foreign-born population - Denmark (%)
Place of birth for the foreign-born population - Norway (%)
Place of birth for the foreign-born population - Sweden (%)
Place of birth for the foreign-born population - United Kingdom (%)
Place of birth for the foreign-born population - England (%)
Place of birth for the foreign-born population - Scotland (%)
Place of birth for the foreign-born population - Other Northern Europe (%)
Place of birth for the foreign-born population - Austria (%)
Place of birth for the foreign-born population - Belgium (%)
Place of birth for the foreign-born population - France (%)
Place of birth for the foreign-born population - Germany (%)
Place of birth for the foreign-born population - Netherlands (%)
Place of birth for the foreign-born population - Switzerland (%)
Place of birth for the foreign-born population - Other Western Europe (%)
Place of birth for the foreign-born population - Greece (%)
Place of birth for the foreign-born population - Italy (%)
Place of birth for the foreign-born population - Portugal (%)
Place of birth for the foreign-born population - Spain (%)
Place of birth for the foreign-born population - Other Southern Europe (%)
Place of birth for the foreign-born population - Albania (%)
Place of birth for the foreign-born population - Belarus (%)
Place of birth for the foreign-born population - Bosnia and Herzegovina (%)
Place of birth for the foreign-born population - Bulgaria (%)
Place of birth for the foreign-born population - Croatia (%)
Place of birth for the foreign-born population - Czechoslovakia (%)
Place of birth for the foreign-born population - Hungary (%)
Place of birth for the foreign-born population - Latvia (%)
Place of birth for the foreign-born population - Lithuania (%)
Place of birth for the foreign-born population - North Macedonia (Macedonia) (%)
Place of birth for the foreign-born population - Moldova (%)
Place of birth for the foreign-born population - Poland (%)
Place of birth for the foreign-born population - Romania (%)
Place of birth for the foreign-born population - Russia (%)
Place of birth for the foreign-born population - Serbia (%)
Place of birth for the foreign-born population - Ukraine (%)
Place of birth for the foreign-born population - Other Eastern Europe (%)
Place of birth for the foreign-born population - China (%)
Place of birth for the foreign-born population - Hong Kong (%)
Place of birth for the foreign-born population - Taiwan (%)
Place of birth for the foreign-born population - Japan (%)
Place of birth for the foreign-born population - Korea (%)
Place of birth for the foreign-born population - Other Eastern Asia (%)
Place of birth for the foreign-born population - Afghanistan (%)
Place of birth for the foreign-born population - Bangladesh (%)
Place of birth for the foreign-born population - India (%)
Place of birth for the foreign-born population - Iran (%)
Place of birth for the foreign-born population - Kazakhstan (%)
Place of birth for the foreign-born population - Nepal (%)
Place of birth for the foreign-born population - Pakistan (%)
Place of birth for the foreign-born population - Sri Lanka (%)
Place of birth for the foreign-born population - Uzbekistan (%)
Place of birth for the foreign-born population - Other South Central Asia (%)
Place of birth for the foreign-born population - Burma (%)
Place of birth for the foreign-born population - Cambodia (%)
Place of birth for the foreign-born population - Indonesia (%)
Place of birth for the foreign-born population - Laos (%)
Place of birth for the foreign-born population - Malaysia (%)
Place of birth for the foreign-born population - Philippines (%)
Place of birth for the foreign-born population - Singapore (%)
Place of birth for the foreign-born population - Thailand (%)
Place of birth for the foreign-born population - Vietnam (%)
Place of birth for the foreign-born population - Other South Eastern Asia (%)
Place of birth for the foreign-born population - Armenia (%)
Place of birth for the foreign-born population - Iraq (%)
Place of birth for the foreign-born population - Israel (%)
Place of birth for the foreign-born population - Jordan (%)
Place of birth for the foreign-born population - Kuwait (%)
Place of birth for the foreign-born population - Lebanon (%)
Place of birth for the foreign-born population - Saudi Arabia (%)
Place of birth for the foreign-born population - Syria (%)
Place of birth for the foreign-born population - Turkey (%)
Place of birth for the foreign-born population - Yemen (%)
Place of birth for the foreign-born population - Other Western Asia (%)
Place of birth for the foreign-born population - Eritrea (%)
Place of birth for the foreign-born population - Ethiopia (%)
Place of birth for the foreign-born population - Kenya (%)
Place of birth for the foreign-born population - Somalia (%)
Place of birth for the foreign-born population - Uganda (%)
Place of birth for the foreign-born population - Zimbabwe (%)
Place of birth for the foreign-born population - Other Eastern Africa (%)
Place of birth for the foreign-born population - Cameroon (%)
Place of birth for the foreign-born population - Congo (%)
Place of birth for the foreign-born population - Democratic Republic of Congo (Zaire) (%)
Place of birth for the foreign-born population - Other Middle Africa (%)
Place of birth for the foreign-born population - Egypt (%)
Place of birth for the foreign-born population - Morocco (%)
Place of birth for the foreign-born population - Sudan (%)
Place of birth for the foreign-born population - Other Northern Africa (%)
Place of birth for the foreign-born population - South Africa (%)
Place of birth for the foreign-born population - Other Southern Africa (%)
Place of birth for the foreign-born population - Cabo Verde (%)
Place of birth for the foreign-born population - Ghana (%)
Place of birth for the foreign-born population - Liberia (%)
Place of birth for the foreign-born population - Nigeria (%)
Place of birth for the foreign-born population - Senegal (%)
Place of birth for the foreign-born population - Sierra Leone (%)
Place of birth for the foreign-born population - Other Western Africa (%)
Place of birth for the foreign-born population - Australia (%)
Place of birth for the foreign-born population - New Zealand (%)
Place of birth for the foreign-born population - Fiji (%)
Place of birth for the foreign-born population - Micronesia (%)
Place of birth for the foreign-born population - Bahamas (%)
Place of birth for the foreign-born population - Barbados (%)
Place of birth for the foreign-born population - Cuba (%)
Place of birth for the foreign-born population - Dominica (%)
Place of birth for the foreign-born population - Dominican Republic (%)
Place of birth for the foreign-born population - Grenada (%)
Place of birth for the foreign-born population - Haiti (%)
Place of birth for the foreign-born population - Jamaica (%)
Place of birth for the foreign-born population - St. Vincent and the Grenadines (%)
Place of birth for the foreign-born population - Trinidad and Tobago (%)
Place of birth for the foreign-born population - West Indies (%)
Place of birth for the foreign-born population - Other Caribbean (%)
Place of birth for the foreign-born population - Belize (%)
Place of birth for the foreign-born population - Costa Rica (%)
Place of birth for the foreign-born population - El Salvador (%)
Place of birth for the foreign-born population - Guatemala (%)
Place of birth for the foreign-born population - Honduras (%)
Place of birth for the foreign-born population - Mexico (%)
Place of birth for the foreign-born population - Nicaragua (%)
Place of birth for the foreign-born population - Panama (%)
Place of birth for the foreign-born population - Other Central America (%)
Place of birth for the foreign-born population - Argentina (%)
Place of birth for the foreign-born population - Bolivia (%)
Place of birth for the foreign-born population - Brazil (%)
Place of birth for the foreign-born population - Chile (%)
Place of birth for the foreign-born population - Colombia (%)
Place of birth for the foreign-born population - Ecuador (%)
Place of birth for the foreign-born population - Guyana (%)
Place of birth for the foreign-born population - Peru (%)
Place of birth for the foreign-born population - Uruguay (%)
Place of birth for the foreign-born population - Venezuela (%)
Place of birth for the foreign-born population - Other South America (%)
Place of birth for the foreign-born population - Canada (%)
Place of birth for the foreign-born population - Other Northern America (%)
Place of birth for the foreign-born population - Other (%)
Latest news about races in Columbus, MS collected exclusively by city-data.com from local newspapers, TV, and radio stations
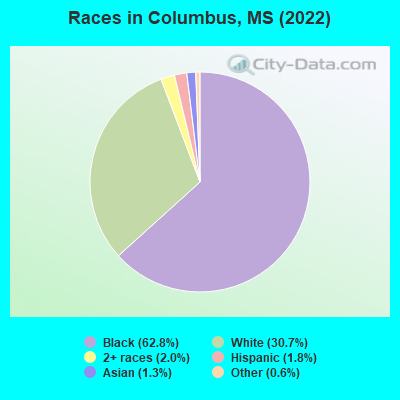
According to 2022 data, the most numerous races in Columbus, MS are White alone (7,295 residents), Black alone (14,904 residents), and Hispanic (432 residents). 96.7% of Columbus residents speak English at home. 2.3% of Columbus, MS residents are foreign-born (1.1% born in Asia, 0.8% born in Latin America, 0.3% born in Europe), which is 13.7% greater than the foreign-born rate of 2.0% across the entire state of Mississippi.
Race distribution in Columbus
2000 2022
1,727,908 60.7% White alone 1,028,473 36.2% Black alone 39,569 1.4% Hispanic 17,272 0.6% Two or more races 18,349 0.6% Asian alone 11,224 0.4% American Indian alone 1,294 0.05% Other race alone 569 0.02% Native Hawaiian and Other
1,625,979 55.3% White alone 1,072,962 36.5% Black alone 97,177 3.3% Hispanic 96,367 3.3% Two or more races 25,217 0.9% Asian alone 12,457 0.4% American Indian alone 9,501 0.3% Other race alone 397 0.01% Native Hawaiian and Other
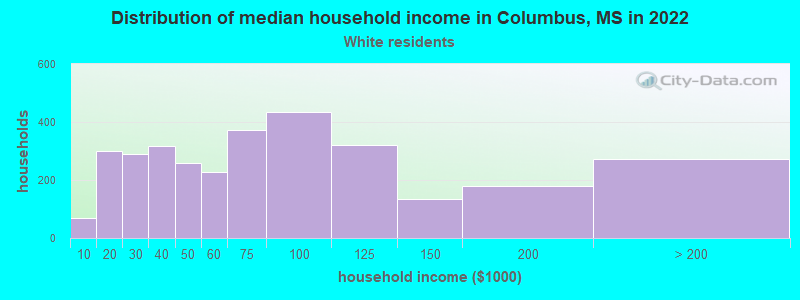
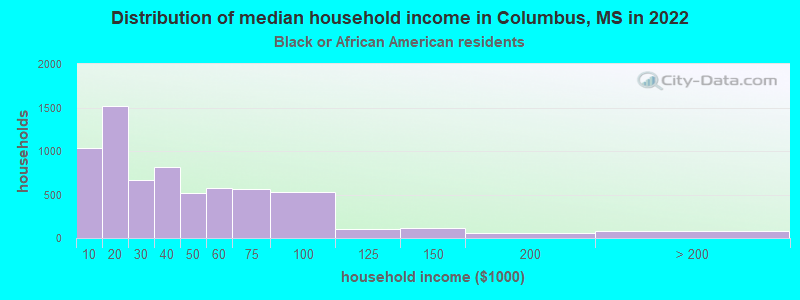
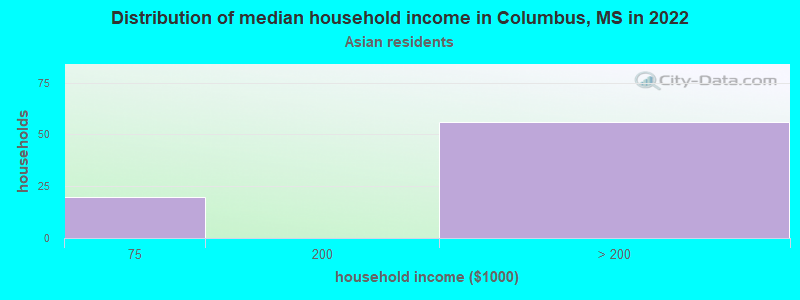
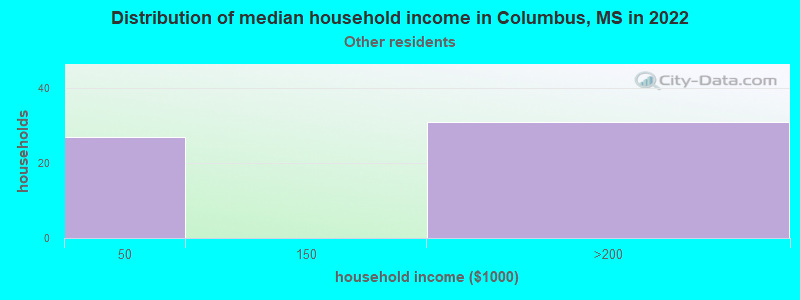
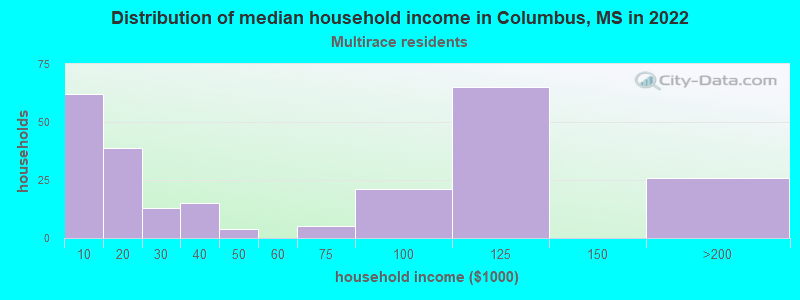
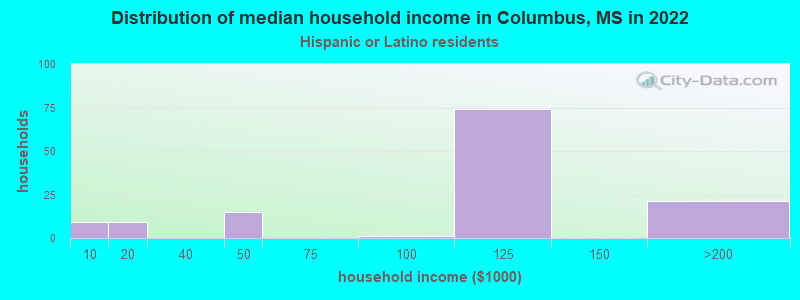
Income and house value in Columbus Median household income in 2022 $63,488 White non-Hispanic householders$31,077 Black householders$183,469 Some other race householders$131,363 Hispanic or Latino race householdersMedian 2022 house value $155,583 White Non-Hispanic householders$100,099 Black or African American householders $142,999 Asian householders$309,831 Native Hawaiian and other Pacific Islander householders$159,396 Two or more races householders$151,197 Hispanic or Latino householders
Median age by race in Columbus
56.8 Median age for White residents50.9 60.4 34.1 Median age for Black or African American residents32.2 36.3 21.3 Median age for American Indian / Alaska Native residents-751,111,110.4 -710,601,718.5 36.8 Median age for Asian residents33.6 37.6 -666,666,666.0 Median age for Native Hawaiian / Pacific Islander residents-668,724,279.2 -670,599,802.7 21.7 Median age for Other race residents21.9 17.5 22.6 Median age for Two or more races residents20.7 21.1 56.3 Median age for White alone residents50.5 60.5 31.8 Median age for Hispanic or Latino residents21.6 31.6
Owner/renter occupied households by race in Columbus
House owners and renters - White residents 2,050 64.7% Owner occupied1,120 35.3% Renter occupiedHouse owners and renters - Black or African American residents 2,480 38.7% Owner occupied3,935 61.3% Renter occupiedHouse owners and renters - Asian residents 66 100.0% Owner occupiedHouse owners and renters - Other race residents 43 73.4% Owner occupied16 26.6% Renter occupiedHouse owners and renters - Two or more races residents 117 47.3% Owner occupied130 52.7% Renter occupiedHouse owners and renters - White alone residents 2,037 64.0% Owner occupied1,145 36.0% Renter occupiedHouse owners and renters - Hispanic or Latino residents 83 73.3% Owner occupied30 26.7% Renter occupied
Language usage in Columbus
English speakers - Total 96.7% of residents of Columbus speak English at home.
1.8% of residents speak Spanish at home 225 55.0% Speak English very well184 45.0% Speak English less than very well1.4% of residents speak other language at home 200 62.5% Speak English very well120 37.5% Speak English less than very well
English speakers - Born in the United States 97.7% of residents of Columbus speak English at home.
1.9% of residents speak Spanish at home 53 50.5% Speak English very well52 49.5% Speak English less than very well0.1% of residents speak other language at home 8 100.0% Speak English very well
English speakers - Native, born elsewhere 99.1% of residents of Columbus speak English at home.
English speakers - Foreign-born 20.3% of residents of Columbus speak English at home.
29.7% of residents speak Spanish at home 122 79.2% Speak English very well32 20.8% Speak English less than very well50.4% of residents speak other language at home 160 61.3% Speak English very well101 38.7% Speak English less than very well
White (Caucasian) - Speak only English Native:
99.9% (6,979)Foreign-born:
59.2% (20)
White (Caucasian) - Speak another language Native:
0.3% (24)Foreign-born:
47.0% (16)
Black or African American - Speak only English Native:
98.9% (14,027)Foreign-born:
92.9% (41)
Asian - Speak only English Native:
95.7% (39)Foreign-born:
20.9% (49)
Other race - Speak another language Native:
48.8% (94)Foreign-born:
100.0% (64)
Two or more races - Speak only English Native:
91.9% (512)Foreign-born:
4.5% (9)
Two or more races - Speak another language Native:
7.5% (42)Foreign-born:
98.6% (191)
White alone - Speak only English Native:
99.5% (6,961)Foreign-born:
41.1% (21)
White alone - Speak another language Native:
0.5% (34)Foreign-born:
59.6% (31)
Hispanic or Latino - Speak another language Native:
34.1% (96)Foreign-born:
100.0% (157)
Foreign-born residents in Columbus 550 residents are foreign born (1.1% Asia , 0.8% Latin America , 0.3% Europe ).
This city:
2.3%Mississippi:
2.3%
Marital status for residents in Columbus Marital status - White (Caucasian) population 15 years and over
Males 35.8% Never married44.5% Now married0.9% Separated3.5% Widowed15.3% DivorcedFemales 15.3% Never married48.2% Now married1.7% Separated21.2% Widowed13.6% DivorcedWomen who gave birth in the past 12 months Now married:
81.9% (66)Unmarried:
18.1% (15)
Women who did not give birth in the past 12 months Now married:
47.0% (412)Unmarried:
53.0% (465)
Marital status - Black or African American population 15 years and over
Males 56.9% Never married23.0% Now married3.0% Separated4.3% Widowed12.9% DivorcedFemales 53.3% Never married17.5% Now married5.9% Separated8.8% Widowed14.4% DivorcedWomen who gave birth in the past 12 months Now married:
35.6% (71)Unmarried:
64.4% (128)
Women who did not give birth in the past 12 months Now married:
14.8% (596)Unmarried:
85.2% (3,434)
Marital status - American Indian / Alaska Native population 15 years and over
Males 100.0% Never married0.0% Now married0.0% Separated0.0% Widowed0.0% DivorcedFemales 100.0% Never married0.0% Now married0.0% Separated0.0% Widowed0.0% DivorcedWomen who did not give birth in the past 12 months Now married:
0.0% (0)Unmarried:
100.0% (7)
Marital status - Asian population 15 years and over
Males 20.0% Never married76.5% Now married0.0% Separated0.0% Widowed3.5% DivorcedFemales 8.8% Never married91.2% Now married0.0% Separated0.0% Widowed0.0% DivorcedWomen who gave birth in the past 12 months Now married:
100.0% (42)Unmarried:
0.0% (0)
Women who did not give birth in the past 12 months Now married:
100.0% (16)Unmarried:
0.0% (0)
Marital status - Other race population 15 years and over
Males 70.7% Never married29.3% Now married0.0% Separated0.0% Widowed0.0% DivorcedFemales 46.6% Never married48.3% Now married0.0% Separated5.2% Widowed0.0% DivorcedWomen who did not give birth in the past 12 months Now married:
50.9% (40)Unmarried:
49.1% (39)
Marital status - Two or more races population 15 years and over
Males 58.9% Never married33.6% Now married0.0% Separated0.0% Widowed7.5% DivorcedFemales 44.4% Never married36.7% Now married0.0% Separated3.3% Widowed15.6% DivorcedWomen who did not give birth in the past 12 months Now married:
0.0% (0)Unmarried:
100.0% (66)
Marital status - White alone, not Hispanic / Latino population 15 years and over
Males 35.8% Never married44.5% Now married0.9% Separated3.5% Widowed15.3% DivorcedFemales 15.4% Never married47.8% Now married1.7% Separated21.3% Widowed13.7% DivorcedWomen who gave birth in the past 12 months Now married:
81.9% (67)Unmarried:
18.1% (15)
Women who did not give birth in the past 12 months Now married:
47.0% (418)Unmarried:
53.0% (471)
Marital status - Hispanic or Latino population 15 years and over
Males 67.9% Never married32.1% Now married0.0% Separated0.0% Widowed0.0% DivorcedFemales 34.6% Never married49.0% Now married0.0% Separated2.9% Widowed13.5% DivorcedWomen who did not give birth in the past 12 months Now married:
43.7% (30)Unmarried:
56.2% (39)
Ancestries in Columbus
1,488 9.1% English1,093 6.7% American396 2.4% Irish118 0.7% Jamaican111 0.7% German108 0.7% European53 0.3% Scotch-Irish48 0.3% Czech45 0.3% Scottish38 0.2% French19 0.1% British18 0.1% Italian15 0.09% Swedish11 0.07% Brazilian11 0.07% Norwegian11 0.07% African5 0.03% Russian
Children Nativity (place of birth) in Columbus
Children under 6 years - Living with two parents Both parents native 474 100.0% NativeBoth parents foreign-born 61 100.0% NativeChildren under 6 years - Living with one parent Native parent 720 100.0% NativeChildren 6 to 17 years - Living with two parents Both parents native 488 100.0% NativeBoth parents foreign-born 36 100.0% NativeChildren 6 to 17 years - Living with one parent Native parent 2,217 99.7% Native7 0.3% Foreign-bornForeign-born parent 6 46.3% Native7 53.7% Foreign-born
Grandparents responsible for own grandchildren in Columbus
Grandparents (30 to 59 years) White / Caucasian 17 100.0% Not responsible for grandchildrenBlack or African American 86 47.5% Responsible for grandchildren94 52.5% Not responsible for grandchildrenWhite alone, not Hispanic / Latino 17 100.0% Not responsible for grandchildrenGrandparents (60 years and over) White / Caucasian 18 100.0% Not responsible for grandchildrenBlack or African American 98 89.3% Responsible for grandchildren12 10.7% Not responsible for grandchildrenWhite alone, not Hispanic / Latino 18 100.0% Not responsible for grandchildren