Races in College Park, Georgia (GA) Detailed Stats
Data:
Races - White alone (%)
Races - White alone (% change since 2000)
Races - Black alone (%)
Races - Black alone (% change since 2000)
Races - American Indian alone (%)
Races - American Indian alone (% change since 2000)
Races - Asian alone (%)
Races - Asian alone (% change since 2000)
Races - Hispanic (%)
Races - Hispanic (% change since 2000)
Races - Native Hawaiian and Other Pacific Islander alone (%)
Races - Native Hawaiian and Other Pacific Islander alone (% change since 2000)
Races - Two or more races(%)
Races - Two or more races(% change since 2000)
Races - Other race alone (%)
Races - Other race alone (% change since 2000)
Racial diversity
Place of birth - Born in state of residence (%)
Place of birth - Born in state of residence (%) - White
Place of birth - Born in state of residence (%) - Black or African American
Place of birth - Born in state of residence (%) - Asian
Place of birth - Born in state of residence (%) - Hispanic or Latino
Place of birth - Born in state of residence (%) - American Indian and Alaska Native
Place of birth - Born in state of residence (%) - Multirace
Place of birth - Born in state of residence (%) - Other Race
Place of birth - Born in other state (%)
Place of birth - Born in other state (%) - White
Place of birth - Born in other state (%) - Black or African American
Place of birth - Born in other state (%) - Asian
Place of birth - Born in other state (%) - Hispanic or Latino
Place of birth - Born in other state (%) - American Indian and Alaska Native
Place of birth - Born in other state (%) - Multirace
Place of birth - Born in other state (%) - Other Race
Place of birth - Native, outside of US (%)
Place of birth - Native, outside of US (%) - White
Place of birth - Native, outside of US (%) - Black or African American
Place of birth - Native, outside of US (%) - Asian
Place of birth - Native, outside of US (%) - Hispanic or Latino
Place of birth - Native, outside of US (%) - American Indian and Alaska Native
Place of birth - Native, outside of US (%) - Multirace
Place of birth - Native, outside of US (%) - Other Race
Place of birth - Foreign born (%)
Place of birth - Foreign born (%) - White
Place of birth - Foreign born (%) - Black or African American
Place of birth - Foreign born (%) - Asian
Place of birth - Foreign born (%) - Hispanic or Latino
Place of birth - Foreign born (%) - American Indian and Alaska Native
Place of birth - Foreign born (%) - Multirace
Place of birth - Foreign born (%) - Other Race
Residents speaking English at home (%)
Residents speaking English at home - Born in the United States (%)
Residents speaking English at home - Native, born elsewhere (%)
Residents speaking English at home - Foreign born (%)
Residents speaking Spanish at home (%)
Residents speaking Spanish at home - Born in the United States (%)
Residents speaking Spanish at home - Native, born elsewhere (%)
Residents speaking Spanish at home - Foreign born (%)
Residents speaking other language at home (%)
Residents speaking other language at home - Born in the United States (%)
Residents speaking other language at home - Native, born elsewhere (%)
Residents speaking other language at home - Foreign born (%)
Marital status - Never married (%)
Marital status - Now married (%)
Marital status - Separated (%)
Marital status - Widowed (%)
Marital status - Divorced (%)
Ancestries Reported - Arab (%)
Ancestries Reported - Czech (%)
Ancestries Reported - Danish (%)
Ancestries Reported - Dutch (%)
Ancestries Reported - English (%)
Ancestries Reported - French (%)
Ancestries Reported - French Canadian (%)
Ancestries Reported - German (%)
Ancestries Reported - Greek (%)
Ancestries Reported - Hungarian (%)
Ancestries Reported - Irish (%)
Ancestries Reported - Italian (%)
Ancestries Reported - Lithuanian (%)
Ancestries Reported - Norwegian (%)
Ancestries Reported - Polish (%)
Ancestries Reported - Portuguese (%)
Ancestries Reported - Russian (%)
Ancestries Reported - Scotch-Irish (%)
Ancestries Reported - Scottish (%)
Ancestries Reported - Slovak (%)
Ancestries Reported - Subsaharan African (%)
Ancestries Reported - Swedish (%)
Ancestries Reported - Swiss (%)
Ancestries Reported - Ukrainian (%)
Ancestries Reported - United States (%)
Ancestries Reported - Welsh (%)
Ancestries Reported - West Indian (%)
Ancestries Reported - Other (%)
Geographical mobility - Same house 1 year ago (%)
Geographical mobility - Same house 1 year ago (%) - White
Geographical mobility - Same house 1 year ago (%) - Black or African American
Geographical mobility - Same house 1 year ago (%) - Asian
Geographical mobility - Same house 1 year ago (%) - Hispanic or Latino
Geographical mobility - Same house 1 year ago (%) - American Indian and Alaska Native
Geographical mobility - Same house 1 year ago (%) - Multirace
Geographical mobility - Same house 1 year ago (%) - Other Race
Geographical mobility - Moved within same county (%)
Geographical mobility - Moved within same county (%) - White
Geographical mobility - Moved within same county (%) - Black or African American
Geographical mobility - Moved within same county (%) - Asian
Geographical mobility - Moved within same county (%) - Hispanic or Latino
Geographical mobility - Moved within same county (%) - American Indian and Alaska Native
Geographical mobility - Moved within same county (%) - Multirace
Geographical mobility - Moved within same county (%) - Other Race
Geographical mobility - Moved from different county within same state (%)
Geographical mobility - Moved from different county within same state (%) - White
Geographical mobility - Moved from different county within same state (%) - Black or African American
Geographical mobility - Moved from different county within same state (%) - Asian
Geographical mobility - Moved from different county within same state (%) - Hispanic or Latino
Geographical mobility - Moved from different county within same state (%) - American Indian and Alaska Native
Geographical mobility - Moved from different county within same state (%) - Multirace
Geographical mobility - Moved from different county within same state (%) - Other Race
Geographical mobility - Moved from different state (%)
Geographical mobility - Moved from different state (%) - White
Geographical mobility - Moved from different state (%) - Black or African American
Geographical mobility - Moved from different state (%) - Asian
Geographical mobility - Moved from different state (%) - Hispanic or Latino
Geographical mobility - Moved from different state (%) - American Indian and Alaska Native
Geographical mobility - Moved from different state (%) - Multirace
Geographical mobility - Moved from different state (%) - Other Race
Geographical mobility - Moved from abroad (%)
Geographical mobility - Moved from abroad (%) - White
Geographical mobility - Moved from abroad (%) - Black or African American
Geographical mobility - Moved from abroad (%) - Asian
Geographical mobility - Moved from abroad (%) - Hispanic or Latino
Geographical mobility - Moved from abroad (%) - American Indian and Alaska Native
Geographical mobility - Moved from abroad (%) - Multirace
Geographical mobility - Moved from abroad (%) - Other Race
Place of birth for the foreign-born population - Ireland (%)
Place of birth for the foreign-born population - Denmark (%)
Place of birth for the foreign-born population - Norway (%)
Place of birth for the foreign-born population - Sweden (%)
Place of birth for the foreign-born population - United Kingdom (%)
Place of birth for the foreign-born population - England (%)
Place of birth for the foreign-born population - Scotland (%)
Place of birth for the foreign-born population - Other Northern Europe (%)
Place of birth for the foreign-born population - Austria (%)
Place of birth for the foreign-born population - Belgium (%)
Place of birth for the foreign-born population - France (%)
Place of birth for the foreign-born population - Germany (%)
Place of birth for the foreign-born population - Netherlands (%)
Place of birth for the foreign-born population - Switzerland (%)
Place of birth for the foreign-born population - Other Western Europe (%)
Place of birth for the foreign-born population - Greece (%)
Place of birth for the foreign-born population - Italy (%)
Place of birth for the foreign-born population - Portugal (%)
Place of birth for the foreign-born population - Spain (%)
Place of birth for the foreign-born population - Other Southern Europe (%)
Place of birth for the foreign-born population - Albania (%)
Place of birth for the foreign-born population - Belarus (%)
Place of birth for the foreign-born population - Bosnia and Herzegovina (%)
Place of birth for the foreign-born population - Bulgaria (%)
Place of birth for the foreign-born population - Croatia (%)
Place of birth for the foreign-born population - Czechoslovakia (%)
Place of birth for the foreign-born population - Hungary (%)
Place of birth for the foreign-born population - Latvia (%)
Place of birth for the foreign-born population - Lithuania (%)
Place of birth for the foreign-born population - North Macedonia (Macedonia) (%)
Place of birth for the foreign-born population - Moldova (%)
Place of birth for the foreign-born population - Poland (%)
Place of birth for the foreign-born population - Romania (%)
Place of birth for the foreign-born population - Russia (%)
Place of birth for the foreign-born population - Serbia (%)
Place of birth for the foreign-born population - Ukraine (%)
Place of birth for the foreign-born population - Other Eastern Europe (%)
Place of birth for the foreign-born population - China (%)
Place of birth for the foreign-born population - Hong Kong (%)
Place of birth for the foreign-born population - Taiwan (%)
Place of birth for the foreign-born population - Japan (%)
Place of birth for the foreign-born population - Korea (%)
Place of birth for the foreign-born population - Other Eastern Asia (%)
Place of birth for the foreign-born population - Afghanistan (%)
Place of birth for the foreign-born population - Bangladesh (%)
Place of birth for the foreign-born population - India (%)
Place of birth for the foreign-born population - Iran (%)
Place of birth for the foreign-born population - Kazakhstan (%)
Place of birth for the foreign-born population - Nepal (%)
Place of birth for the foreign-born population - Pakistan (%)
Place of birth for the foreign-born population - Sri Lanka (%)
Place of birth for the foreign-born population - Uzbekistan (%)
Place of birth for the foreign-born population - Other South Central Asia (%)
Place of birth for the foreign-born population - Burma (%)
Place of birth for the foreign-born population - Cambodia (%)
Place of birth for the foreign-born population - Indonesia (%)
Place of birth for the foreign-born population - Laos (%)
Place of birth for the foreign-born population - Malaysia (%)
Place of birth for the foreign-born population - Philippines (%)
Place of birth for the foreign-born population - Singapore (%)
Place of birth for the foreign-born population - Thailand (%)
Place of birth for the foreign-born population - Vietnam (%)
Place of birth for the foreign-born population - Other South Eastern Asia (%)
Place of birth for the foreign-born population - Armenia (%)
Place of birth for the foreign-born population - Iraq (%)
Place of birth for the foreign-born population - Israel (%)
Place of birth for the foreign-born population - Jordan (%)
Place of birth for the foreign-born population - Kuwait (%)
Place of birth for the foreign-born population - Lebanon (%)
Place of birth for the foreign-born population - Saudi Arabia (%)
Place of birth for the foreign-born population - Syria (%)
Place of birth for the foreign-born population - Turkey (%)
Place of birth for the foreign-born population - Yemen (%)
Place of birth for the foreign-born population - Other Western Asia (%)
Place of birth for the foreign-born population - Eritrea (%)
Place of birth for the foreign-born population - Ethiopia (%)
Place of birth for the foreign-born population - Kenya (%)
Place of birth for the foreign-born population - Somalia (%)
Place of birth for the foreign-born population - Uganda (%)
Place of birth for the foreign-born population - Zimbabwe (%)
Place of birth for the foreign-born population - Other Eastern Africa (%)
Place of birth for the foreign-born population - Cameroon (%)
Place of birth for the foreign-born population - Congo (%)
Place of birth for the foreign-born population - Democratic Republic of Congo (Zaire) (%)
Place of birth for the foreign-born population - Other Middle Africa (%)
Place of birth for the foreign-born population - Egypt (%)
Place of birth for the foreign-born population - Morocco (%)
Place of birth for the foreign-born population - Sudan (%)
Place of birth for the foreign-born population - Other Northern Africa (%)
Place of birth for the foreign-born population - South Africa (%)
Place of birth for the foreign-born population - Other Southern Africa (%)
Place of birth for the foreign-born population - Cabo Verde (%)
Place of birth for the foreign-born population - Ghana (%)
Place of birth for the foreign-born population - Liberia (%)
Place of birth for the foreign-born population - Nigeria (%)
Place of birth for the foreign-born population - Senegal (%)
Place of birth for the foreign-born population - Sierra Leone (%)
Place of birth for the foreign-born population - Other Western Africa (%)
Place of birth for the foreign-born population - Australia (%)
Place of birth for the foreign-born population - New Zealand (%)
Place of birth for the foreign-born population - Fiji (%)
Place of birth for the foreign-born population - Micronesia (%)
Place of birth for the foreign-born population - Bahamas (%)
Place of birth for the foreign-born population - Barbados (%)
Place of birth for the foreign-born population - Cuba (%)
Place of birth for the foreign-born population - Dominica (%)
Place of birth for the foreign-born population - Dominican Republic (%)
Place of birth for the foreign-born population - Grenada (%)
Place of birth for the foreign-born population - Haiti (%)
Place of birth for the foreign-born population - Jamaica (%)
Place of birth for the foreign-born population - St. Vincent and the Grenadines (%)
Place of birth for the foreign-born population - Trinidad and Tobago (%)
Place of birth for the foreign-born population - West Indies (%)
Place of birth for the foreign-born population - Other Caribbean (%)
Place of birth for the foreign-born population - Belize (%)
Place of birth for the foreign-born population - Costa Rica (%)
Place of birth for the foreign-born population - El Salvador (%)
Place of birth for the foreign-born population - Guatemala (%)
Place of birth for the foreign-born population - Honduras (%)
Place of birth for the foreign-born population - Mexico (%)
Place of birth for the foreign-born population - Nicaragua (%)
Place of birth for the foreign-born population - Panama (%)
Place of birth for the foreign-born population - Other Central America (%)
Place of birth for the foreign-born population - Argentina (%)
Place of birth for the foreign-born population - Bolivia (%)
Place of birth for the foreign-born population - Brazil (%)
Place of birth for the foreign-born population - Chile (%)
Place of birth for the foreign-born population - Colombia (%)
Place of birth for the foreign-born population - Ecuador (%)
Place of birth for the foreign-born population - Guyana (%)
Place of birth for the foreign-born population - Peru (%)
Place of birth for the foreign-born population - Uruguay (%)
Place of birth for the foreign-born population - Venezuela (%)
Place of birth for the foreign-born population - Other South America (%)
Place of birth for the foreign-born population - Canada (%)
Place of birth for the foreign-born population - Other Northern America (%)
Place of birth for the foreign-born population - Other (%)
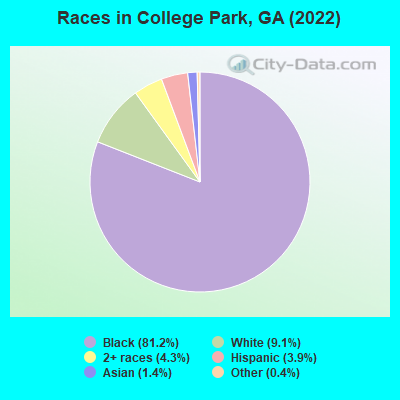
According to 2022 data, the most numerous races in College Park, GA are White alone (1,301 residents), Black alone (11,600 residents), and Hispanic (555 residents). 91.2% of College Park residents speak English at home. 6.2% of College Park, GA residents are foreign-born (2.6% born in Latin America, 2.0% born in Africa, 1.2% born in Asia), which is 60.5% less than the foreign-born rate of 10.0% across the entire state of Georgia.
Race distribution in College Park
2000 2022
5,128,661 62.6% White alone 2,331,465 28.5% Black alone 435,227 5.3% Hispanic 171,513 2.1% Asian alone 87,364 1.1% Two or more races 17,670 0.2% American Indian alone 11,275 0.1% Other race alone 3,278 0.04% Native Hawaiian and Other
5,415,657 49.6% White alone 3,349,240 30.7% Black alone 1,132,604 10.4% Hispanic 479,156 4.4% Asian alone 462,923 4.2% Two or more races 54,416 0.5% Other race alone 11,923 0.1% American Indian alone 6,957 0.06% Native Hawaiian and Other
Income and house value in College Park Median household income in 2022 $99,826 White non-Hispanic householders$51,027 Black householders$162,278 Asian householders$42,732 Some other race householders$57,439 Two or more races householders$60,055 Hispanic or Latino race householdersMedian 2022 house value $372,640 White Non-Hispanic householders$316,760 Black or African American householders$454,641 American Indian or Alaska Native householders $642,779 Asian householders$281,050 Some other race householders$291,962 Two or more races householders$278,736 Hispanic or Latino householders
Median age by race in College Park
52.1 Median age for White residents57.8 50.9 31.6 Median age for Black or African American residents28.4 32.5 -764,932,561.9 Median age for American Indian / Alaska Native residents-507,017,543.4 -1,009,920,633.9 58.7 Median age for Asian residents58.9 56.2 -866,062,436.2 Median age for Native Hawaiian / Pacific Islander residents-658,602,149.9 -776,776,776.0 38.9 Median age for Other race residents22.6 35.0 14.3 Median age for Two or more races residents10.6 24.6 52.7 Median age for White alone residents57.5 47.9 32.5 Median age for Hispanic or Latino residents20.1 44.0
Owner/renter occupied households by race in College Park
House owners and renters - White residents 456 62.1% Owner occupied278 37.9% Renter occupiedHouse owners and renters - Black or African American residents 920 19.2% Owner occupied3,875 80.8% Renter occupiedHouse owners and renters - Asian residents 97 79.7% Owner occupied25 20.3% Renter occupiedHouse owners and renters - Other race residents 20 12.4% Owner occupied141 87.6% Renter occupiedHouse owners and renters - Two or more races residents 51 26.7% Owner occupied139 73.3% Renter occupiedHouse owners and renters - White alone residents 458 61.1% Owner occupied291 38.9% Renter occupiedHouse owners and renters - Hispanic or Latino residents 49 29.7% Owner occupied117 70.3% Renter occupied
Language usage in College Park
English speakers - Total 91.2% of residents of College Park speak English at home.
4.7% of residents speak Spanish at home 428 68.2% Speak English very well200 31.8% Speak English less than very well4.0% of residents speak other language at home 474 88.4% Speak English very well62 11.6% Speak English less than very well
English speakers - Born in the United States 96.6% of residents of College Park speak English at home.
2.6% of residents speak Spanish at home 124 100.0% Speak English very well0.9% of residents speak other language at home 41 100.0% Speak English very well
English speakers - Native, born elsewhere 73.2% of residents of College Park speak English at home.
10.3% of residents speak Spanish at home 23 100.0% Speak English very well16.1% of residents speak other language at home 36 100.0% Speak English very well
English speakers - Foreign-born 27.2% of residents of College Park speak English at home.
25.0% of residents speak Spanish at home 51 23.8% Speak English very well163 76.2% Speak English less than very well47.3% of residents speak other language at home 356 87.9% Speak English very well49 12.1% Speak English less than very well
White (Caucasian) - Speak only English Native:
98.4% (1,250)Foreign-born:
28.7% (10)
White (Caucasian) - Speak another language Native:
2.2% (27)Foreign-born:
69.9% (26)
Black or African American - Speak only English Native:
97.8% (9,966)Foreign-born:
41.7% (241)
Black or African American - Speak another language Native:
2.2% (228)Foreign-born:
58.0% (335)
Asian - Speak another language Native:
58.6% (24)Foreign-born:
100.0% (157)
Other race - Speak only English Native:
19.7% (55)Foreign-born:
4.7% (10)
Other race - Speak another language Native:
82.5% (229)Foreign-born:
96.4% (210)
Two or more races - Speak only English Native:
87.8% (563)Foreign-born:
94.3% (19)
White alone - Speak only English Native:
96.7% (1,215)Foreign-born:
100.0% (11)
Hispanic or Latino - Speak only English Native:
39.6% (127)Foreign-born:
5.3% (12)
Hispanic or Latino - Speak another language Native:
60.2% (193)Foreign-born:
95.1% (211)
Foreign-born residents in College Park 890 residents are foreign born (2.6% Latin America , 2.0% Africa , 1.2% Asia ).
This city:
6.2%Georgia:
10.4%
Marital status for residents in College Park Marital status - White (Caucasian) population 15 years and over
Males 24.0% Never married39.0% Now married0.0% Separated6.5% Widowed30.6% DivorcedFemales 28.9% Never married26.5% Now married22.0% Separated8.2% Widowed14.4% DivorcedWomen who gave birth in the past 12 months Now married:
0.0% (0)Unmarried:
100.0% (8)
Women who did not give birth in the past 12 months Now married:
65.9% (203)Unmarried:
34.1% (105)
Marital status - Black or African American population 15 years and over
Males 56.7% Never married27.4% Now married3.8% Separated1.6% Widowed10.5% DivorcedFemales 59.3% Never married22.5% Now married0.9% Separated5.0% Widowed12.3% DivorcedWomen who gave birth in the past 12 months Now married:
6.2% (19)Unmarried:
93.8% (288)
Women who did not give birth in the past 12 months Now married:
22.6% (682)Unmarried:
77.4% (2,334)
Marital status - Asian population 15 years and over
Males 0.0% Never married100.0% Now married0.0% Separated0.0% Widowed0.0% DivorcedFemales 20.0% Never married40.0% Now married0.0% Separated11.4% Widowed28.6% DivorcedWomen who gave birth in the past 12 months Now married:
100.0% (6)Unmarried:
0.0% (0)
Women who did not give birth in the past 12 months Now married:
46.2% (18)Unmarried:
53.8% (21)
Marital status - Other race population 15 years and over
Males 37.7% Never married62.3% Now married0.0% Separated0.0% Widowed0.0% DivorcedFemales 23.7% Never married32.4% Now married5.0% Separated0.0% Widowed38.8% DivorcedWomen who did not give birth in the past 12 months Now married:
47.3% (77)Unmarried:
52.7% (86)
Marital status - Two or more races population 15 years and over
Males 71.2% Never married15.4% Now married13.5% Separated0.0% Widowed0.0% DivorcedFemales 48.7% Never married35.3% Now married0.0% Separated0.0% Widowed16.0% DivorcedWomen who gave birth in the past 12 months Now married:
100.0% (21)Unmarried:
0.0% (0)
Women who did not give birth in the past 12 months Now married:
22.9% (37)Unmarried:
77.1% (126)
Marital status - White alone, not Hispanic / Latino population 15 years and over
Males 23.9% Never married38.0% Now married0.0% Separated6.7% Widowed31.5% DivorcedFemales 26.7% Never married27.6% Now married22.9% Separated7.8% Widowed15.0% DivorcedWomen who gave birth in the past 12 months Now married:
0.0% (0)Unmarried:
100.0% (9)
Women who did not give birth in the past 12 months Now married:
65.9% (210)Unmarried:
34.1% (109)
Marital status - Hispanic or Latino population 15 years and over
Males 50.6% Never married49.4% Now married0.0% Separated0.0% Widowed0.0% DivorcedFemales 37.6% Never married39.2% Now married3.9% Separated2.8% Widowed16.6% DivorcedWomen who did not give birth in the past 12 months Now married:
62.0% (71)Unmarried:
38.0% (43)
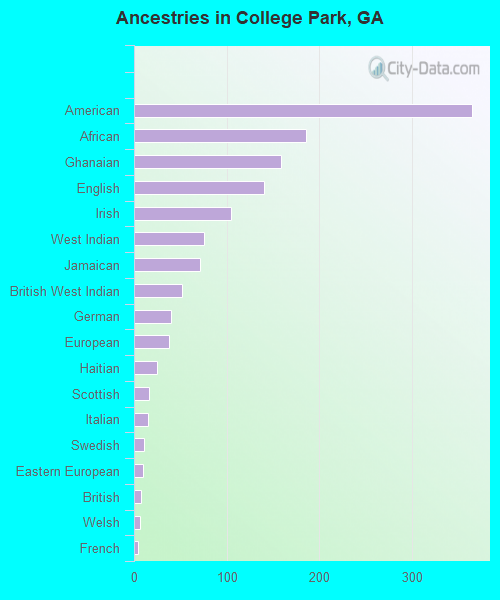
Ancestries in College Park
365 3.3% American186 1.7% African159 1.4% Ghanaian140 1.3% English105 0.9% Irish76 0.7% West Indian71 0.6% Jamaican52 0.5% British West Indian40 0.4% German38 0.3% European25 0.2% Haitian16 0.1% Scottish15 0.1% Italian11 0.10% Swedish10 0.09% Eastern European8 0.07% British6 0.05% Welsh4 0.04% French2 0.02% Slovene
Children Nativity (place of birth) in College Park
Children under 6 years - Living with two parents Both parents native 92 100.0% NativeBoth parents foreign-born 12 100.0% NativeOne native, one foreign-born parent 153 100.0% NativeChildren under 6 years - Living with one parent Native parent 826 100.0% NativeForeign-born parent 10 100.0% NativeChildren 6 to 17 years - Living with two parents Both parents native 583 100.0% NativeBoth parents foreign-born 135 100.0% NativeOne native, one foreign-born parent 66 100.0% NativeChildren 6 to 17 years - Living with one parent Native parent 1,684 100.0% NativeForeign-born parent 53 53.0% Native47 47.0% Foreign-born
Grandparents responsible for own grandchildren in College Park
Grandparents (30 to 59 years) Black or African American 65 31.3% Responsible for grandchildren144 68.7% Not responsible for grandchildrenGrandparents (60 years and over) Black or African American 21 37.0% Responsible for grandchildren36 63.0% Not responsible for grandchildren