Races in Colbert, Washington (WA) Detailed Stats
Ancestries, Foreign-born residents, place of birth
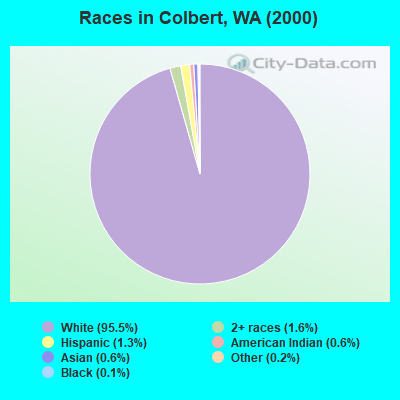
Race distribution in Colbert

- 8,96595.5%White alone
- 1461.6%Two or more races
- 1251.3%Hispanic
- 570.6%Asian alone
- 590.6%American Indian alone
- 160.2%Other race alone
- 140.1%Black alone
- 30.03%Native Hawaiian and Other
Pacific Islander alone
2000
2022
-
- 4,652,49078.9%White alone
- 441,5097.5%Hispanic
- 319,4015.4%Asian alone
- 184,6313.1%Black alone
- 175,9263.0%Two or more races
- 85,3961.4%American Indian alone
- 22,7790.4%Native Hawaiian and Other
Pacific Islander alone - 11,9890.2%Other race alone

-
- 4,941,45663.5%White alone
- 1,093,31314.0%Hispanic
- 755,8329.7%Asian alone
- 523,4486.7%Two or more races
- 299,5373.8%Black alone
- 69,0240.9%American Indian alone
- 52,2310.7%Native Hawaiian and Other
Pacific Islander alone - 50,9450.7%Other race alone

Income and house value in Colbert
- Median household income in 2022
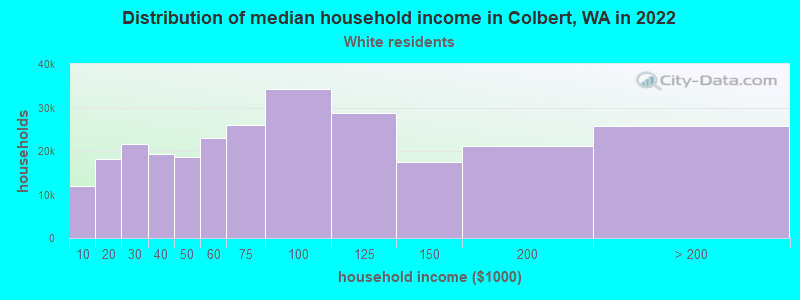
- $96,948White non-Hispanic householders
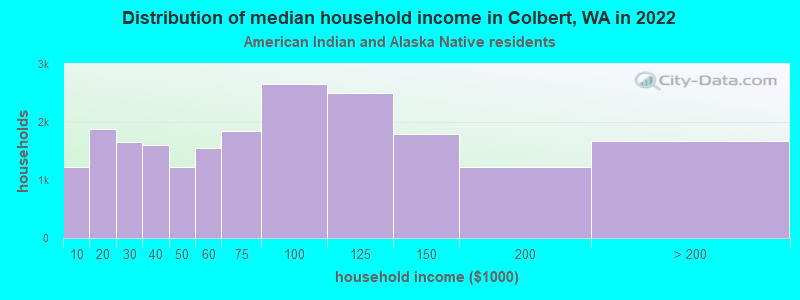
- $101,822American Indian and Alaska Native householders
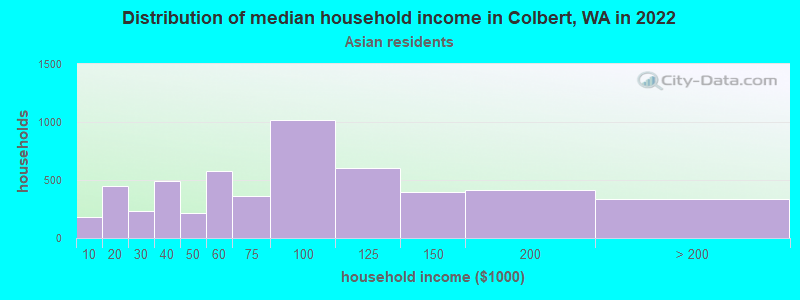
- $111,833Asian householders
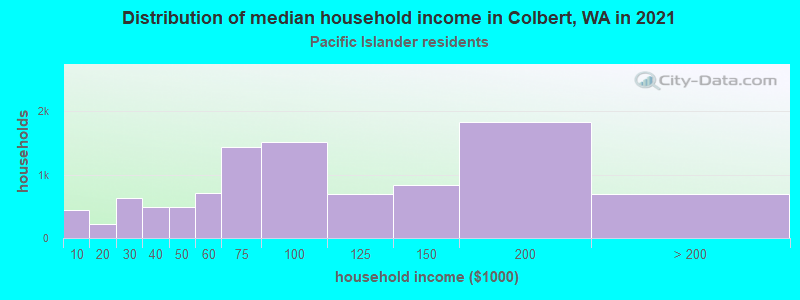
- $35,312Native Hawaiian and other Pacific Islander householders
- $121,389Some other race householders
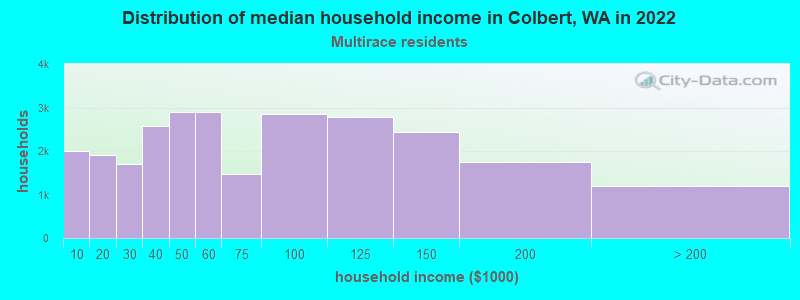
- $115,574Two or more races householders
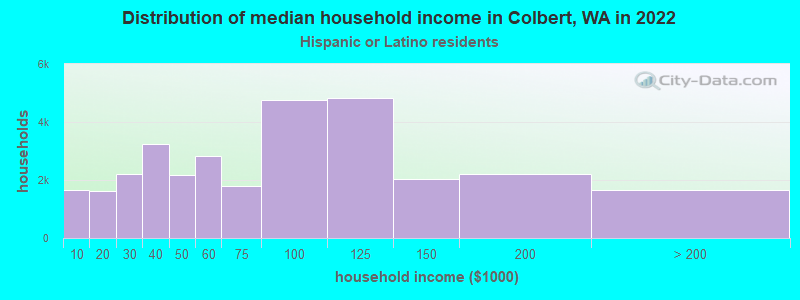
- over $200,000Hispanic or Latino race householders
- Median 2022 house value
- $646,790White Non-Hispanic householders
- $317,603American Indian or Alaska Native householders
- over $1,000,000Asian householders
- $280,238Native Hawaiian and other Pacific Islander householders
- $607,183Two or more races householders
- $791,019Hispanic or Latino householders
Household income for White non-Hispanic householders
Household income for American Indian and Alaska Native householders
Household income for Asian householders
Household income for Native Hawaiian and other Pacific Islander householders
Household income for Two or more races householders
Household income for Hispanic or Latino race householders
Zip code: 99003