Races in Coconut Creek, Florida (FL) Detailed Stats
Data:
Races - White alone (%)
Races - White alone (% change since 2000)
Races - Black alone (%)
Races - Black alone (% change since 2000)
Races - American Indian alone (%)
Races - American Indian alone (% change since 2000)
Races - Asian alone (%)
Races - Asian alone (% change since 2000)
Races - Hispanic (%)
Races - Hispanic (% change since 2000)
Races - Native Hawaiian and Other Pacific Islander alone (%)
Races - Native Hawaiian and Other Pacific Islander alone (% change since 2000)
Races - Two or more races(%)
Races - Two or more races(% change since 2000)
Races - Other race alone (%)
Races - Other race alone (% change since 2000)
Racial diversity
Place of birth - Born in state of residence (%)
Place of birth - Born in state of residence (%) - White
Place of birth - Born in state of residence (%) - Black or African American
Place of birth - Born in state of residence (%) - Asian
Place of birth - Born in state of residence (%) - Hispanic or Latino
Place of birth - Born in state of residence (%) - American Indian and Alaska Native
Place of birth - Born in state of residence (%) - Multirace
Place of birth - Born in state of residence (%) - Other Race
Place of birth - Born in other state (%)
Place of birth - Born in other state (%) - White
Place of birth - Born in other state (%) - Black or African American
Place of birth - Born in other state (%) - Asian
Place of birth - Born in other state (%) - Hispanic or Latino
Place of birth - Born in other state (%) - American Indian and Alaska Native
Place of birth - Born in other state (%) - Multirace
Place of birth - Born in other state (%) - Other Race
Place of birth - Native, outside of US (%)
Place of birth - Native, outside of US (%) - White
Place of birth - Native, outside of US (%) - Black or African American
Place of birth - Native, outside of US (%) - Asian
Place of birth - Native, outside of US (%) - Hispanic or Latino
Place of birth - Native, outside of US (%) - American Indian and Alaska Native
Place of birth - Native, outside of US (%) - Multirace
Place of birth - Native, outside of US (%) - Other Race
Place of birth - Foreign born (%)
Place of birth - Foreign born (%) - White
Place of birth - Foreign born (%) - Black or African American
Place of birth - Foreign born (%) - Asian
Place of birth - Foreign born (%) - Hispanic or Latino
Place of birth - Foreign born (%) - American Indian and Alaska Native
Place of birth - Foreign born (%) - Multirace
Place of birth - Foreign born (%) - Other Race
Residents speaking English at home (%)
Residents speaking English at home - Born in the United States (%)
Residents speaking English at home - Native, born elsewhere (%)
Residents speaking English at home - Foreign born (%)
Residents speaking Spanish at home (%)
Residents speaking Spanish at home - Born in the United States (%)
Residents speaking Spanish at home - Native, born elsewhere (%)
Residents speaking Spanish at home - Foreign born (%)
Residents speaking other language at home (%)
Residents speaking other language at home - Born in the United States (%)
Residents speaking other language at home - Native, born elsewhere (%)
Residents speaking other language at home - Foreign born (%)
Marital status - Never married (%)
Marital status - Now married (%)
Marital status - Separated (%)
Marital status - Widowed (%)
Marital status - Divorced (%)
Ancestries Reported - Arab (%)
Ancestries Reported - Czech (%)
Ancestries Reported - Danish (%)
Ancestries Reported - Dutch (%)
Ancestries Reported - English (%)
Ancestries Reported - French (%)
Ancestries Reported - French Canadian (%)
Ancestries Reported - German (%)
Ancestries Reported - Greek (%)
Ancestries Reported - Hungarian (%)
Ancestries Reported - Irish (%)
Ancestries Reported - Italian (%)
Ancestries Reported - Lithuanian (%)
Ancestries Reported - Norwegian (%)
Ancestries Reported - Polish (%)
Ancestries Reported - Portuguese (%)
Ancestries Reported - Russian (%)
Ancestries Reported - Scotch-Irish (%)
Ancestries Reported - Scottish (%)
Ancestries Reported - Slovak (%)
Ancestries Reported - Subsaharan African (%)
Ancestries Reported - Swedish (%)
Ancestries Reported - Swiss (%)
Ancestries Reported - Ukrainian (%)
Ancestries Reported - United States (%)
Ancestries Reported - Welsh (%)
Ancestries Reported - West Indian (%)
Ancestries Reported - Other (%)
Geographical mobility - Same house 1 year ago (%)
Geographical mobility - Same house 1 year ago (%) - White
Geographical mobility - Same house 1 year ago (%) - Black or African American
Geographical mobility - Same house 1 year ago (%) - Asian
Geographical mobility - Same house 1 year ago (%) - Hispanic or Latino
Geographical mobility - Same house 1 year ago (%) - American Indian and Alaska Native
Geographical mobility - Same house 1 year ago (%) - Multirace
Geographical mobility - Same house 1 year ago (%) - Other Race
Geographical mobility - Moved within same county (%)
Geographical mobility - Moved within same county (%) - White
Geographical mobility - Moved within same county (%) - Black or African American
Geographical mobility - Moved within same county (%) - Asian
Geographical mobility - Moved within same county (%) - Hispanic or Latino
Geographical mobility - Moved within same county (%) - American Indian and Alaska Native
Geographical mobility - Moved within same county (%) - Multirace
Geographical mobility - Moved within same county (%) - Other Race
Geographical mobility - Moved from different county within same state (%)
Geographical mobility - Moved from different county within same state (%) - White
Geographical mobility - Moved from different county within same state (%) - Black or African American
Geographical mobility - Moved from different county within same state (%) - Asian
Geographical mobility - Moved from different county within same state (%) - Hispanic or Latino
Geographical mobility - Moved from different county within same state (%) - American Indian and Alaska Native
Geographical mobility - Moved from different county within same state (%) - Multirace
Geographical mobility - Moved from different county within same state (%) - Other Race
Geographical mobility - Moved from different state (%)
Geographical mobility - Moved from different state (%) - White
Geographical mobility - Moved from different state (%) - Black or African American
Geographical mobility - Moved from different state (%) - Asian
Geographical mobility - Moved from different state (%) - Hispanic or Latino
Geographical mobility - Moved from different state (%) - American Indian and Alaska Native
Geographical mobility - Moved from different state (%) - Multirace
Geographical mobility - Moved from different state (%) - Other Race
Geographical mobility - Moved from abroad (%)
Geographical mobility - Moved from abroad (%) - White
Geographical mobility - Moved from abroad (%) - Black or African American
Geographical mobility - Moved from abroad (%) - Asian
Geographical mobility - Moved from abroad (%) - Hispanic or Latino
Geographical mobility - Moved from abroad (%) - American Indian and Alaska Native
Geographical mobility - Moved from abroad (%) - Multirace
Geographical mobility - Moved from abroad (%) - Other Race
Place of birth for the foreign-born population - Ireland (%)
Place of birth for the foreign-born population - Denmark (%)
Place of birth for the foreign-born population - Norway (%)
Place of birth for the foreign-born population - Sweden (%)
Place of birth for the foreign-born population - United Kingdom (%)
Place of birth for the foreign-born population - England (%)
Place of birth for the foreign-born population - Scotland (%)
Place of birth for the foreign-born population - Other Northern Europe (%)
Place of birth for the foreign-born population - Austria (%)
Place of birth for the foreign-born population - Belgium (%)
Place of birth for the foreign-born population - France (%)
Place of birth for the foreign-born population - Germany (%)
Place of birth for the foreign-born population - Netherlands (%)
Place of birth for the foreign-born population - Switzerland (%)
Place of birth for the foreign-born population - Other Western Europe (%)
Place of birth for the foreign-born population - Greece (%)
Place of birth for the foreign-born population - Italy (%)
Place of birth for the foreign-born population - Portugal (%)
Place of birth for the foreign-born population - Spain (%)
Place of birth for the foreign-born population - Other Southern Europe (%)
Place of birth for the foreign-born population - Albania (%)
Place of birth for the foreign-born population - Belarus (%)
Place of birth for the foreign-born population - Bosnia and Herzegovina (%)
Place of birth for the foreign-born population - Bulgaria (%)
Place of birth for the foreign-born population - Croatia (%)
Place of birth for the foreign-born population - Czechoslovakia (%)
Place of birth for the foreign-born population - Hungary (%)
Place of birth for the foreign-born population - Latvia (%)
Place of birth for the foreign-born population - Lithuania (%)
Place of birth for the foreign-born population - North Macedonia (Macedonia) (%)
Place of birth for the foreign-born population - Moldova (%)
Place of birth for the foreign-born population - Poland (%)
Place of birth for the foreign-born population - Romania (%)
Place of birth for the foreign-born population - Russia (%)
Place of birth for the foreign-born population - Serbia (%)
Place of birth for the foreign-born population - Ukraine (%)
Place of birth for the foreign-born population - Other Eastern Europe (%)
Place of birth for the foreign-born population - China (%)
Place of birth for the foreign-born population - Hong Kong (%)
Place of birth for the foreign-born population - Taiwan (%)
Place of birth for the foreign-born population - Japan (%)
Place of birth for the foreign-born population - Korea (%)
Place of birth for the foreign-born population - Other Eastern Asia (%)
Place of birth for the foreign-born population - Afghanistan (%)
Place of birth for the foreign-born population - Bangladesh (%)
Place of birth for the foreign-born population - India (%)
Place of birth for the foreign-born population - Iran (%)
Place of birth for the foreign-born population - Kazakhstan (%)
Place of birth for the foreign-born population - Nepal (%)
Place of birth for the foreign-born population - Pakistan (%)
Place of birth for the foreign-born population - Sri Lanka (%)
Place of birth for the foreign-born population - Uzbekistan (%)
Place of birth for the foreign-born population - Other South Central Asia (%)
Place of birth for the foreign-born population - Burma (%)
Place of birth for the foreign-born population - Cambodia (%)
Place of birth for the foreign-born population - Indonesia (%)
Place of birth for the foreign-born population - Laos (%)
Place of birth for the foreign-born population - Malaysia (%)
Place of birth for the foreign-born population - Philippines (%)
Place of birth for the foreign-born population - Singapore (%)
Place of birth for the foreign-born population - Thailand (%)
Place of birth for the foreign-born population - Vietnam (%)
Place of birth for the foreign-born population - Other South Eastern Asia (%)
Place of birth for the foreign-born population - Armenia (%)
Place of birth for the foreign-born population - Iraq (%)
Place of birth for the foreign-born population - Israel (%)
Place of birth for the foreign-born population - Jordan (%)
Place of birth for the foreign-born population - Kuwait (%)
Place of birth for the foreign-born population - Lebanon (%)
Place of birth for the foreign-born population - Saudi Arabia (%)
Place of birth for the foreign-born population - Syria (%)
Place of birth for the foreign-born population - Turkey (%)
Place of birth for the foreign-born population - Yemen (%)
Place of birth for the foreign-born population - Other Western Asia (%)
Place of birth for the foreign-born population - Eritrea (%)
Place of birth for the foreign-born population - Ethiopia (%)
Place of birth for the foreign-born population - Kenya (%)
Place of birth for the foreign-born population - Somalia (%)
Place of birth for the foreign-born population - Uganda (%)
Place of birth for the foreign-born population - Zimbabwe (%)
Place of birth for the foreign-born population - Other Eastern Africa (%)
Place of birth for the foreign-born population - Cameroon (%)
Place of birth for the foreign-born population - Congo (%)
Place of birth for the foreign-born population - Democratic Republic of Congo (Zaire) (%)
Place of birth for the foreign-born population - Other Middle Africa (%)
Place of birth for the foreign-born population - Egypt (%)
Place of birth for the foreign-born population - Morocco (%)
Place of birth for the foreign-born population - Sudan (%)
Place of birth for the foreign-born population - Other Northern Africa (%)
Place of birth for the foreign-born population - South Africa (%)
Place of birth for the foreign-born population - Other Southern Africa (%)
Place of birth for the foreign-born population - Cabo Verde (%)
Place of birth for the foreign-born population - Ghana (%)
Place of birth for the foreign-born population - Liberia (%)
Place of birth for the foreign-born population - Nigeria (%)
Place of birth for the foreign-born population - Senegal (%)
Place of birth for the foreign-born population - Sierra Leone (%)
Place of birth for the foreign-born population - Other Western Africa (%)
Place of birth for the foreign-born population - Australia (%)
Place of birth for the foreign-born population - New Zealand (%)
Place of birth for the foreign-born population - Fiji (%)
Place of birth for the foreign-born population - Micronesia (%)
Place of birth for the foreign-born population - Bahamas (%)
Place of birth for the foreign-born population - Barbados (%)
Place of birth for the foreign-born population - Cuba (%)
Place of birth for the foreign-born population - Dominica (%)
Place of birth for the foreign-born population - Dominican Republic (%)
Place of birth for the foreign-born population - Grenada (%)
Place of birth for the foreign-born population - Haiti (%)
Place of birth for the foreign-born population - Jamaica (%)
Place of birth for the foreign-born population - St. Vincent and the Grenadines (%)
Place of birth for the foreign-born population - Trinidad and Tobago (%)
Place of birth for the foreign-born population - West Indies (%)
Place of birth for the foreign-born population - Other Caribbean (%)
Place of birth for the foreign-born population - Belize (%)
Place of birth for the foreign-born population - Costa Rica (%)
Place of birth for the foreign-born population - El Salvador (%)
Place of birth for the foreign-born population - Guatemala (%)
Place of birth for the foreign-born population - Honduras (%)
Place of birth for the foreign-born population - Mexico (%)
Place of birth for the foreign-born population - Nicaragua (%)
Place of birth for the foreign-born population - Panama (%)
Place of birth for the foreign-born population - Other Central America (%)
Place of birth for the foreign-born population - Argentina (%)
Place of birth for the foreign-born population - Bolivia (%)
Place of birth for the foreign-born population - Brazil (%)
Place of birth for the foreign-born population - Chile (%)
Place of birth for the foreign-born population - Colombia (%)
Place of birth for the foreign-born population - Ecuador (%)
Place of birth for the foreign-born population - Guyana (%)
Place of birth for the foreign-born population - Peru (%)
Place of birth for the foreign-born population - Uruguay (%)
Place of birth for the foreign-born population - Venezuela (%)
Place of birth for the foreign-born population - Other South America (%)
Place of birth for the foreign-born population - Canada (%)
Place of birth for the foreign-born population - Other Northern America (%)
Place of birth for the foreign-born population - Other (%)
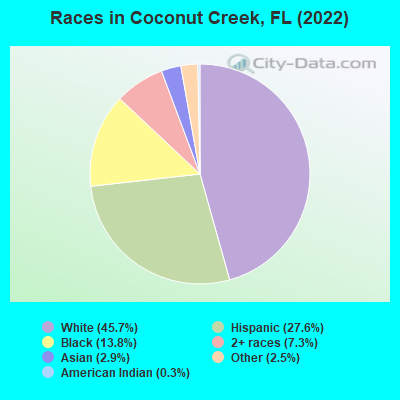
According to 2022 data, the most numerous races in Coconut Creek, FL are White alone (26,372 residents), Hispanic (15,943 residents), and Black alone (7,962 residents). 57.5% of Coconut Creek residents speak English at home. 35.8% of Coconut Creek, FL residents are foreign-born (27.1% born in Latin America), which is 41.3% greater than the foreign-born rate of 21.0% across the entire state of Florida.
Race distribution in Coconut Creek
2000 2022
33,909 77.8% White alone 5,076 11.7% Hispanic 2,584 5.9% Black alone 1,018 2.3% Asian alone 654 1.5% Two or more races 256 0.6% Other race alone 47 0.1% American Indian alone 22 0.05% Native Hawaiian and Other
26,372 45.7% White alone 15,943 27.6% Hispanic 7,962 13.8% Black alone 4,229 7.3% Two or more races 1,684 2.9% Asian alone 1,441 2.5% Other race alone 155 0.3% American Indian alone
2000 2022
10,458,509 65.4% White alone 2,682,715 16.8% Hispanic 2,264,268 14.2% Black alone 261,693 1.6% Asian alone 236,954 1.5% Two or more races 42,358 0.3% American Indian alone 28,994 0.2% Other race alone 6,887 0.04% Native Hawaiian and Other
11,309,403 50.8% White alone 6,025,039 27.1% Hispanic 3,241,015 14.6% Black alone 861,630 3.9% Two or more races 623,692 2.8% Asian alone 152,054 0.7% Other race alone 22,504 0.1% American Indian alone 9,486 0.04% Native Hawaiian and Other
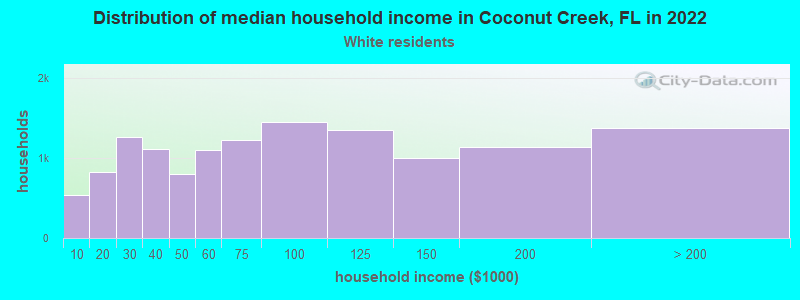
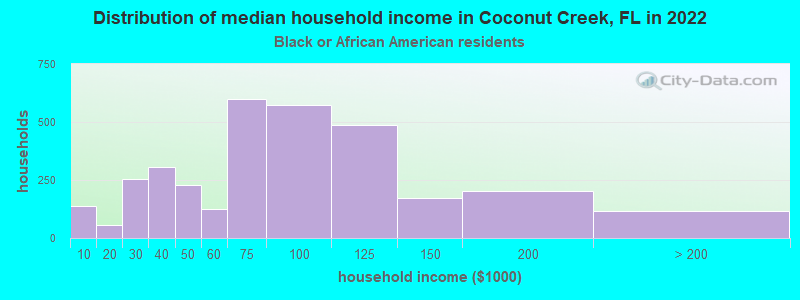
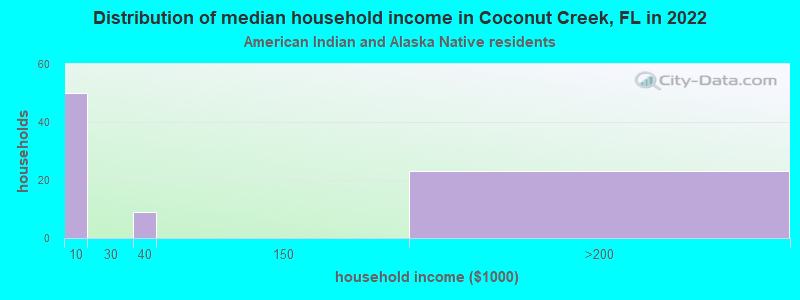
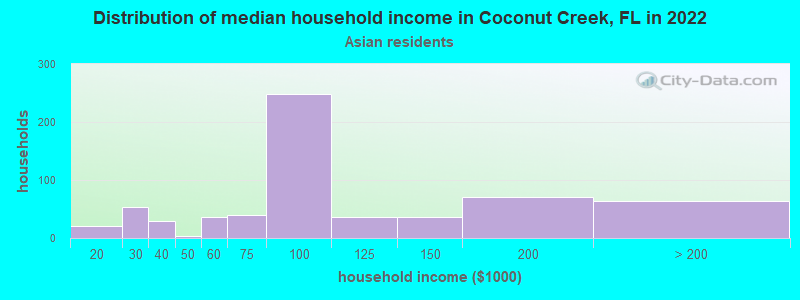
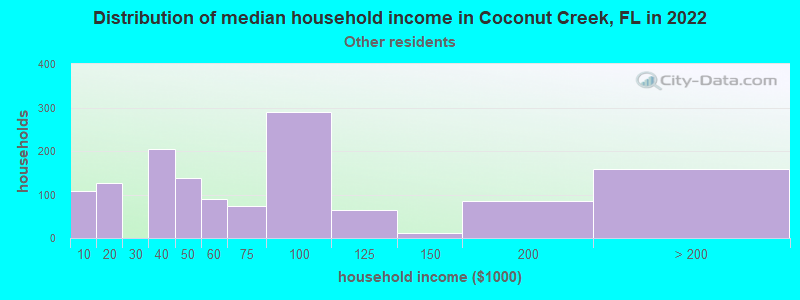
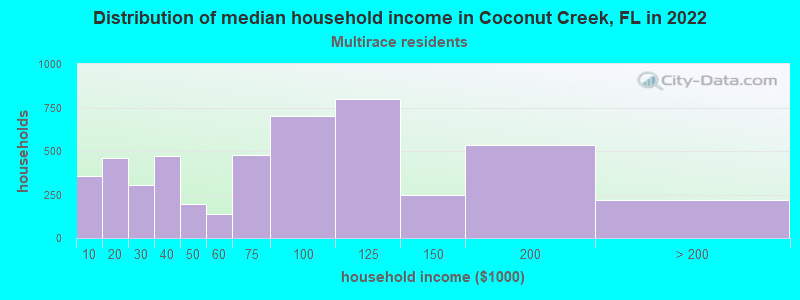
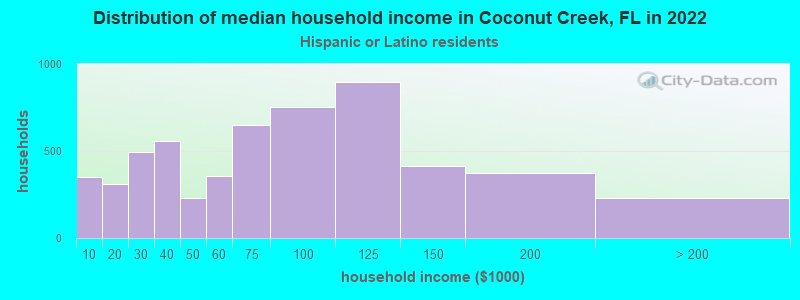
Income and house value in Coconut Creek Median household income in 2022 $73,166 White non-Hispanic householders$71,435 Black householders$91,942 Asian householders$62,484 Some other race householders$75,499 Two or more races householders$69,613 Hispanic or Latino race householdersMedian 2022 house value $447,799 White Non-Hispanic householders$480,216 Black or African American householders$546,322 American Indian or Alaska Native householders $468,457 Asian householders$495,789 Some other race householders$405,530 Two or more races householders$447,164 Hispanic or Latino householders
Median age by race in Coconut Creek
48.7 Median age for White residents43.2 53.4 41.1 Median age for Black or African American residents40.3 41.8 46.8 Median age for American Indian / Alaska Native residents20.1 64.1 44.4 Median age for Asian residents51.1 37.2 -437,357,630.5 Median age for Native Hawaiian / Pacific Islander residents-454,756,380.1 -666,666,666.0 33.3 Median age for Other race residents35.8 29.1 39.5 Median age for Two or more races residents37.4 39.7 50.2 Median age for White alone residents44.5 54.4 37.9 Median age for Hispanic or Latino residents36.6 38.6
Owner/renter occupied households by race in Coconut Creek
House owners and renters - White residents 9,732 73.7% Owner occupied3,472 26.3% Renter occupiedHouse owners and renters - Black or African American residents 1,732 53.6% Owner occupied1,501 46.4% Renter occupiedHouse owners and renters - American Indian / Alaska Native residents 74 80.9% Owner occupied17 19.1% Renter occupiedHouse owners and renters - Asian residents 420 69.4% Owner occupied185 30.6% Renter occupiedHouse owners and renters - Other race residents 614 47.3% Owner occupied684 52.7% Renter occupiedHouse owners and renters - Two or more races residents 2,613 52.2% Owner occupied2,389 47.8% Renter occupiedHouse owners and renters - White alone residents 9,350 74.8% Owner occupied3,154 25.2% Renter occupiedHouse owners and renters - Hispanic or Latino residents 3,145 54.9% Owner occupied2,588 45.1% Renter occupied
Language usage in Coconut Creek
English speakers - Total 57.5% of residents of Coconut Creek speak English at home.
24.1% of residents speak Spanish at home 8,757 66.8% Speak English very well4,351 33.2% Speak English less than very well18.2% of residents speak other language at home 6,126 62.0% Speak English very well3,755 38.0% Speak English less than very well
English speakers - Born in the United States 86.2% of residents of Coconut Creek speak English at home.
7.4% of residents speak Spanish at home 1,187 91.6% Speak English very well109 8.4% Speak English less than very well7.0% of residents speak other language at home 1,134 92.8% Speak English very well88 7.2% Speak English less than very well
English speakers - Native, born elsewhere 34.2% of residents of Coconut Creek speak English at home.
54.0% of residents speak Spanish at home 720 84.4% Speak English very well133 15.6% Speak English less than very well12.5% of residents speak other language at home 94 47.5% Speak English very well104 52.5% Speak English less than very well
English speakers - Foreign-born 20.6% of residents of Coconut Creek speak English at home.
42.6% of residents speak Spanish at home 5,117 58.4% Speak English very well3,642 41.6% Speak English less than very well36.6% of residents speak other language at home 4,046 53.9% Speak English very well3,466 46.1% Speak English less than very well
White (Caucasian) - Speak only English Native:
90.8% (20,003)Foreign-born:
21.4% (988)
White (Caucasian) - Speak another language Native:
10.7% (2,358)Foreign-born:
79.1% (3,645)
Black or African American - Speak only English Native:
81.2% (3,244)Foreign-born:
57.1% (2,040)
Black or African American - Speak another language Native:
18.4% (734)Foreign-born:
42.1% (1,503)
American Indian / Alaska Native - Speak only English Native:
81.7% (106)Foreign-born:
38.9% (47)
American Indian / Alaska Native - Speak another language Native:
15.6% (20)Foreign-born:
63.7% (77)
Asian - Speak only English Native:
37.7% (133)Foreign-born:
21.8% (290)
Asian - Speak another language Native:
64.9% (229)Foreign-born:
78.1% (1,038)
Other race - Speak only English Native:
40.6% (709)Foreign-born:
22.7% (494)
Other race - Speak another language Native:
59.6% (1,042)Foreign-born:
77.6% (1,685)
Two or more races - Speak only English Native:
50.5% (2,230)Foreign-born:
4.1% (384)
Two or more races - Speak another language Native:
49.4% (2,182)Foreign-born:
96.5% (9,045)
White alone - Speak only English Native:
92.4% (19,348)Foreign-born:
25.3% (1,070)
White alone - Speak another language Native:
7.5% (1,578)Foreign-born:
74.3% (3,143)
Hispanic or Latino - Speak only English Native:
40.5% (2,532)Foreign-born:
4.2% (370)
Hispanic or Latino - Speak another language Native:
59.7% (3,733)Foreign-born:
95.8% (8,440)
Foreign-born residents in Coconut Creek 20,650 residents are foreign born (27.1% Latin America ).
This city:
35.8%Florida:
21.1%
Marital status for residents in Coconut Creek Marital status - White (Caucasian) population 15 years and over
Males 36.3% Never married48.1% Now married0.5% Separated4.4% Widowed10.7% DivorcedFemales 23.6% Never married40.0% Now married1.9% Separated14.7% Widowed19.8% DivorcedWomen who gave birth in the past 12 months Now married:
70.4% (145)Unmarried:
29.6% (61)
Women who did not give birth in the past 12 months Now married:
41.8% (2,167)Unmarried:
58.2% (3,022)
Marital status - Black or African American population 15 years and over
Males 43.2% Never married42.0% Now married2.3% Separated4.9% Widowed7.5% DivorcedFemales 35.6% Never married35.2% Now married3.2% Separated3.4% Widowed22.6% DivorcedWomen who gave birth in the past 12 months Now married:
67.1% (92)Unmarried:
32.9% (45)
Women who did not give birth in the past 12 months Now married:
30.2% (599)Unmarried:
69.8% (1,386)
Marital status - American Indian / Alaska Native population 15 years and over
Males 66.7% Never married33.3% Now married0.0% Separated0.0% Widowed0.0% DivorcedFemales 8.0% Never married35.2% Now married0.0% Separated0.0% Widowed56.8% DivorcedWomen who did not give birth in the past 12 months Now married:
81.6% (51)Unmarried:
18.4% (11)
Marital status - Asian population 15 years and over
Males 23.4% Never married59.1% Now married0.0% Separated0.0% Widowed17.5% DivorcedFemales 39.5% Never married35.9% Now married0.0% Separated9.8% Widowed14.8% DivorcedWomen who gave birth in the past 12 months Now married:
100.0% (19)Unmarried:
0.0% (0)
Women who did not give birth in the past 12 months Now married:
35.4% (200)Unmarried:
64.6% (365)
Marital status - Other race population 15 years and over
Males 22.2% Never married62.3% Now married9.2% Separated0.0% Widowed6.3% DivorcedFemales 33.0% Never married39.2% Now married3.4% Separated11.6% Widowed12.8% DivorcedWomen who gave birth in the past 12 months Now married:
0.0% (0)Unmarried:
100.0% (64)
Women who did not give birth in the past 12 months Now married:
53.1% (490)Unmarried:
46.9% (433)
Marital status - Two or more races population 15 years and over
Males 36.8% Never married54.3% Now married0.4% Separated1.3% Widowed7.1% DivorcedFemales 31.1% Never married48.2% Now married1.4% Separated4.6% Widowed14.7% DivorcedWomen who gave birth in the past 12 months Now married:
100.0% (98)Unmarried:
0.0% (0)
Women who did not give birth in the past 12 months Now married:
42.6% (1,636)Unmarried:
57.4% (2,203)
Marital status - White alone, not Hispanic / Latino population 15 years and over
Males 37.2% Never married45.4% Now married0.7% Separated5.1% Widowed11.6% DivorcedFemales 22.8% Never married38.5% Now married1.9% Separated17.3% Widowed19.4% DivorcedWomen who gave birth in the past 12 months Now married:
67.2% (150)Unmarried:
32.8% (73)
Women who did not give birth in the past 12 months Now married:
40.5% (1,793)Unmarried:
59.5% (2,630)
Marital status - Hispanic or Latino population 15 years and over
Males 32.6% Never married57.0% Now married1.8% Separated0.8% Widowed7.8% DivorcedFemales 30.1% Never married44.3% Now married1.4% Separated6.4% Widowed17.7% DivorcedWomen who gave birth in the past 12 months Now married:
71.9% (94)Unmarried:
28.1% (37)
Women who did not give birth in the past 12 months Now married:
42.1% (1,791)Unmarried:
57.9% (2,462)
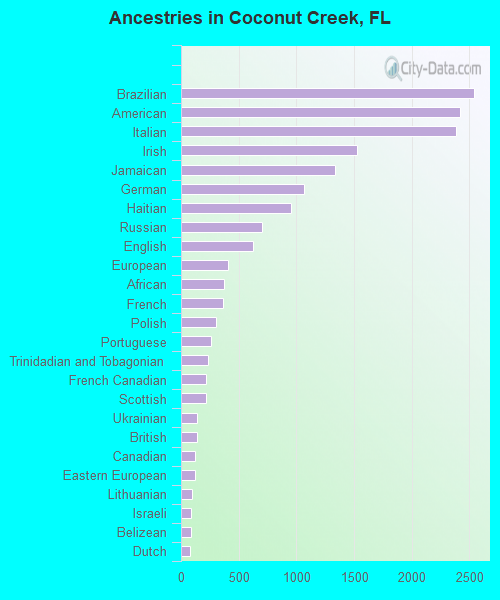
Ancestries in Coconut Creek
2,542 8.0% Brazilian2,421 7.6% American2,380 7.5% Italian1,526 4.8% Irish1,335 4.2% Jamaican1,065 3.3% German951 3.0% Haitian705 2.2% Russian623 2.0% English404 1.3% European374 1.2% African363 1.1% French305 1.0% Polish256 0.8% Portuguese236 0.7% Trinidadian and Tobagonian218 0.7% French Canadian215 0.7% Scottish142 0.4% Ukrainian138 0.4% British119 0.4% Canadian118 0.4% Eastern European97 0.3% Lithuanian90 0.3% Israeli87 0.3% Belizean80 0.3% Dutch70 0.2% Guyanese69 0.2% Palestinian66 0.2% Hungarian61 0.2% Moroccan57 0.2% West Indian54 0.2% Swedish52 0.2% Greek49 0.2% Syrian49 0.2% Northern European35 0.1% Belgian35 0.1% Norwegian35 0.1% Armenian30 0.09% Barbadian29 0.09% Slavic26 0.08% Turkish24 0.08% Scotch-Irish23 0.07% Czech22 0.07% U.S. Virgin Islander15 0.05% Austrian14 0.04% Scandinavian12 0.04% Nigerian12 0.04% South African10 0.03% Danish9 0.03% Arab9 0.03% Bulgarian9 0.03% Lebanese8 0.03% Romanian7 0.02% Welsh5 0.02% British West Indian4 0.01% Bahamian
Geographical mobility in Coconut Creek Same house 1 year ago 24,304 89.1% White (Caucasian)7,234 87.6% Black or African American321 94.9% American Indian / Alaska Native1,512 87.0% Asian18 100.0% Native Hawaiian / Pacific Islander3,537 85.5% Other race11,632 82.1% Two or more races22,933 88.0% White alone, not Hispanic / Latino13,919 88.5% Hispanic or LatinoMoved within same county 1,650 6.0% White / Caucasian579 7.0% Black or African American103 5.9% Asian280 6.8% Other race1,154 8.1% Two or more races1,626 6.2% White alone, not Hispanic / Latino1,045 6.6% Hispanic or LatinoMoved within same state 468 1.7% White / Caucasian247 3.0% Black or African American24 7.0% American Indian / Alaska Native18 1.1% Asian195 4.7% Other race364 2.6% Two or more races519 2.0% White alone, not Hispanic / Latino318 2.0% Hispanic or LatinoMoved from different state 417 1.5% White / Caucasian103 1.3% Black or African American101 5.8% Asian88 2.1% Other race499 3.5% Two or more races435 1.7% White alone, not Hispanic / Latino180 1.1% Hispanic or LatinoMoved from abroad 395 1.4% White101 1.2% Black or African American51 1.2% Other race575 4.1% Two or more races528 2.0% White alone, not Hispanic / Latino290 1.8% Hispanic or Latino
Children Nativity (place of birth) in Coconut Creek
Children under 6 years - Living with two parents Both parents native 895 98.8% Native11 1.2% Foreign-bornBoth parents foreign-born 765 96.4% Native28 3.6% Foreign-bornOne native, one foreign-born parent 615 95.4% Native29 4.6% Foreign-bornChildren under 6 years - Living with one parent Native parent 780 100.0% Native0 0.0% Foreign-bornForeign-born parent 425 97.9% Native9 2.1% Foreign-bornChildren 6 to 17 years - Living with two parents Both parents native 1,328 99.5% Native7 0.5% Foreign-bornBoth parents foreign-born 1,593 57.3% Native1,186 42.7% Foreign-bornOne native, one foreign-born parent 1,050 93.6% Native72 6.4% Foreign-bornChildren 6 to 17 years - Living with one parent Native parent 1,031 100.0% NativeForeign-born parent 1,099 58.4% Native783 41.6% Foreign-born
Place of birth for residents in Coconut Creek 16,985 Americas16,611 Latin America10,003 South America5,437 Caribbean1,709 Europe1,688 Asia1,170 Central America820 Eastern Europe562 South Central Asia438 Southern Europe390 Western Asia379 South Eastern Asia374 Northern America293 Eastern Asia255 Northern Europe248 Africa195 Western Europe178 China95 Western Africa48 Eastern Africa45 Northern Africa18 Oceania18 Australia and New Zealand Subregion4 Southern Africa3,623 Brazil2,311 Colombia2,105 Jamaica1,857 Peru1,067 Haiti887 Ecuador802 Cuba735 Dominican Republic610 Venezuela531 Trinidad and Tobago445 India374 Canada361 Argentina294 Mexico277 Italy261 Russia231 Belize226 Vietnam215 Panama182 Guyana157 Poland154 China152 Ukraine141 Israel125 Chile122 United Kingdom115 Guatemala114 Korea108 Nicaragua95 El Salvador93 France78 Costa Rica77 Thailand73 Lebanon71 Kuwait70 Bulgaria66 Lithuania66 Scotland63 Portugal61 Nigeria57 Iraq53 Philippines51 Nepal51 Greece49 Germany48 England45 Spain43 Iran39 Barbados37 Bosnia and Herzegovina36 Algeria34 Senegal31 Switzerland31 Uruguay29 Honduras26 Syria26 Tanzania24 Hong Kong20 Czechoslovakia20 Netherlands20 Turkey19 Bahamas18 New Zealand15 Ethiopia14 North Macedonia (Macedonia)12 Uzbekistan11 Hungary11 Indonesia11 Bolivia10 Denmark10 Malaysia9 Sri Lanka8 Romania6 St. Lucia6 Ireland4 South Africa
Grandparents responsible for own grandchildren in Coconut Creek
Grandparents (30 to 59 years) White / Caucasian 10 21.2% Responsible for grandchildren38 78.8% Not responsible for grandchildrenBlack or African American 22 49.7% Responsible for grandchildren22 50.3% Not responsible for grandchildrenOther race 20 100.0% Not responsible for grandchildrenTwo or more races 175 43.8% Responsible for grandchildren224 56.2% Not responsible for grandchildrenWhite alone, not Hispanic / Latino 13 32.2% Responsible for grandchildren27 67.8% Not responsible for grandchildrenHispanic or Latino 155 52.1% Responsible for grandchildren143 47.9% Not responsible for grandchildrenGrandparents (60 years and over) White / Caucasian 197 50.9% Responsible for grandchildren190 49.1% Not responsible for grandchildrenBlack or African American 29 27.8% Responsible for grandchildren76 72.2% Not responsible for grandchildrenOther race 1 6.5% Responsible for grandchildren21 93.5% Not responsible for grandchildrenTwo or more races 84 100.0% Not responsible for grandchildrenWhite alone, not Hispanic / Latino 205 51.8% Responsible for grandchildren191 48.2% Not responsible for grandchildrenHispanic or Latino 23 14.0% Responsible for grandchildren141 86.0% Not responsible for grandchildren