Races in Closter, New Jersey (NJ) Detailed Stats
Data:
Races - White alone (%)
Races - White alone (% change since 2000)
Races - Black alone (%)
Races - Black alone (% change since 2000)
Races - American Indian alone (%)
Races - American Indian alone (% change since 2000)
Races - Asian alone (%)
Races - Asian alone (% change since 2000)
Races - Hispanic (%)
Races - Hispanic (% change since 2000)
Races - Native Hawaiian and Other Pacific Islander alone (%)
Races - Native Hawaiian and Other Pacific Islander alone (% change since 2000)
Races - Two or more races(%)
Races - Two or more races(% change since 2000)
Races - Other race alone (%)
Races - Other race alone (% change since 2000)
Racial diversity
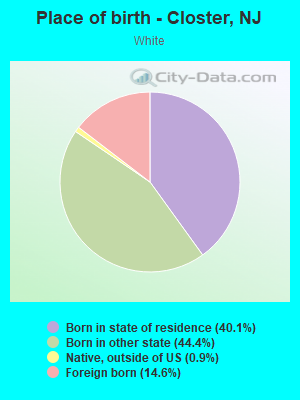
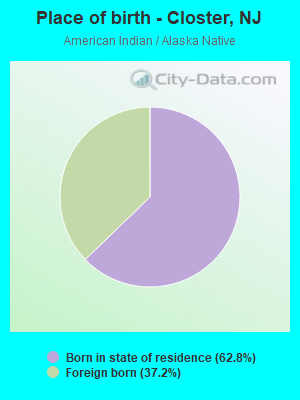
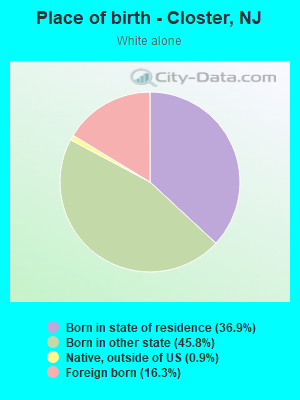
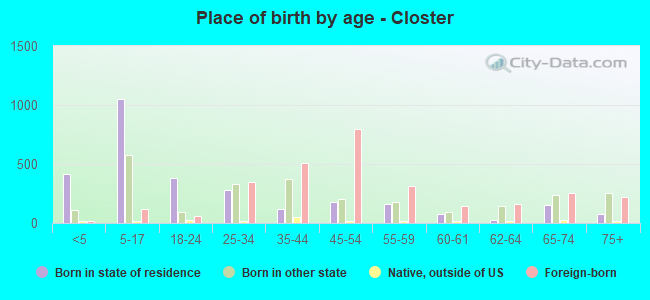
Place of birth - Born in state of residence (%)
Place of birth - Born in state of residence (%) - White
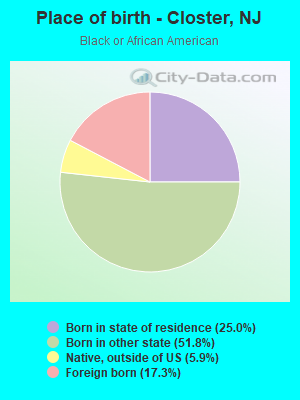
Place of birth - Born in state of residence (%) - Black or African American
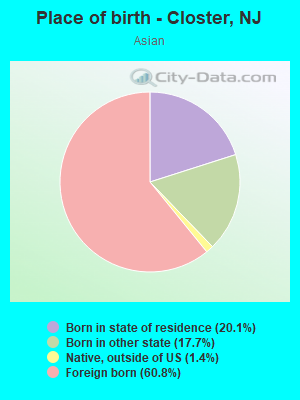
Place of birth - Born in state of residence (%) - Asian
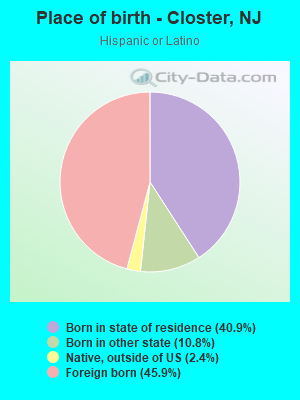
Place of birth - Born in state of residence (%) - Hispanic or Latino
Place of birth - Born in state of residence (%) - American Indian and Alaska Native
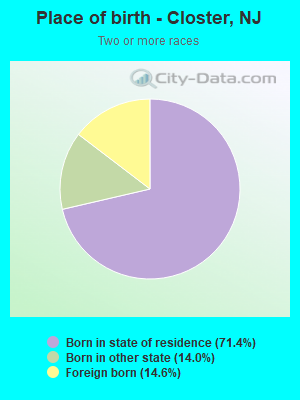
Place of birth - Born in state of residence (%) - Multirace
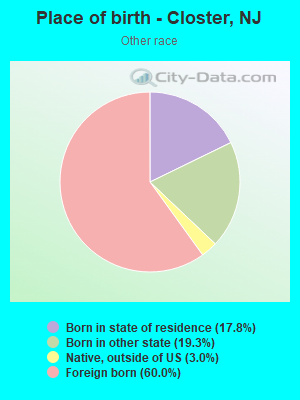
Place of birth - Born in state of residence (%) - Other Race
Place of birth - Born in other state (%)
Place of birth - Born in other state (%) - White
Place of birth - Born in other state (%) - Black or African American
Place of birth - Born in other state (%) - Asian
Place of birth - Born in other state (%) - Hispanic or Latino
Place of birth - Born in other state (%) - American Indian and Alaska Native
Place of birth - Born in other state (%) - Multirace
Place of birth - Born in other state (%) - Other Race
Place of birth - Native, outside of US (%)
Place of birth - Native, outside of US (%) - White
Place of birth - Native, outside of US (%) - Black or African American
Place of birth - Native, outside of US (%) - Asian
Place of birth - Native, outside of US (%) - Hispanic or Latino
Place of birth - Native, outside of US (%) - American Indian and Alaska Native
Place of birth - Native, outside of US (%) - Multirace
Place of birth - Native, outside of US (%) - Other Race
Place of birth - Foreign born (%)
Place of birth - Foreign born (%) - White
Place of birth - Foreign born (%) - Black or African American
Place of birth - Foreign born (%) - Asian
Place of birth - Foreign born (%) - Hispanic or Latino
Place of birth - Foreign born (%) - American Indian and Alaska Native
Place of birth - Foreign born (%) - Multirace
Place of birth - Foreign born (%) - Other Race
Residents speaking English at home (%)
Residents speaking English at home - Born in the United States (%)
Residents speaking English at home - Native, born elsewhere (%)
Residents speaking English at home - Foreign born (%)
Residents speaking Spanish at home (%)
Residents speaking Spanish at home - Born in the United States (%)
Residents speaking Spanish at home - Native, born elsewhere (%)
Residents speaking Spanish at home - Foreign born (%)
Residents speaking other language at home (%)
Residents speaking other language at home - Born in the United States (%)
Residents speaking other language at home - Native, born elsewhere (%)
Residents speaking other language at home - Foreign born (%)
Marital status - Never married (%)
Marital status - Now married (%)
Marital status - Separated (%)
Marital status - Widowed (%)
Marital status - Divorced (%)
Ancestries Reported - Arab (%)
Ancestries Reported - Czech (%)
Ancestries Reported - Danish (%)
Ancestries Reported - Dutch (%)
Ancestries Reported - English (%)
Ancestries Reported - French (%)
Ancestries Reported - French Canadian (%)
Ancestries Reported - German (%)
Ancestries Reported - Greek (%)
Ancestries Reported - Hungarian (%)
Ancestries Reported - Irish (%)
Ancestries Reported - Italian (%)
Ancestries Reported - Lithuanian (%)
Ancestries Reported - Norwegian (%)
Ancestries Reported - Polish (%)
Ancestries Reported - Portuguese (%)
Ancestries Reported - Russian (%)
Ancestries Reported - Scotch-Irish (%)
Ancestries Reported - Scottish (%)
Ancestries Reported - Slovak (%)
Ancestries Reported - Subsaharan African (%)
Ancestries Reported - Swedish (%)
Ancestries Reported - Swiss (%)
Ancestries Reported - Ukrainian (%)
Ancestries Reported - United States (%)
Ancestries Reported - Welsh (%)
Ancestries Reported - West Indian (%)
Ancestries Reported - Other (%)
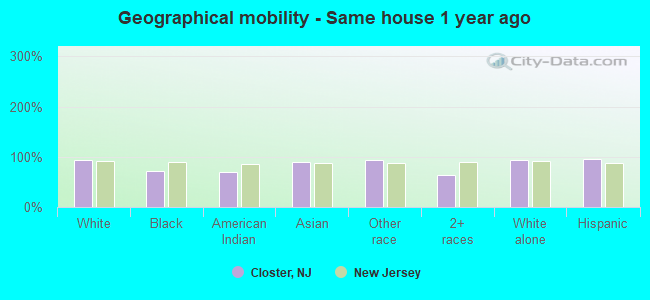
Geographical mobility - Same house 1 year ago (%)
Geographical mobility - Same house 1 year ago (%) - White
Geographical mobility - Same house 1 year ago (%) - Black or African American
Geographical mobility - Same house 1 year ago (%) - Asian
Geographical mobility - Same house 1 year ago (%) - Hispanic or Latino
Geographical mobility - Same house 1 year ago (%) - American Indian and Alaska Native
Geographical mobility - Same house 1 year ago (%) - Multirace
Geographical mobility - Same house 1 year ago (%) - Other Race
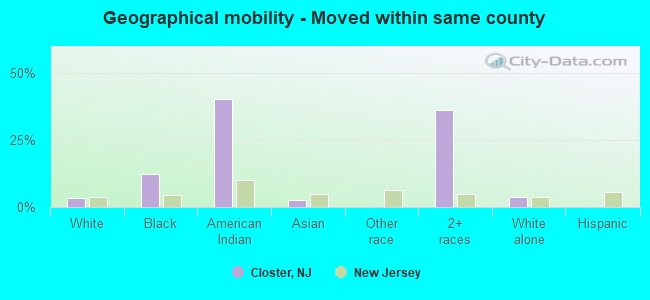
Geographical mobility - Moved within same county (%)
Geographical mobility - Moved within same county (%) - White
Geographical mobility - Moved within same county (%) - Black or African American
Geographical mobility - Moved within same county (%) - Asian
Geographical mobility - Moved within same county (%) - Hispanic or Latino
Geographical mobility - Moved within same county (%) - American Indian and Alaska Native
Geographical mobility - Moved within same county (%) - Multirace
Geographical mobility - Moved within same county (%) - Other Race
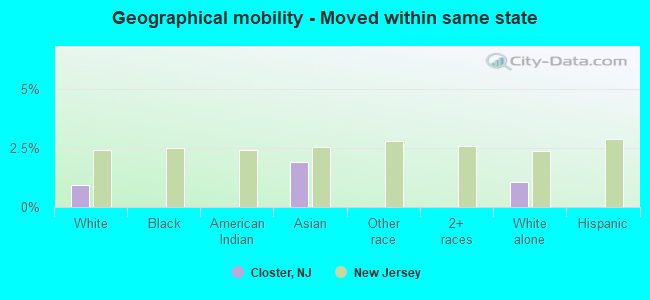
Geographical mobility - Moved from different county within same state (%)
Geographical mobility - Moved from different county within same state (%) - White
Geographical mobility - Moved from different county within same state (%) - Black or African American
Geographical mobility - Moved from different county within same state (%) - Asian
Geographical mobility - Moved from different county within same state (%) - Hispanic or Latino
Geographical mobility - Moved from different county within same state (%) - American Indian and Alaska Native
Geographical mobility - Moved from different county within same state (%) - Multirace
Geographical mobility - Moved from different county within same state (%) - Other Race
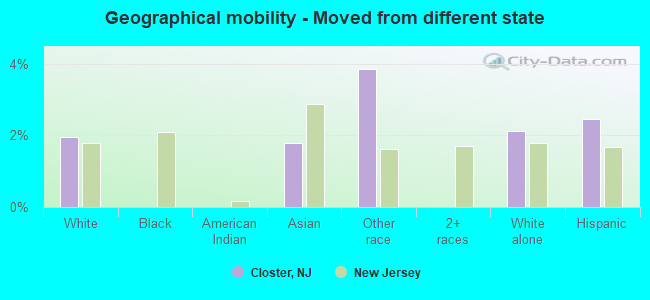
Geographical mobility - Moved from different state (%)
Geographical mobility - Moved from different state (%) - White
Geographical mobility - Moved from different state (%) - Black or African American
Geographical mobility - Moved from different state (%) - Asian
Geographical mobility - Moved from different state (%) - Hispanic or Latino
Geographical mobility - Moved from different state (%) - American Indian and Alaska Native
Geographical mobility - Moved from different state (%) - Multirace
Geographical mobility - Moved from different state (%) - Other Race
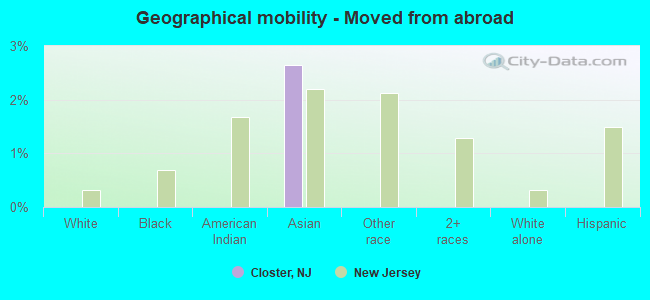
Geographical mobility - Moved from abroad (%)
Geographical mobility - Moved from abroad (%) - White
Geographical mobility - Moved from abroad (%) - Black or African American
Geographical mobility - Moved from abroad (%) - Asian
Geographical mobility - Moved from abroad (%) - Hispanic or Latino
Geographical mobility - Moved from abroad (%) - American Indian and Alaska Native
Geographical mobility - Moved from abroad (%) - Multirace
Geographical mobility - Moved from abroad (%) - Other Race
Place of birth for the foreign-born population - Ireland (%)
Place of birth for the foreign-born population - Denmark (%)
Place of birth for the foreign-born population - Norway (%)
Place of birth for the foreign-born population - Sweden (%)
Place of birth for the foreign-born population - United Kingdom (%)
Place of birth for the foreign-born population - England (%)
Place of birth for the foreign-born population - Scotland (%)
Place of birth for the foreign-born population - Other Northern Europe (%)
Place of birth for the foreign-born population - Austria (%)
Place of birth for the foreign-born population - Belgium (%)
Place of birth for the foreign-born population - France (%)
Place of birth for the foreign-born population - Germany (%)
Place of birth for the foreign-born population - Netherlands (%)
Place of birth for the foreign-born population - Switzerland (%)
Place of birth for the foreign-born population - Other Western Europe (%)
Place of birth for the foreign-born population - Greece (%)
Place of birth for the foreign-born population - Italy (%)
Place of birth for the foreign-born population - Portugal (%)
Place of birth for the foreign-born population - Spain (%)
Place of birth for the foreign-born population - Other Southern Europe (%)
Place of birth for the foreign-born population - Albania (%)
Place of birth for the foreign-born population - Belarus (%)
Place of birth for the foreign-born population - Bosnia and Herzegovina (%)
Place of birth for the foreign-born population - Bulgaria (%)
Place of birth for the foreign-born population - Croatia (%)
Place of birth for the foreign-born population - Czechoslovakia (%)
Place of birth for the foreign-born population - Hungary (%)
Place of birth for the foreign-born population - Latvia (%)
Place of birth for the foreign-born population - Lithuania (%)
Place of birth for the foreign-born population - North Macedonia (Macedonia) (%)
Place of birth for the foreign-born population - Moldova (%)
Place of birth for the foreign-born population - Poland (%)
Place of birth for the foreign-born population - Romania (%)
Place of birth for the foreign-born population - Russia (%)
Place of birth for the foreign-born population - Serbia (%)
Place of birth for the foreign-born population - Ukraine (%)
Place of birth for the foreign-born population - Other Eastern Europe (%)
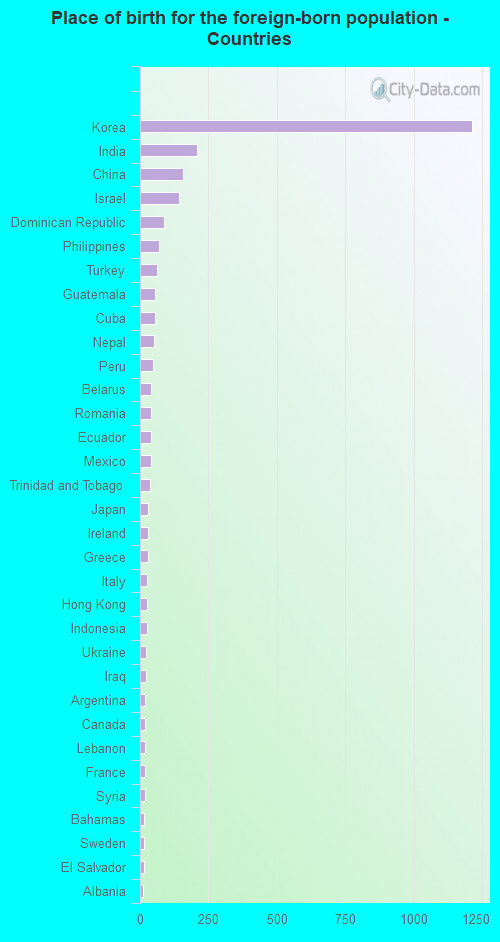
Place of birth for the foreign-born population - China (%)
Place of birth for the foreign-born population - Hong Kong (%)
Place of birth for the foreign-born population - Taiwan (%)
Place of birth for the foreign-born population - Japan (%)
Place of birth for the foreign-born population - Korea (%)
Place of birth for the foreign-born population - Other Eastern Asia (%)
Place of birth for the foreign-born population - Afghanistan (%)
Place of birth for the foreign-born population - Bangladesh (%)
Place of birth for the foreign-born population - India (%)
Place of birth for the foreign-born population - Iran (%)
Place of birth for the foreign-born population - Kazakhstan (%)
Place of birth for the foreign-born population - Nepal (%)
Place of birth for the foreign-born population - Pakistan (%)
Place of birth for the foreign-born population - Sri Lanka (%)
Place of birth for the foreign-born population - Uzbekistan (%)
Place of birth for the foreign-born population - Other South Central Asia (%)
Place of birth for the foreign-born population - Burma (%)
Place of birth for the foreign-born population - Cambodia (%)
Place of birth for the foreign-born population - Indonesia (%)
Place of birth for the foreign-born population - Laos (%)
Place of birth for the foreign-born population - Malaysia (%)
Place of birth for the foreign-born population - Philippines (%)
Place of birth for the foreign-born population - Singapore (%)
Place of birth for the foreign-born population - Thailand (%)
Place of birth for the foreign-born population - Vietnam (%)
Place of birth for the foreign-born population - Other South Eastern Asia (%)
Place of birth for the foreign-born population - Armenia (%)
Place of birth for the foreign-born population - Iraq (%)
Place of birth for the foreign-born population - Israel (%)
Place of birth for the foreign-born population - Jordan (%)
Place of birth for the foreign-born population - Kuwait (%)
Place of birth for the foreign-born population - Lebanon (%)
Place of birth for the foreign-born population - Saudi Arabia (%)
Place of birth for the foreign-born population - Syria (%)
Place of birth for the foreign-born population - Turkey (%)
Place of birth for the foreign-born population - Yemen (%)
Place of birth for the foreign-born population - Other Western Asia (%)
Place of birth for the foreign-born population - Eritrea (%)
Place of birth for the foreign-born population - Ethiopia (%)
Place of birth for the foreign-born population - Kenya (%)
Place of birth for the foreign-born population - Somalia (%)
Place of birth for the foreign-born population - Uganda (%)
Place of birth for the foreign-born population - Zimbabwe (%)
Place of birth for the foreign-born population - Other Eastern Africa (%)
Place of birth for the foreign-born population - Cameroon (%)
Place of birth for the foreign-born population - Congo (%)
Place of birth for the foreign-born population - Democratic Republic of Congo (Zaire) (%)
Place of birth for the foreign-born population - Other Middle Africa (%)
Place of birth for the foreign-born population - Egypt (%)
Place of birth for the foreign-born population - Morocco (%)
Place of birth for the foreign-born population - Sudan (%)
Place of birth for the foreign-born population - Other Northern Africa (%)
Place of birth for the foreign-born population - South Africa (%)
Place of birth for the foreign-born population - Other Southern Africa (%)
Place of birth for the foreign-born population - Cabo Verde (%)
Place of birth for the foreign-born population - Ghana (%)
Place of birth for the foreign-born population - Liberia (%)
Place of birth for the foreign-born population - Nigeria (%)
Place of birth for the foreign-born population - Senegal (%)
Place of birth for the foreign-born population - Sierra Leone (%)
Place of birth for the foreign-born population - Other Western Africa (%)
Place of birth for the foreign-born population - Australia (%)
Place of birth for the foreign-born population - New Zealand (%)
Place of birth for the foreign-born population - Fiji (%)
Place of birth for the foreign-born population - Micronesia (%)
Place of birth for the foreign-born population - Bahamas (%)
Place of birth for the foreign-born population - Barbados (%)
Place of birth for the foreign-born population - Cuba (%)
Place of birth for the foreign-born population - Dominica (%)
Place of birth for the foreign-born population - Dominican Republic (%)
Place of birth for the foreign-born population - Grenada (%)
Place of birth for the foreign-born population - Haiti (%)
Place of birth for the foreign-born population - Jamaica (%)
Place of birth for the foreign-born population - St. Vincent and the Grenadines (%)
Place of birth for the foreign-born population - Trinidad and Tobago (%)
Place of birth for the foreign-born population - West Indies (%)
Place of birth for the foreign-born population - Other Caribbean (%)
Place of birth for the foreign-born population - Belize (%)
Place of birth for the foreign-born population - Costa Rica (%)
Place of birth for the foreign-born population - El Salvador (%)
Place of birth for the foreign-born population - Guatemala (%)
Place of birth for the foreign-born population - Honduras (%)
Place of birth for the foreign-born population - Mexico (%)
Place of birth for the foreign-born population - Nicaragua (%)
Place of birth for the foreign-born population - Panama (%)
Place of birth for the foreign-born population - Other Central America (%)
Place of birth for the foreign-born population - Argentina (%)
Place of birth for the foreign-born population - Bolivia (%)
Place of birth for the foreign-born population - Brazil (%)
Place of birth for the foreign-born population - Chile (%)
Place of birth for the foreign-born population - Colombia (%)
Place of birth for the foreign-born population - Ecuador (%)
Place of birth for the foreign-born population - Guyana (%)
Place of birth for the foreign-born population - Peru (%)
Place of birth for the foreign-born population - Uruguay (%)
Place of birth for the foreign-born population - Venezuela (%)
Place of birth for the foreign-born population - Other South America (%)
Place of birth for the foreign-born population - Canada (%)
Place of birth for the foreign-born population - Other Northern America (%)
Place of birth for the foreign-born population - Other (%)
Latest news about races in Closter, NJ collected exclusively by city-data.com from local newspapers, TV, and radio stations
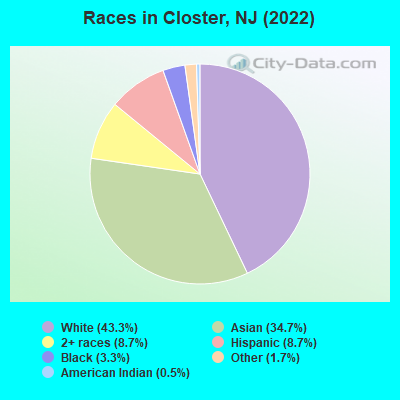
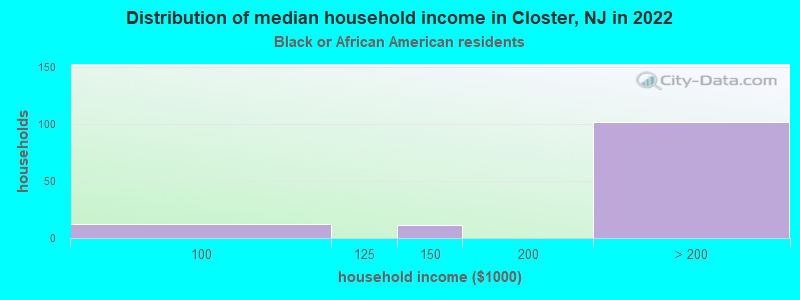
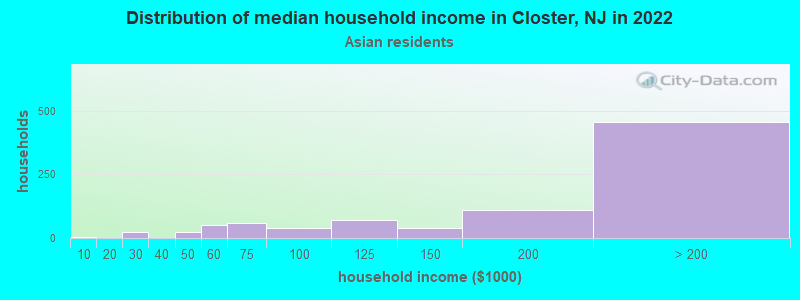
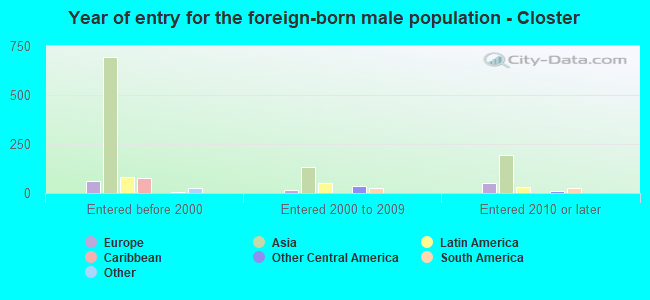
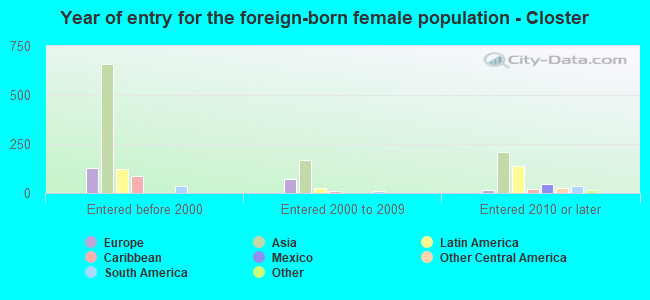
According to 2022 data, the most numerous races in Closter, NJ are White alone (3,700 residents), Hispanic (742 residents), and Black alone (283 residents). 55.8% of Closter residents speak English at home. 34.2% of Closter, NJ residents are foreign-born (23.5% born in Asia, 5.0% born in Latin America, 4.5% born in Europe), which is 32.8% greater than the foreign-born rate of 23.0% across the entire state of New Jersey.
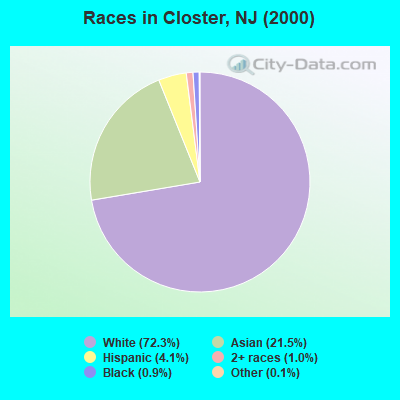
Race distribution in Closter
2000 2022
5,557,209 66.0% White alone 1,117,191 13.3% Hispanic 1,096,171 13.0% Black alone 477,012 5.7% Asian alone 133,689 1.6% Two or more races 19,565 0.2% Other race alone 11,338 0.1% American Indian alone 2,175 0.03% Native Hawaiian and Other
4,766,476 51.5% White alone 2,028,470 21.9% Hispanic 1,111,632 12.0% Black alone 923,546 10.0% Asian alone 332,237 3.6% Two or more races 89,847 1.0% Other race alone 8,557 0.09% American Indian alone 934 0.01% Native Hawaiian and Other
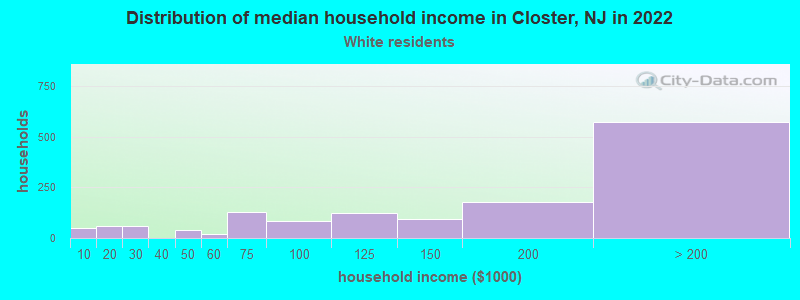
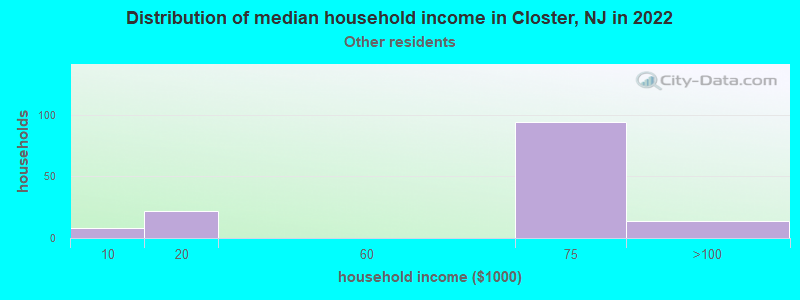
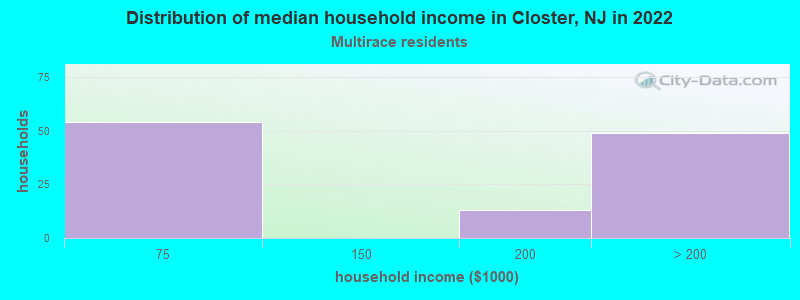
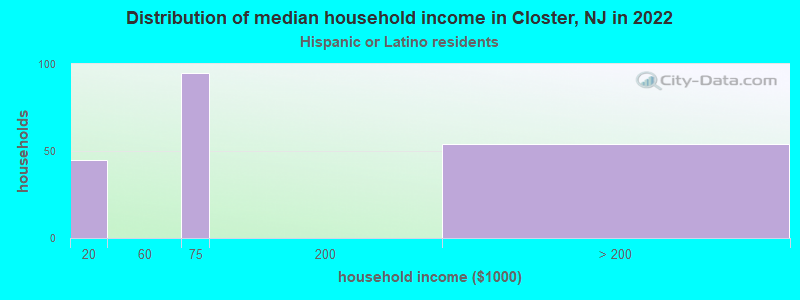
Income and house value in Closter Median household income in 2022 $155,080 White non-Hispanic householdersover $200,000 Black householders$186,427 Asian householders$70,370 Some other race householders$178,524 Two or more races householders$71,947 Hispanic or Latino race householdersMedian 2022 house value $819,883 White Non-Hispanic householdersover $1,000,000 Black or African American householders $632,032 Asian householdersover $1,000,000 Some other race householders$822,659 Two or more races householders$809,704 Hispanic or Latino householders
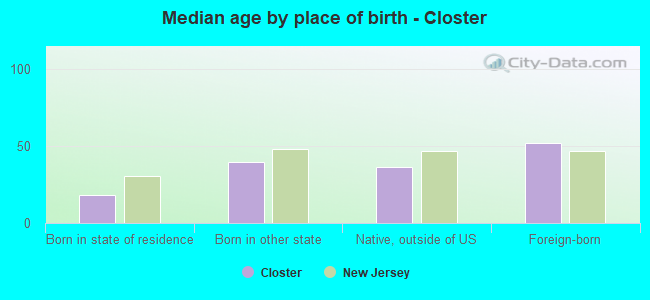
Median age by race in Closter
51.9 Median age for White residents47.2 54.9 32.5 Median age for Black or African American residents31.9 31.8 16.4 Median age for American Indian / Alaska Native residents-686,322,685.6 10.6 41.9 Median age for Asian residents41.5 42.4 -510,460,250.5 Median age for Native Hawaiian / Pacific Islander residents-514,767,932.0 -713,070,378.3 40.5 Median age for Other race residents26.1 49.0 9.8 Median age for Two or more races residents9.5 21.1 51.2 Median age for White alone residents48.4 54.2 34.4 Median age for Hispanic or Latino residents29.0 35.3
Owner/renter occupied households by race in Closter
House owners and renters - White residents 1,282 88.2% Owner occupied171 11.8% Renter occupiedHouse owners and renters - Black or African American residents 26 24.6% Owner occupied78 75.4% Renter occupiedHouse owners and renters - Asian residents 771 85.6% Owner occupied130 14.4% Renter occupiedHouse owners and renters - Other race residents 12 8.9% Owner occupied122 91.1% Renter occupiedHouse owners and renters - Two or more races residents 64 60.1% Owner occupied43 39.9% Renter occupiedHouse owners and renters - White alone residents 1,294 88.4% Owner occupied170 11.6% Renter occupiedHouse owners and renters - Hispanic or Latino residents 75 38.4% Owner occupied120 61.6% Renter occupied
Language usage in Closter
English speakers - Total 55.8% of residents of Closter speak English at home.
7.8% of residents speak Spanish at home 409 65.8% Speak English very well213 34.2% Speak English less than very well35.9% of residents speak other language at home 1,579 54.8% Speak English very well1,300 45.2% Speak English less than very well
English speakers - Born in the United States 76.1% of residents of Closter speak English at home.
4.6% of residents speak Spanish at home 21 18.6% Speak English very well92 81.4% Speak English less than very well18.8% of residents speak other language at home 400 86.4% Speak English very well63 13.6% Speak English less than very well
English speakers - Native, born elsewhere 40.3% of residents of Closter speak English at home.
15.1% of residents speak Spanish at home 8 44.4% Speak English very well10 55.6% Speak English less than very well40.3% of residents speak other language at home 24 50.0% Speak English very well24 50.0% Speak English less than very well
English speakers - Foreign-born 20.4% of residents of Closter speak English at home.
11.6% of residents speak Spanish at home 205 60.3% Speak English very well135 39.7% Speak English less than very well66.8% of residents speak other language at home 864 44.3% Speak English very well1,087 55.7% Speak English less than very well
White (Caucasian) - Speak only English Native:
88.5% (2,666)Foreign-born:
39.3% (211)
White (Caucasian) - Speak another language Native:
11.2% (336)Foreign-born:
64.8% (348)
Black or African American - Speak only English Native:
99.9% (237)Foreign-born:
76.1% (39)
American Indian / Alaska Native - Speak another language Native:
63.8% (37)Foreign-born:
100.0% (45)
Asian - Speak only English Native:
38.6% (356)Foreign-born:
16.4% (293)
Asian - Speak another language Native:
61.0% (562)Foreign-born:
83.4% (1,486)
Other race - Speak another language Native:
61.4% (110)Foreign-born:
100.0% (275)
Two or more races - Speak only English Native:
85.5% (589)Foreign-born:
35.9% (50)
Two or more races - Speak another language Native:
11.0% (76)Foreign-born:
60.1% (84)
White alone - Speak only English Native:
88.2% (2,606)Foreign-born:
31.3% (189)
White alone - Speak another language Native:
11.6% (343)Foreign-born:
68.4% (412)
Hispanic or Latino - Speak only English Native:
46.2% (174)Foreign-born:
11.0% (37)
Hispanic or Latino - Speak another language Native:
52.2% (197)Foreign-born:
89.3% (301)
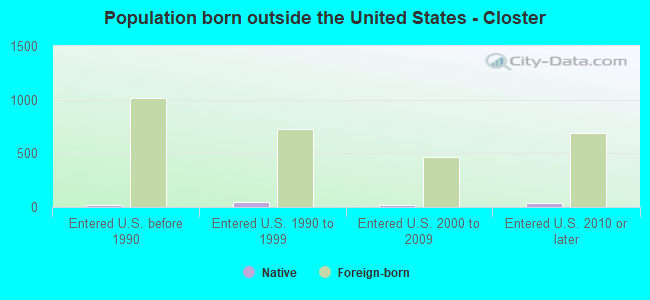
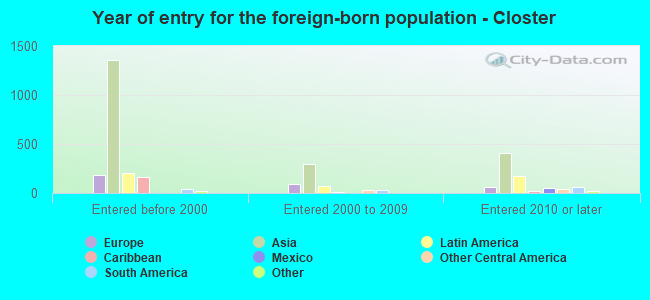
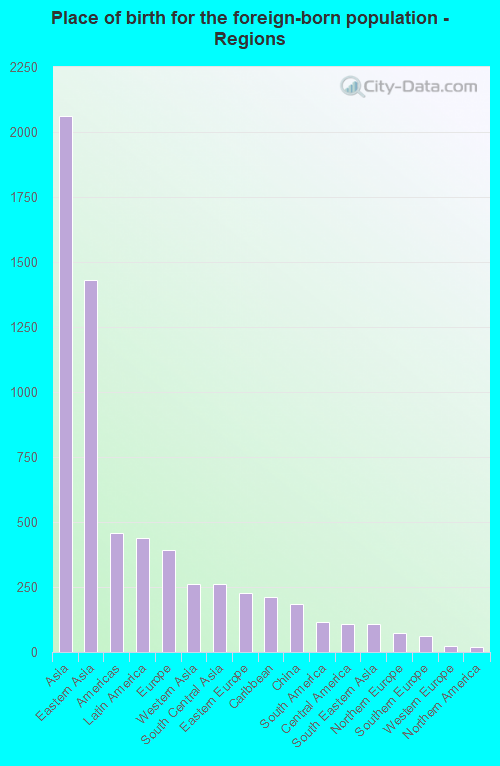
Foreign-born residents in Closter 2,929 residents are foreign born (23.5% Asia , 5.0% Latin America , 4.5% Europe ).
This city:
34.2%New Jersey:
23.2%
Marital status for residents in Closter Marital status - White (Caucasian) population 15 years and over
Males 27.7% Never married62.4% Now married0.0% Separated5.0% Widowed4.9% DivorcedFemales 25.8% Never married52.5% Now married0.9% Separated11.2% Widowed9.7% DivorcedWomen who gave birth in the past 12 months Now married:
85.4% (34)Unmarried:
14.6% (6)
Women who did not give birth in the past 12 months Now married:
36.7% (245)Unmarried:
63.3% (422)
Marital status - Black or African American population 15 years and over
Males 65.7% Never married34.3% Now married0.0% Separated0.0% Widowed0.0% DivorcedFemales 68.6% Never married11.9% Now married0.0% Separated0.0% Widowed19.5% DivorcedWomen who did not give birth in the past 12 months Now married:
0.0% (0)Unmarried:
100.0% (131)
Marital status - American Indian / Alaska Native population 15 years and over
Males 100.0% Never married0.0% Now married0.0% Separated0.0% Widowed0.0% DivorcedFemales 100.0% Never married0.0% Now married0.0% Separated0.0% Widowed0.0% DivorcedWomen who did not give birth in the past 12 months Now married:
0.0% (0)Unmarried:
100.0% (23)
Marital status - Asian population 15 years and over
Males 20.0% Never married76.8% Now married0.0% Separated0.0% Widowed3.3% DivorcedFemales 16.2% Never married77.3% Now married1.3% Separated4.1% Widowed1.1% DivorcedWomen who gave birth in the past 12 months Now married:
100.0% (24)Unmarried:
0.0% (0)
Women who did not give birth in the past 12 months Now married:
73.5% (479)Unmarried:
26.5% (173)
Marital status - Other race population 15 years and over
Males 61.7% Never married34.8% Now married0.0% Separated0.0% Widowed3.5% DivorcedFemales 25.8% Never married53.1% Now married5.5% Separated0.0% Widowed15.6% DivorcedWomen who did not give birth in the past 12 months Now married:
57.1% (78)Unmarried:
42.9% (58)
Marital status - Two or more races population 15 years and over
Males 100.0% Never married0.0% Now married0.0% Separated0.0% Widowed0.0% DivorcedFemales 53.0% Never married34.8% Now married0.0% Separated0.0% Widowed12.1% DivorcedWomen who did not give birth in the past 12 months Now married:
22.2% (29)Unmarried:
77.8% (102)
Marital status - White alone, not Hispanic / Latino population 15 years and over
Males 25.6% Never married63.5% Now married0.0% Separated5.5% Widowed5.3% DivorcedFemales 25.6% Never married51.4% Now married0.9% Separated12.1% Widowed10.0% DivorcedWomen who gave birth in the past 12 months Now married:
85.4% (39)Unmarried:
14.6% (7)
Women who did not give birth in the past 12 months Now married:
34.1% (232)Unmarried:
65.9% (450)
Marital status - Hispanic or Latino population 15 years and over
Males 55.9% Never married44.1% Now married0.0% Separated0.0% Widowed0.0% DivorcedFemales 27.1% Never married60.2% Now married2.5% Separated0.0% Widowed10.2% DivorcedWomen who did not give birth in the past 12 months Now married:
53.3% (92)Unmarried:
46.7% (81)
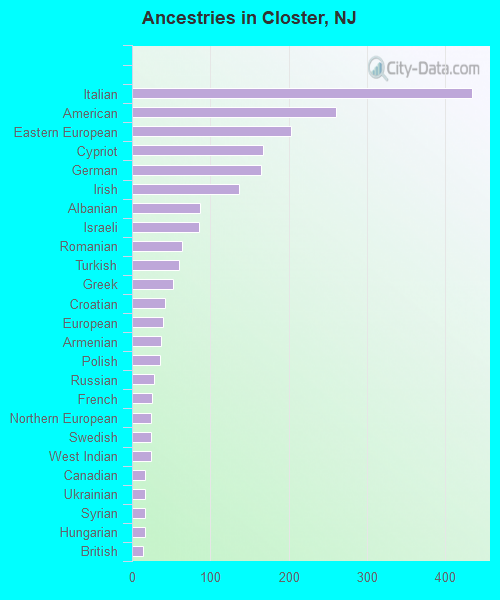
Ancestries in Closter
434 8.4% Italian261 5.0% American203 3.9% Eastern European167 3.2% Cypriot165 3.2% German137 2.6% Irish87 1.7% Albanian85 1.6% Israeli64 1.2% Romanian60 1.2% Turkish52 1.0% Greek42 0.8% Croatian39 0.8% European37 0.7% Armenian36 0.7% Polish28 0.5% Russian26 0.5% French24 0.5% Northern European24 0.5% Swedish24 0.5% West Indian17 0.3% Canadian17 0.3% Ukrainian16 0.3% Syrian16 0.3% Hungarian14 0.3% British12 0.2% Haitian8 0.2% Austrian7 0.1% Egyptian6 0.1% Lithuanian6 0.1% Scotch-Irish5 0.10% Czechoslovakian5 0.10% Scottish3 0.06% Norwegian
Children Nativity (place of birth) in Closter
Children under 6 years - Living with two parents Both parents native 162 100.0% NativeBoth parents foreign-born 239 100.0% NativeOne native, one foreign-born parent 137 100.0% NativeChildren under 6 years - Living with one parent Foreign-born parent 39 100.0% NativeChildren 6 to 17 years - Living with two parents Both parents native 197 97.2% Native6 2.8% Foreign-bornBoth parents foreign-born 533 88.0% Native73 12.0% Foreign-bornOne native, one foreign-born parent 233 100.0% NativeChildren 6 to 17 years - Living with one parent Native parent 432 100.0% NativeForeign-born parent 137 57.3% Native102 42.7% Foreign-born