Races in Clinton, Maryland (MD) Detailed Stats
Data:
Races - White alone (%)
Races - White alone (% change since 2000)
Races - Black alone (%)
Races - Black alone (% change since 2000)
Races - American Indian alone (%)
Races - American Indian alone (% change since 2000)
Races - Asian alone (%)
Races - Asian alone (% change since 2000)
Races - Hispanic (%)
Races - Hispanic (% change since 2000)
Races - Native Hawaiian and Other Pacific Islander alone (%)
Races - Native Hawaiian and Other Pacific Islander alone (% change since 2000)
Races - Two or more races(%)
Races - Two or more races(% change since 2000)
Races - Other race alone (%)
Races - Other race alone (% change since 2000)
Racial diversity
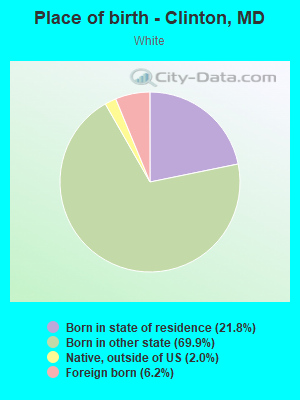
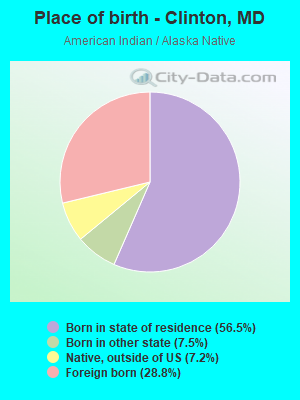
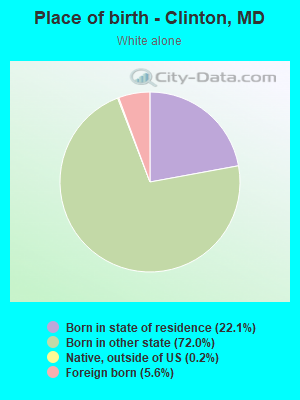
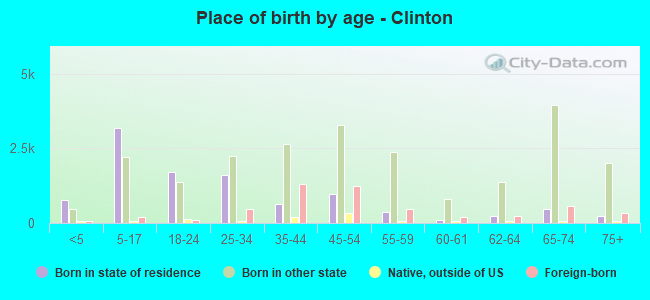
Place of birth - Born in state of residence (%)
Place of birth - Born in state of residence (%) - White
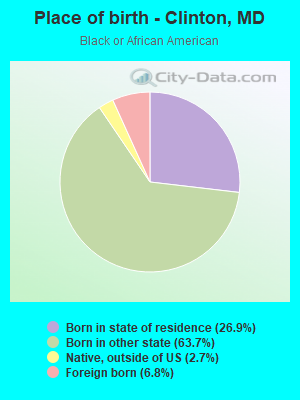
Place of birth - Born in state of residence (%) - Black or African American
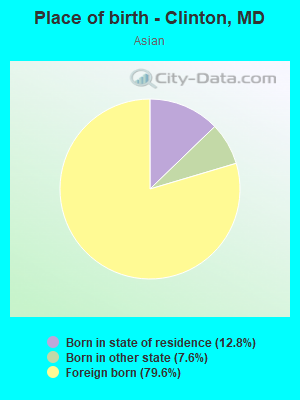
Place of birth - Born in state of residence (%) - Asian
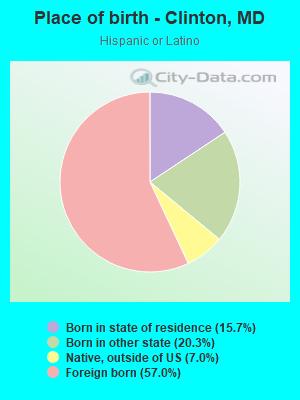
Place of birth - Born in state of residence (%) - Hispanic or Latino
Place of birth - Born in state of residence (%) - American Indian and Alaska Native
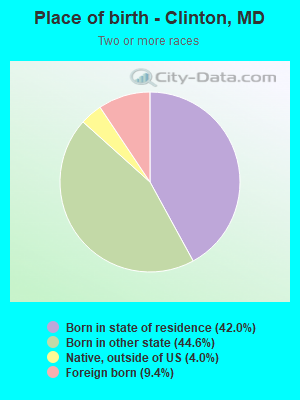
Place of birth - Born in state of residence (%) - Multirace
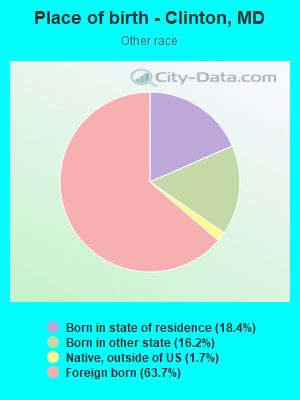
Place of birth - Born in state of residence (%) - Other Race
Place of birth - Born in other state (%)
Place of birth - Born in other state (%) - White
Place of birth - Born in other state (%) - Black or African American
Place of birth - Born in other state (%) - Asian
Place of birth - Born in other state (%) - Hispanic or Latino
Place of birth - Born in other state (%) - American Indian and Alaska Native
Place of birth - Born in other state (%) - Multirace
Place of birth - Born in other state (%) - Other Race
Place of birth - Native, outside of US (%)
Place of birth - Native, outside of US (%) - White
Place of birth - Native, outside of US (%) - Black or African American
Place of birth - Native, outside of US (%) - Asian
Place of birth - Native, outside of US (%) - Hispanic or Latino
Place of birth - Native, outside of US (%) - American Indian and Alaska Native
Place of birth - Native, outside of US (%) - Multirace
Place of birth - Native, outside of US (%) - Other Race
Place of birth - Foreign born (%)
Place of birth - Foreign born (%) - White
Place of birth - Foreign born (%) - Black or African American
Place of birth - Foreign born (%) - Asian
Place of birth - Foreign born (%) - Hispanic or Latino
Place of birth - Foreign born (%) - American Indian and Alaska Native
Place of birth - Foreign born (%) - Multirace
Place of birth - Foreign born (%) - Other Race
Residents speaking English at home (%)
Residents speaking English at home - Born in the United States (%)
Residents speaking English at home - Native, born elsewhere (%)
Residents speaking English at home - Foreign born (%)
Residents speaking Spanish at home (%)
Residents speaking Spanish at home - Born in the United States (%)
Residents speaking Spanish at home - Native, born elsewhere (%)
Residents speaking Spanish at home - Foreign born (%)
Residents speaking other language at home (%)
Residents speaking other language at home - Born in the United States (%)
Residents speaking other language at home - Native, born elsewhere (%)
Residents speaking other language at home - Foreign born (%)
Marital status - Never married (%)
Marital status - Now married (%)
Marital status - Separated (%)
Marital status - Widowed (%)
Marital status - Divorced (%)
Ancestries Reported - Arab (%)
Ancestries Reported - Czech (%)
Ancestries Reported - Danish (%)
Ancestries Reported - Dutch (%)
Ancestries Reported - English (%)
Ancestries Reported - French (%)
Ancestries Reported - French Canadian (%)
Ancestries Reported - German (%)
Ancestries Reported - Greek (%)
Ancestries Reported - Hungarian (%)
Ancestries Reported - Irish (%)
Ancestries Reported - Italian (%)
Ancestries Reported - Lithuanian (%)
Ancestries Reported - Norwegian (%)
Ancestries Reported - Polish (%)
Ancestries Reported - Portuguese (%)
Ancestries Reported - Russian (%)
Ancestries Reported - Scotch-Irish (%)
Ancestries Reported - Scottish (%)
Ancestries Reported - Slovak (%)
Ancestries Reported - Subsaharan African (%)
Ancestries Reported - Swedish (%)
Ancestries Reported - Swiss (%)
Ancestries Reported - Ukrainian (%)
Ancestries Reported - United States (%)
Ancestries Reported - Welsh (%)
Ancestries Reported - West Indian (%)
Ancestries Reported - Other (%)
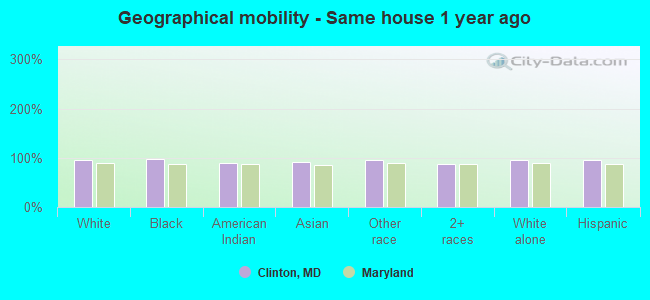
Geographical mobility - Same house 1 year ago (%)
Geographical mobility - Same house 1 year ago (%) - White
Geographical mobility - Same house 1 year ago (%) - Black or African American
Geographical mobility - Same house 1 year ago (%) - Asian
Geographical mobility - Same house 1 year ago (%) - Hispanic or Latino
Geographical mobility - Same house 1 year ago (%) - American Indian and Alaska Native
Geographical mobility - Same house 1 year ago (%) - Multirace
Geographical mobility - Same house 1 year ago (%) - Other Race
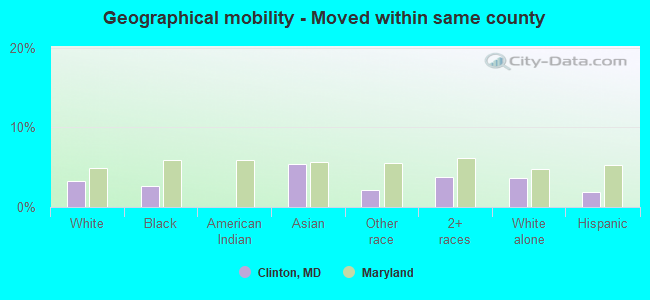
Geographical mobility - Moved within same county (%)
Geographical mobility - Moved within same county (%) - White
Geographical mobility - Moved within same county (%) - Black or African American
Geographical mobility - Moved within same county (%) - Asian
Geographical mobility - Moved within same county (%) - Hispanic or Latino
Geographical mobility - Moved within same county (%) - American Indian and Alaska Native
Geographical mobility - Moved within same county (%) - Multirace
Geographical mobility - Moved within same county (%) - Other Race
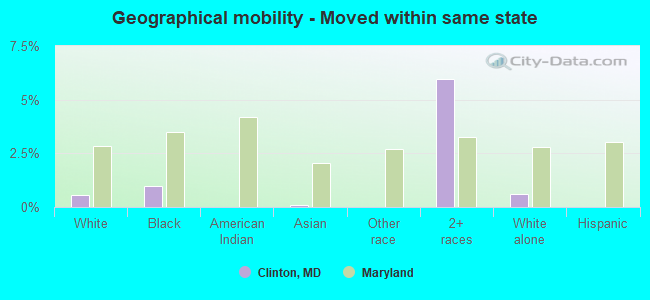
Geographical mobility - Moved from different county within same state (%)
Geographical mobility - Moved from different county within same state (%) - White
Geographical mobility - Moved from different county within same state (%) - Black or African American
Geographical mobility - Moved from different county within same state (%) - Asian
Geographical mobility - Moved from different county within same state (%) - Hispanic or Latino
Geographical mobility - Moved from different county within same state (%) - American Indian and Alaska Native
Geographical mobility - Moved from different county within same state (%) - Multirace
Geographical mobility - Moved from different county within same state (%) - Other Race
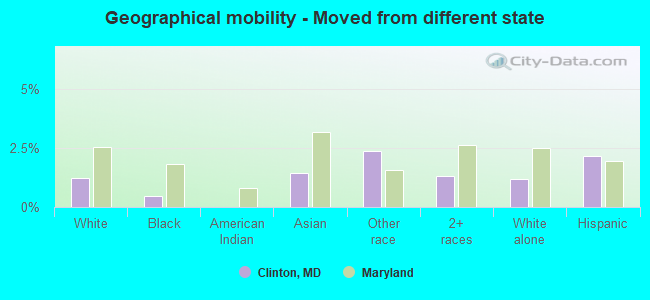
Geographical mobility - Moved from different state (%)
Geographical mobility - Moved from different state (%) - White
Geographical mobility - Moved from different state (%) - Black or African American
Geographical mobility - Moved from different state (%) - Asian
Geographical mobility - Moved from different state (%) - Hispanic or Latino
Geographical mobility - Moved from different state (%) - American Indian and Alaska Native
Geographical mobility - Moved from different state (%) - Multirace
Geographical mobility - Moved from different state (%) - Other Race
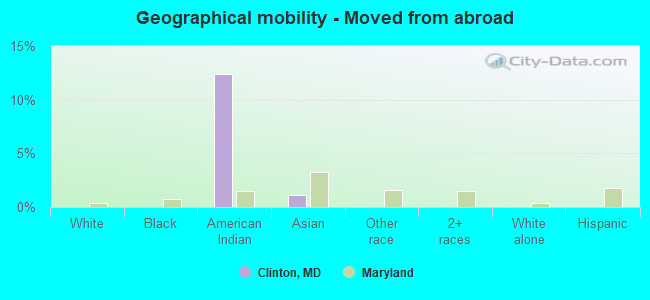
Geographical mobility - Moved from abroad (%)
Geographical mobility - Moved from abroad (%) - White
Geographical mobility - Moved from abroad (%) - Black or African American
Geographical mobility - Moved from abroad (%) - Asian
Geographical mobility - Moved from abroad (%) - Hispanic or Latino
Geographical mobility - Moved from abroad (%) - American Indian and Alaska Native
Geographical mobility - Moved from abroad (%) - Multirace
Geographical mobility - Moved from abroad (%) - Other Race
Place of birth for the foreign-born population - Ireland (%)
Place of birth for the foreign-born population - Denmark (%)
Place of birth for the foreign-born population - Norway (%)
Place of birth for the foreign-born population - Sweden (%)
Place of birth for the foreign-born population - United Kingdom (%)
Place of birth for the foreign-born population - England (%)
Place of birth for the foreign-born population - Scotland (%)
Place of birth for the foreign-born population - Other Northern Europe (%)
Place of birth for the foreign-born population - Austria (%)
Place of birth for the foreign-born population - Belgium (%)
Place of birth for the foreign-born population - France (%)
Place of birth for the foreign-born population - Germany (%)
Place of birth for the foreign-born population - Netherlands (%)
Place of birth for the foreign-born population - Switzerland (%)
Place of birth for the foreign-born population - Other Western Europe (%)
Place of birth for the foreign-born population - Greece (%)
Place of birth for the foreign-born population - Italy (%)
Place of birth for the foreign-born population - Portugal (%)
Place of birth for the foreign-born population - Spain (%)
Place of birth for the foreign-born population - Other Southern Europe (%)
Place of birth for the foreign-born population - Albania (%)
Place of birth for the foreign-born population - Belarus (%)
Place of birth for the foreign-born population - Bosnia and Herzegovina (%)
Place of birth for the foreign-born population - Bulgaria (%)
Place of birth for the foreign-born population - Croatia (%)
Place of birth for the foreign-born population - Czechoslovakia (%)
Place of birth for the foreign-born population - Hungary (%)
Place of birth for the foreign-born population - Latvia (%)
Place of birth for the foreign-born population - Lithuania (%)
Place of birth for the foreign-born population - North Macedonia (Macedonia) (%)
Place of birth for the foreign-born population - Moldova (%)
Place of birth for the foreign-born population - Poland (%)
Place of birth for the foreign-born population - Romania (%)
Place of birth for the foreign-born population - Russia (%)
Place of birth for the foreign-born population - Serbia (%)
Place of birth for the foreign-born population - Ukraine (%)
Place of birth for the foreign-born population - Other Eastern Europe (%)
Place of birth for the foreign-born population - China (%)
Place of birth for the foreign-born population - Hong Kong (%)
Place of birth for the foreign-born population - Taiwan (%)
Place of birth for the foreign-born population - Japan (%)
Place of birth for the foreign-born population - Korea (%)
Place of birth for the foreign-born population - Other Eastern Asia (%)
Place of birth for the foreign-born population - Afghanistan (%)
Place of birth for the foreign-born population - Bangladesh (%)
Place of birth for the foreign-born population - India (%)
Place of birth for the foreign-born population - Iran (%)
Place of birth for the foreign-born population - Kazakhstan (%)
Place of birth for the foreign-born population - Nepal (%)
Place of birth for the foreign-born population - Pakistan (%)
Place of birth for the foreign-born population - Sri Lanka (%)
Place of birth for the foreign-born population - Uzbekistan (%)
Place of birth for the foreign-born population - Other South Central Asia (%)
Place of birth for the foreign-born population - Burma (%)
Place of birth for the foreign-born population - Cambodia (%)
Place of birth for the foreign-born population - Indonesia (%)
Place of birth for the foreign-born population - Laos (%)
Place of birth for the foreign-born population - Malaysia (%)
Place of birth for the foreign-born population - Philippines (%)
Place of birth for the foreign-born population - Singapore (%)
Place of birth for the foreign-born population - Thailand (%)
Place of birth for the foreign-born population - Vietnam (%)
Place of birth for the foreign-born population - Other South Eastern Asia (%)
Place of birth for the foreign-born population - Armenia (%)
Place of birth for the foreign-born population - Iraq (%)
Place of birth for the foreign-born population - Israel (%)
Place of birth for the foreign-born population - Jordan (%)
Place of birth for the foreign-born population - Kuwait (%)
Place of birth for the foreign-born population - Lebanon (%)
Place of birth for the foreign-born population - Saudi Arabia (%)
Place of birth for the foreign-born population - Syria (%)
Place of birth for the foreign-born population - Turkey (%)
Place of birth for the foreign-born population - Yemen (%)
Place of birth for the foreign-born population - Other Western Asia (%)
Place of birth for the foreign-born population - Eritrea (%)
Place of birth for the foreign-born population - Ethiopia (%)
Place of birth for the foreign-born population - Kenya (%)
Place of birth for the foreign-born population - Somalia (%)
Place of birth for the foreign-born population - Uganda (%)
Place of birth for the foreign-born population - Zimbabwe (%)
Place of birth for the foreign-born population - Other Eastern Africa (%)
Place of birth for the foreign-born population - Cameroon (%)
Place of birth for the foreign-born population - Congo (%)
Place of birth for the foreign-born population - Democratic Republic of Congo (Zaire) (%)
Place of birth for the foreign-born population - Other Middle Africa (%)
Place of birth for the foreign-born population - Egypt (%)
Place of birth for the foreign-born population - Morocco (%)
Place of birth for the foreign-born population - Sudan (%)
Place of birth for the foreign-born population - Other Northern Africa (%)
Place of birth for the foreign-born population - South Africa (%)
Place of birth for the foreign-born population - Other Southern Africa (%)
Place of birth for the foreign-born population - Cabo Verde (%)
Place of birth for the foreign-born population - Ghana (%)
Place of birth for the foreign-born population - Liberia (%)
Place of birth for the foreign-born population - Nigeria (%)
Place of birth for the foreign-born population - Senegal (%)
Place of birth for the foreign-born population - Sierra Leone (%)
Place of birth for the foreign-born population - Other Western Africa (%)
Place of birth for the foreign-born population - Australia (%)
Place of birth for the foreign-born population - New Zealand (%)
Place of birth for the foreign-born population - Fiji (%)
Place of birth for the foreign-born population - Micronesia (%)
Place of birth for the foreign-born population - Bahamas (%)
Place of birth for the foreign-born population - Barbados (%)
Place of birth for the foreign-born population - Cuba (%)
Place of birth for the foreign-born population - Dominica (%)
Place of birth for the foreign-born population - Dominican Republic (%)
Place of birth for the foreign-born population - Grenada (%)
Place of birth for the foreign-born population - Haiti (%)
Place of birth for the foreign-born population - Jamaica (%)
Place of birth for the foreign-born population - St. Vincent and the Grenadines (%)
Place of birth for the foreign-born population - Trinidad and Tobago (%)
Place of birth for the foreign-born population - West Indies (%)
Place of birth for the foreign-born population - Other Caribbean (%)
Place of birth for the foreign-born population - Belize (%)
Place of birth for the foreign-born population - Costa Rica (%)
Place of birth for the foreign-born population - El Salvador (%)
Place of birth for the foreign-born population - Guatemala (%)
Place of birth for the foreign-born population - Honduras (%)
Place of birth for the foreign-born population - Mexico (%)
Place of birth for the foreign-born population - Nicaragua (%)
Place of birth for the foreign-born population - Panama (%)
Place of birth for the foreign-born population - Other Central America (%)
Place of birth for the foreign-born population - Argentina (%)
Place of birth for the foreign-born population - Bolivia (%)
Place of birth for the foreign-born population - Brazil (%)
Place of birth for the foreign-born population - Chile (%)
Place of birth for the foreign-born population - Colombia (%)
Place of birth for the foreign-born population - Ecuador (%)
Place of birth for the foreign-born population - Guyana (%)
Place of birth for the foreign-born population - Peru (%)
Place of birth for the foreign-born population - Uruguay (%)
Place of birth for the foreign-born population - Venezuela (%)
Place of birth for the foreign-born population - Other South America (%)
Place of birth for the foreign-born population - Canada (%)
Place of birth for the foreign-born population - Other Northern America (%)
Place of birth for the foreign-born population - Other (%)
Latest news about races in Clinton, MD collected exclusively by city-data.com from local newspapers, TV, and radio stations
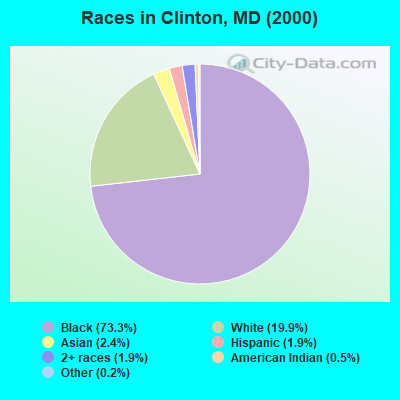
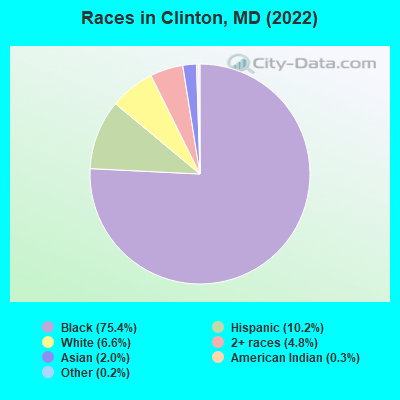
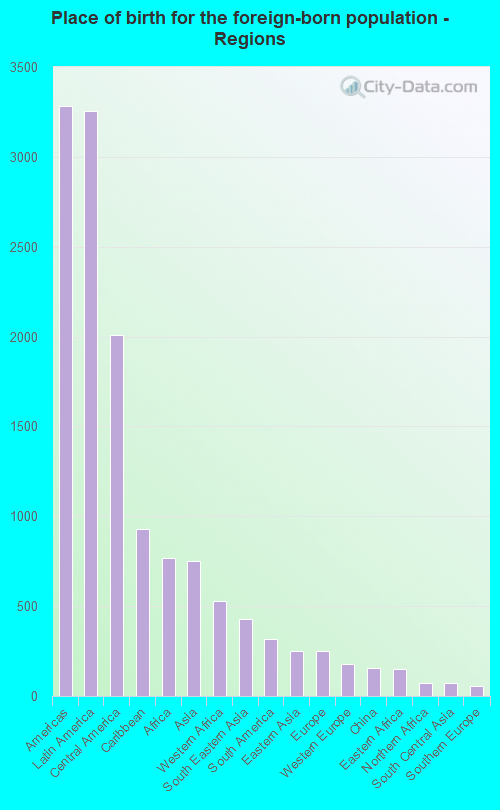
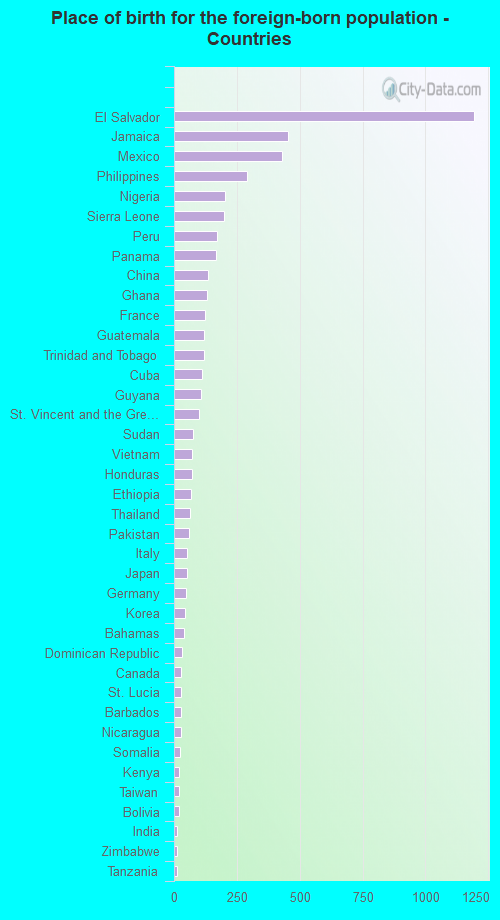
According to 2022 data, the most numerous races in Clinton, MD are White alone (2,632 residents), Black alone (30,007 residents), and Hispanic (4,046 residents). 83.1% of Clinton residents speak English at home. 12.7% of Clinton, MD residents are foreign-born (7.6% born in Latin America, 1.8% born in Africa, 1.8% born in Asia), which is 26.0% less than the foreign-born rate of 16.0% across the entire state of Maryland.
Race distribution in Clinton
2000 2022
3,286,547 62.1% White alone 1,464,735 27.7% Black alone 227,916 4.3% Hispanic 209,738 4.0% Asian alone 82,946 1.6% Two or more races 13,312 0.3% American Indian alone 9,379 0.2% Other race alone 1,913 0.04% Native Hawaiian and Other
2,906,492 47.1% White alone 1,800,914 29.2% Black alone 705,842 11.4% Hispanic 401,818 6.5% Asian alone 291,317 4.7% Two or more races 46,930 0.8% Other race alone 8,930 0.1% American Indian alone 2,417 0.04% Native Hawaiian and Other
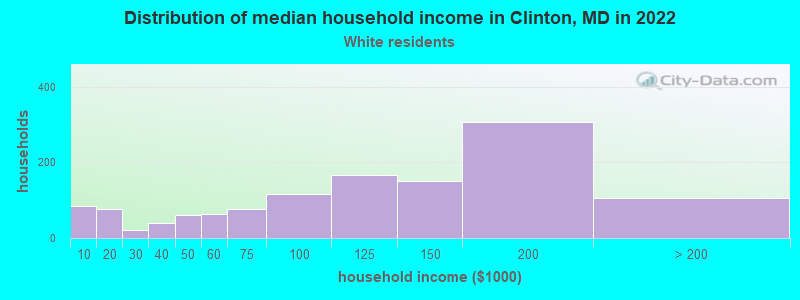
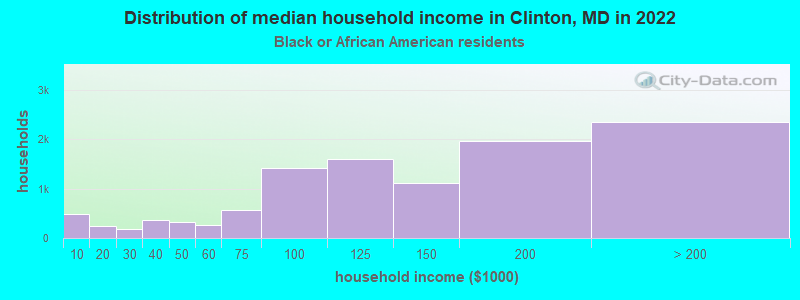
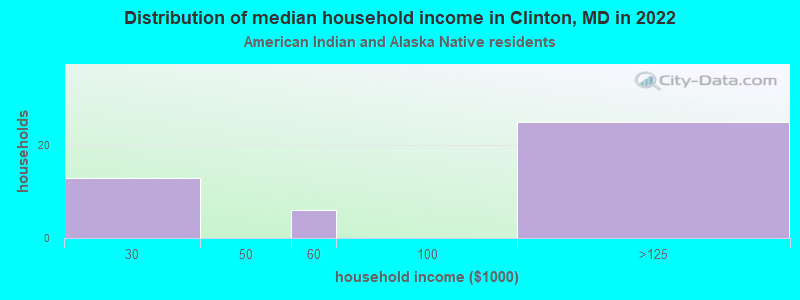
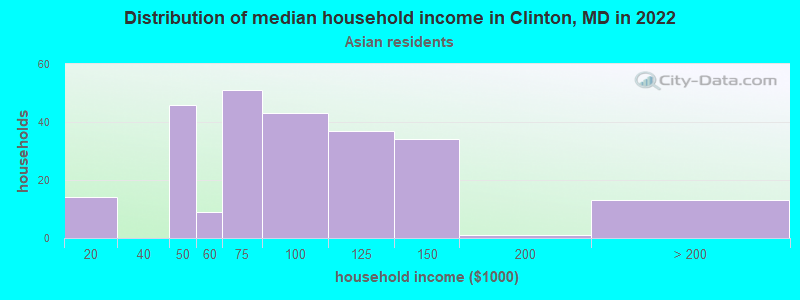
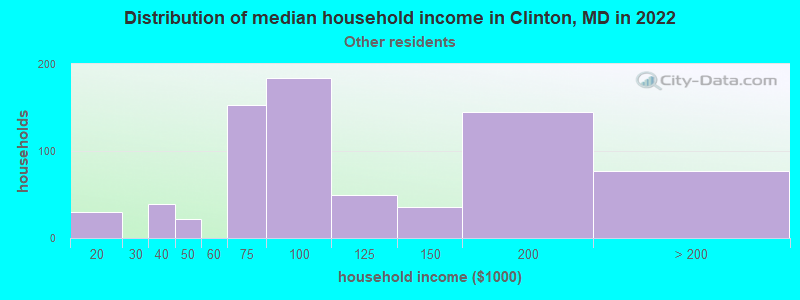
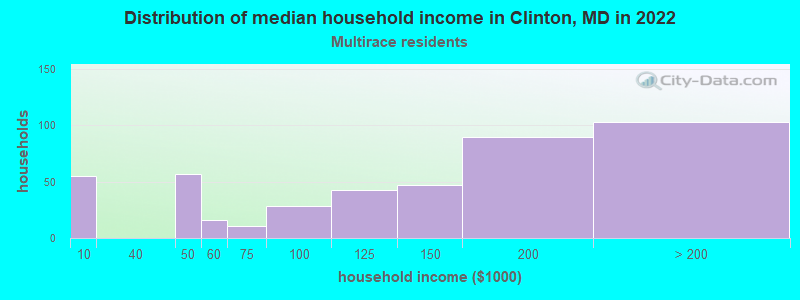
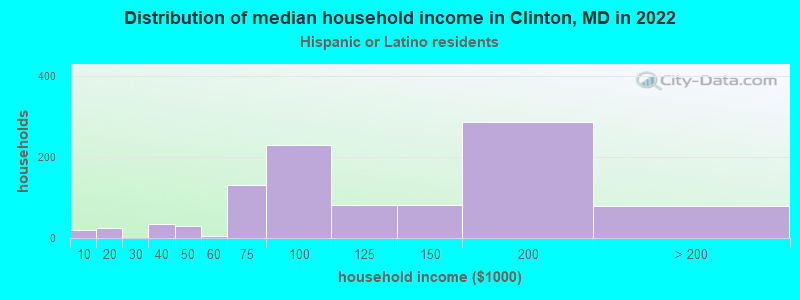
Income and house value in Clinton Median household income in 2022 $101,696 White non-Hispanic householders$123,962 Black householders$83,476 Asian householders$95,911 Some other race householders$135,841 Two or more races householders$105,605 Hispanic or Latino race householdersMedian 2022 house value $382,044 White Non-Hispanic householders$417,414 Black or African American householders$406,491 American Indian or Alaska Native householders $440,820 Asian householders$526,644 Some other race householders$374,242 Two or more races householders$422,615 Hispanic or Latino householders
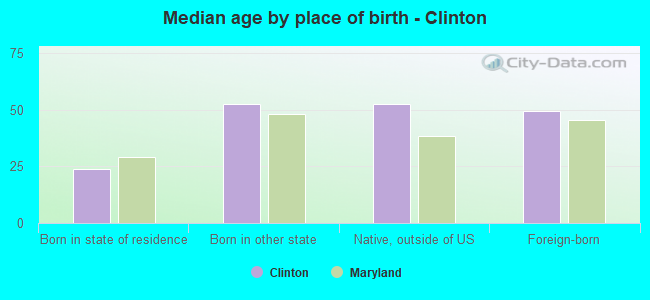
Median age by race in Clinton
58.0 Median age for White residents56.3 61.2 46.6 Median age for Black or African American residents44.6 48.4 59.2 Median age for American Indian / Alaska Native residents68.0 36.8 48.2 Median age for Asian residents44.0 48.9 -571,600,480.8 Median age for Native Hawaiian / Pacific Islander residents-720,061,021.4 -760,942,760.2 36.2 Median age for Other race residents32.4 41.0 31.8 Median age for Two or more races residents34.0 24.1 59.5 Median age for White alone residents54.5 61.4 38.1 Median age for Hispanic or Latino residents36.5 39.5
Owner/renter occupied households by race in Clinton
House owners and renters - White residents 1,114 94.3% Owner occupied68 5.7% Renter occupiedHouse owners and renters - Black or African American residents 10,005 90.8% Owner occupied1,014 9.2% Renter occupiedHouse owners and renters - American Indian / Alaska Native residents 64 100.0% Owner occupiedHouse owners and renters - Asian residents 269 100.0% Owner occupiedHouse owners and renters - Other race residents 547 75.7% Owner occupied175 24.3% Renter occupiedHouse owners and renters - Two or more races residents 505 97.8% Owner occupied11 2.2% Renter occupiedHouse owners and renters - White alone residents 1,093 95.0% Owner occupied58 5.0% Renter occupiedHouse owners and renters - Hispanic or Latino residents 813 82.6% Owner occupied172 17.4% Renter occupied
Language usage in Clinton
English speakers - Total 83.1% of residents of Clinton speak English at home.
9.8% of residents speak Spanish at home 1,719 45.7% Speak English very well2,042 54.3% Speak English less than very well5.2% of residents speak other language at home 1,526 76.9% Speak English very well459 23.1% Speak English less than very well
English speakers - Born in the United States 95.3% of residents of Clinton speak English at home.
3.0% of residents speak Spanish at home 521 77.5% Speak English very well151 22.5% Speak English less than very well0.9% of residents speak other language at home 197 100.0% Speak English very well
English speakers - Native, born elsewhere 69.5% of residents of Clinton speak English at home.
28.6% of residents speak Spanish at home 149 53.8% Speak English very well128 46.2% Speak English less than very well1.8% of residents speak other language at home 17 100.0% Speak English very well
English speakers - Foreign-born 28.0% of residents of Clinton speak English at home.
43.2% of residents speak Spanish at home 507 22.9% Speak English very well1,705 77.1% Speak English less than very well27.7% of residents speak other language at home 963 67.9% Speak English very well456 32.1% Speak English less than very well
White (Caucasian) - Speak only English Native:
95.1% (2,432)Foreign-born:
33.2% (55)
White (Caucasian) - Speak another language Native:
5.3% (135)Foreign-born:
70.1% (117)
Black or African American - Speak only English Native:
97.3% (25,944)Foreign-born:
54.0% (1,084)
Black or African American - Speak another language Native:
2.5% (668)Foreign-born:
43.8% (879)
American Indian / Alaska Native - Speak only English Native:
53.3% (71)Foreign-born:
42.6% (35)
American Indian / Alaska Native - Speak another language Native:
26.8% (36)Foreign-born:
57.8% (48)
Asian - Speak only English Native:
14.0% (25)Foreign-born:
22.2% (140)
Asian - Speak another language Native:
100.0% (178)Foreign-born:
79.4% (502)
Other race - Speak only English Native:
16.8% (179)Foreign-born:
4.4% (88)
Other race - Speak another language Native:
83.2% (884)Foreign-born:
95.3% (1,886)
Two or more races - Speak only English Native:
87.2% (1,735)Foreign-born:
16.6% (39)
Two or more races - Speak another language Native:
11.9% (236)Foreign-born:
84.5% (198)
White alone - Speak only English Native:
98.2% (2,423)Foreign-born:
42.6% (62)
White alone - Speak another language Native:
0.9% (23)Foreign-born:
58.0% (84)
Hispanic or Latino - Speak only English Native:
20.7% (329)Foreign-born:
3.6% (84)
Hispanic or Latino - Speak another language Native:
79.2% (1,260)Foreign-born:
96.4% (2,227)
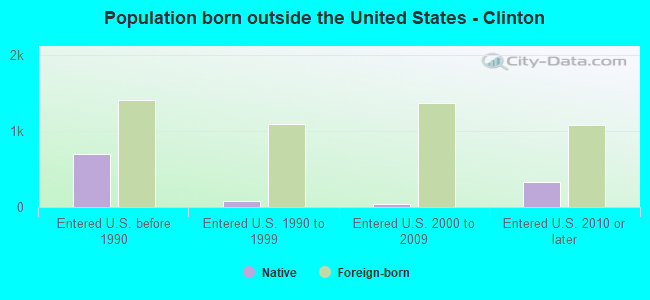
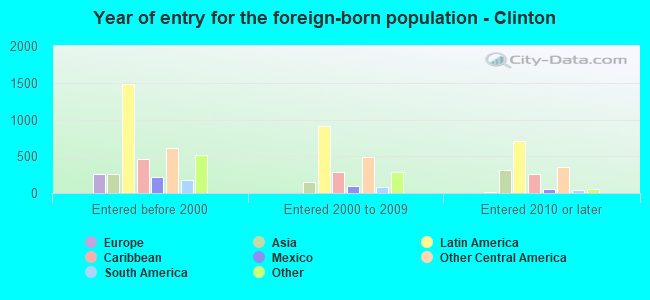
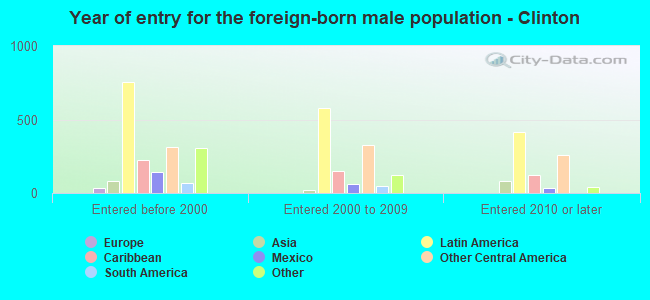
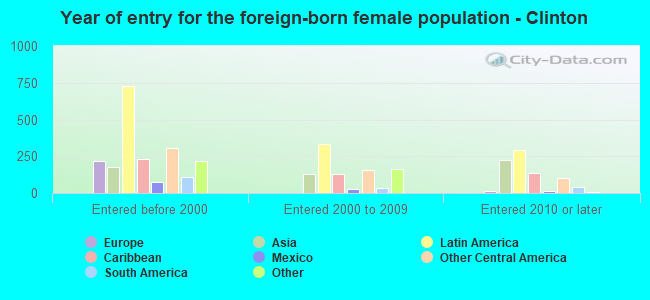
Foreign-born residents in Clinton 5,053 residents are foreign born (7.6% Latin America , 1.8% Africa , 1.8% Asia ).
This city:
12.7%Maryland:
15.7%
Marital status for residents in Clinton Marital status - White (Caucasian) population 15 years and over
Males 32.4% Never married42.5% Now married1.2% Separated5.7% Widowed18.1% DivorcedFemales 19.9% Never married38.8% Now married0.0% Separated25.5% Widowed15.8% DivorcedWomen who did not give birth in the past 12 months Now married:
35.8% (128)Unmarried:
64.2% (230)
Marital status - Black or African American population 15 years and over
Males 41.2% Never married46.8% Now married1.3% Separated3.1% Widowed7.5% DivorcedFemales 36.1% Never married39.6% Now married2.1% Separated9.9% Widowed12.3% DivorcedWomen who gave birth in the past 12 months Now married:
62.1% (116)Unmarried:
37.9% (71)
Women who did not give birth in the past 12 months Now married:
32.9% (2,024)Unmarried:
67.1% (4,130)
Marital status - American Indian / Alaska Native population 15 years and over
Males 0.0% Never married66.7% Now married0.0% Separated0.0% Widowed33.3% DivorcedFemales 38.1% Never married28.6% Now married0.0% Separated19.0% Widowed14.3% DivorcedWomen who gave birth in the past 12 months Now married:
28.6% (6)Unmarried:
71.4% (15)
Women who did not give birth in the past 12 months Now married:
0.0% (0)Unmarried:
100.0% (21)
Marital status - Asian population 15 years and over
Males 36.6% Never married55.1% Now married0.0% Separated0.0% Widowed8.3% DivorcedFemales 24.7% Never married57.1% Now married4.0% Separated12.9% Widowed1.4% DivorcedWomen who did not give birth in the past 12 months Now married:
59.9% (190)Unmarried:
40.1% (127)
Marital status - Other race population 15 years and over
Males 33.9% Never married63.0% Now married0.0% Separated0.0% Widowed3.0% DivorcedFemales 37.8% Never married50.7% Now married2.5% Separated3.4% Widowed5.6% DivorcedWomen who gave birth in the past 12 months Now married:
0.0% (0)Unmarried:
100.0% (23)
Women who did not give birth in the past 12 months Now married:
52.2% (460)Unmarried:
47.8% (421)
Marital status - Two or more races population 15 years and over
Males 55.4% Never married29.6% Now married0.0% Separated3.5% Widowed11.6% DivorcedFemales 51.4% Never married40.7% Now married0.0% Separated0.0% Widowed8.0% DivorcedWomen who gave birth in the past 12 months Now married:
0.0% (0)Unmarried:
100.0% (13)
Women who did not give birth in the past 12 months Now married:
31.0% (121)Unmarried:
69.0% (268)
Marital status - White alone, not Hispanic / Latino population 15 years and over
Males 29.9% Never married43.3% Now married0.3% Separated6.3% Widowed20.1% DivorcedFemales 17.2% Never married39.8% Now married0.0% Separated27.1% Widowed15.9% DivorcedWomen who did not give birth in the past 12 months Now married:
39.0% (123)Unmarried:
61.0% (192)
Marital status - Hispanic or Latino population 15 years and over
Males 30.8% Never married65.5% Now married0.7% Separated0.0% Widowed3.0% DivorcedFemales 38.7% Never married52.2% Now married1.8% Separated2.5% Widowed4.8% DivorcedWomen who gave birth in the past 12 months Now married:
16.0% (4)Unmarried:
84.0% (22)
Women who did not give birth in the past 12 months Now married:
45.9% (484)Unmarried:
54.1% (571)
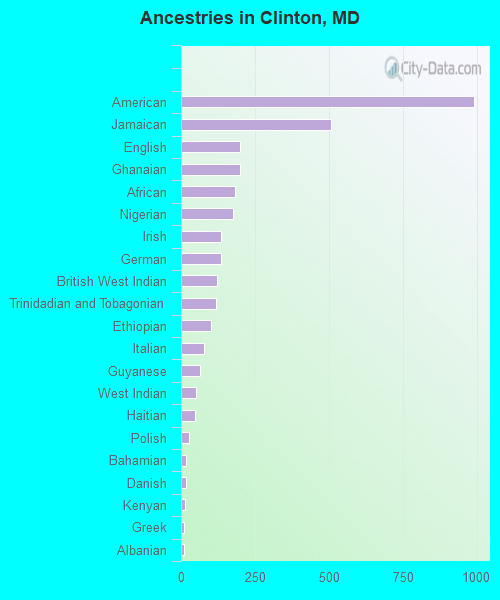
Ancestries in Clinton
992 3.7% American506 1.9% Jamaican198 0.7% English198 0.7% Ghanaian183 0.7% African177 0.7% Nigerian135 0.5% Irish134 0.5% German123 0.5% British West Indian120 0.4% Trinidadian and Tobagonian103 0.4% Ethiopian77 0.3% Italian65 0.2% Guyanese50 0.2% West Indian47 0.2% Haitian28 0.1% Polish18 0.07% Bahamian16 0.06% Danish12 0.04% Kenyan11 0.04% Greek10 0.04% Albanian9 0.03% Scottish7 0.03% Croatian7 0.03% Scandinavian6 0.02% European5 0.02% Pennsylvania German5 0.02% Scotch-Irish5 0.02% Swedish3 0.01% Dutch
Geographical mobility in Clinton Same house 1 year ago 2,609 95.8% White (Caucasian)29,366 97.7% Black or African American201 88.8% American Indian / Alaska Native755 92.1% Asian2,976 95.0% Other race2,178 86.9% Two or more races2,528 95.8% White alone, not Hispanic / Latino3,863 95.5% Hispanic or LatinoMoved within same county 88 3.2% White / Caucasian782 2.6% Black or African American45 5.4% Asian67 2.1% Other race94 3.7% Two or more races97 3.7% White alone, not Hispanic / Latino76 1.9% Hispanic or LatinoMoved within same state 15 0.5% White / Caucasian291 1.0% Black or African American1 0.1% Asian149 6.0% Two or more races16 0.6% White alone, not Hispanic / LatinoMoved from different state 33 1.2% White / Caucasian136 0.5% Black or African American12 1.4% Asian74 2.4% Other race33 1.3% Two or more races31 1.2% White alone, not Hispanic / Latino87 2.1% Hispanic or LatinoMoved from abroad 10 0.0% Black or African American28 12.4% American Indian / Alaska Native9 1.1% Asian
Children Nativity (place of birth) in Clinton
Children under 6 years - Living with two parents Both parents native 449 100.0% NativeBoth parents foreign-born 138 100.0% NativeOne native, one foreign-born parent 158 100.0% NativeChildren under 6 years - Living with one parent Native parent 713 100.0% NativeForeign-born parent 200 100.0% NativeChildren 6 to 17 years - Living with two parents Both parents native 1,699 100.0% Native0 0.0% Foreign-bornBoth parents foreign-born 550 80.5% Native133 19.5% Foreign-bornOne native, one foreign-born parent 227 100.0% NativeChildren 6 to 17 years - Living with one parent Native parent 2,057 100.0% NativeForeign-born parent 187 57.3% Native140 42.7% Foreign-born
Grandparents responsible for own grandchildren in Clinton
Grandparents (30 to 59 years) White / Caucasian 28 100.0% Not responsible for grandchildrenBlack or African American 195 41.4% Responsible for grandchildren275 58.6% Not responsible for grandchildrenOther race 11 100.0% Not responsible for grandchildrenTwo or more races 69 100.0% Responsible for grandchildrenWhite alone, not Hispanic / Latino 31 100.0% Not responsible for grandchildrenHispanic or Latino 12 100.0% Not responsible for grandchildrenGrandparents (60 years and over) White / Caucasian 65 83.9% Responsible for grandchildren12 16.1% Not responsible for grandchildrenBlack or African American 181 21.9% Responsible for grandchildren647 78.1% Not responsible for grandchildrenOther race 19 100.0% Responsible for grandchildrenTwo or more races 22 28.8% Responsible for grandchildren56 71.2% Not responsible for grandchildrenWhite alone, not Hispanic / Latino 65 82.9% Responsible for grandchildren13 17.1% Not responsible for grandchildrenHispanic or Latino 30 100.0% Responsible for grandchildren