Races in Cleveland, Ohio (OH) Detailed Stats
Data:
Races - White alone (%)
Races - White alone (% change since 2000)
Races - Black alone (%)
Races - Black alone (% change since 2000)
Races - American Indian alone (%)
Races - American Indian alone (% change since 2000)
Races - Asian alone (%)
Races - Asian alone (% change since 2000)
Races - Hispanic (%)
Races - Hispanic (% change since 2000)
Races - Native Hawaiian and Other Pacific Islander alone (%)
Races - Native Hawaiian and Other Pacific Islander alone (% change since 2000)
Races - Two or more races(%)
Races - Two or more races(% change since 2000)
Races - Other race alone (%)
Races - Other race alone (% change since 2000)
Racial diversity
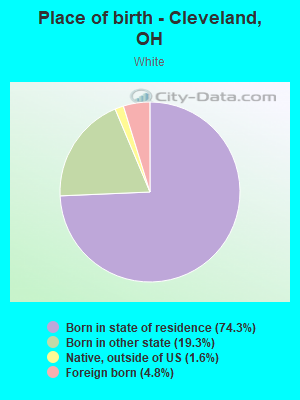
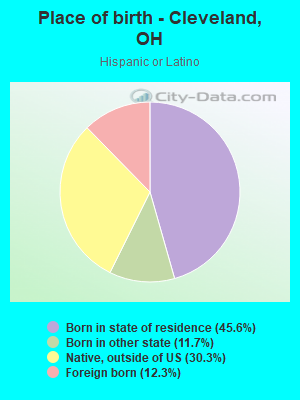
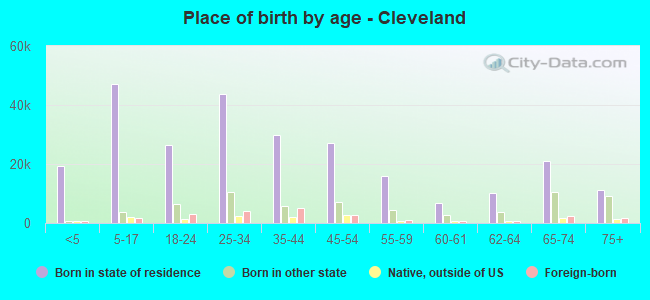
Place of birth - Born in state of residence (%)
Place of birth - Born in state of residence (%) - White
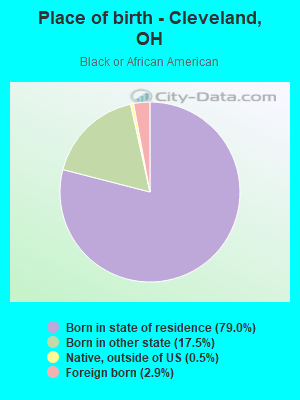
Place of birth - Born in state of residence (%) - Black or African American
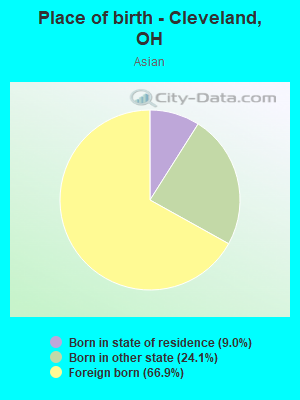
Place of birth - Born in state of residence (%) - Asian
Place of birth - Born in state of residence (%) - Hispanic or Latino
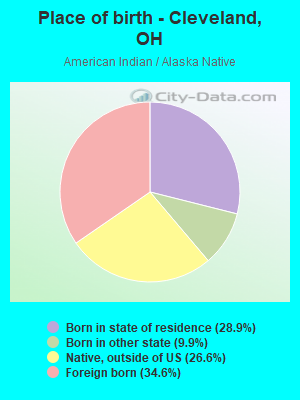
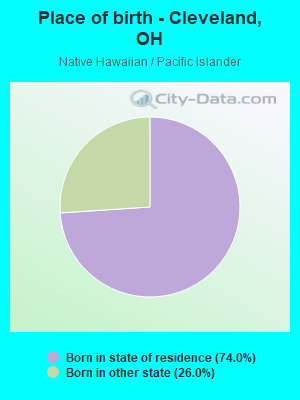
Place of birth - Born in state of residence (%) - American Indian and Alaska Native
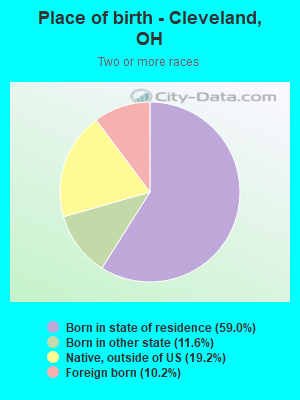
Place of birth - Born in state of residence (%) - Multirace
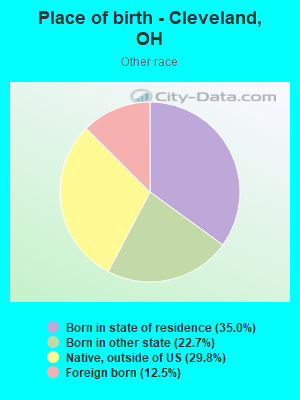
Place of birth - Born in state of residence (%) - Other Race
Place of birth - Born in other state (%)
Place of birth - Born in other state (%) - White
Place of birth - Born in other state (%) - Black or African American
Place of birth - Born in other state (%) - Asian
Place of birth - Born in other state (%) - Hispanic or Latino
Place of birth - Born in other state (%) - American Indian and Alaska Native
Place of birth - Born in other state (%) - Multirace
Place of birth - Born in other state (%) - Other Race
Place of birth - Native, outside of US (%)
Place of birth - Native, outside of US (%) - White
Place of birth - Native, outside of US (%) - Black or African American
Place of birth - Native, outside of US (%) - Asian
Place of birth - Native, outside of US (%) - Hispanic or Latino
Place of birth - Native, outside of US (%) - American Indian and Alaska Native
Place of birth - Native, outside of US (%) - Multirace
Place of birth - Native, outside of US (%) - Other Race
Place of birth - Foreign born (%)
Place of birth - Foreign born (%) - White
Place of birth - Foreign born (%) - Black or African American
Place of birth - Foreign born (%) - Asian
Place of birth - Foreign born (%) - Hispanic or Latino
Place of birth - Foreign born (%) - American Indian and Alaska Native
Place of birth - Foreign born (%) - Multirace
Place of birth - Foreign born (%) - Other Race
Residents speaking English at home (%)
Residents speaking English at home - Born in the United States (%)
Residents speaking English at home - Native, born elsewhere (%)
Residents speaking English at home - Foreign born (%)
Residents speaking Spanish at home (%)
Residents speaking Spanish at home - Born in the United States (%)
Residents speaking Spanish at home - Native, born elsewhere (%)
Residents speaking Spanish at home - Foreign born (%)
Residents speaking other language at home (%)
Residents speaking other language at home - Born in the United States (%)
Residents speaking other language at home - Native, born elsewhere (%)
Residents speaking other language at home - Foreign born (%)
Marital status - Never married (%)
Marital status - Now married (%)
Marital status - Separated (%)
Marital status - Widowed (%)
Marital status - Divorced (%)
Ancestries Reported - Arab (%)
Ancestries Reported - Czech (%)
Ancestries Reported - Danish (%)
Ancestries Reported - Dutch (%)
Ancestries Reported - English (%)
Ancestries Reported - French (%)
Ancestries Reported - French Canadian (%)
Ancestries Reported - German (%)
Ancestries Reported - Greek (%)
Ancestries Reported - Hungarian (%)
Ancestries Reported - Irish (%)
Ancestries Reported - Italian (%)
Ancestries Reported - Lithuanian (%)
Ancestries Reported - Norwegian (%)
Ancestries Reported - Polish (%)
Ancestries Reported - Portuguese (%)
Ancestries Reported - Russian (%)
Ancestries Reported - Scotch-Irish (%)
Ancestries Reported - Scottish (%)
Ancestries Reported - Slovak (%)
Ancestries Reported - Subsaharan African (%)
Ancestries Reported - Swedish (%)
Ancestries Reported - Swiss (%)
Ancestries Reported - Ukrainian (%)
Ancestries Reported - United States (%)
Ancestries Reported - Welsh (%)
Ancestries Reported - West Indian (%)
Ancestries Reported - Other (%)
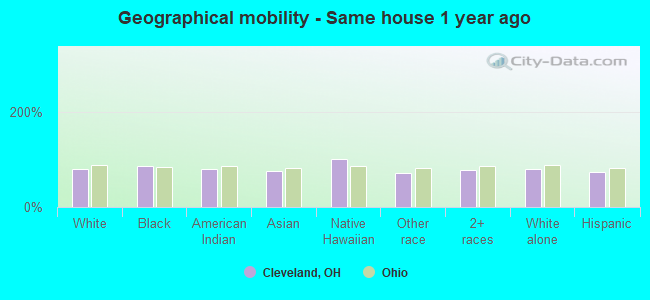
Geographical mobility - Same house 1 year ago (%)
Geographical mobility - Same house 1 year ago (%) - White
Geographical mobility - Same house 1 year ago (%) - Black or African American
Geographical mobility - Same house 1 year ago (%) - Asian
Geographical mobility - Same house 1 year ago (%) - Hispanic or Latino
Geographical mobility - Same house 1 year ago (%) - American Indian and Alaska Native
Geographical mobility - Same house 1 year ago (%) - Multirace
Geographical mobility - Same house 1 year ago (%) - Other Race
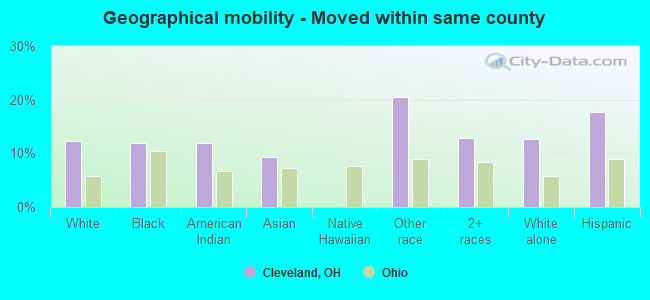
Geographical mobility - Moved within same county (%)
Geographical mobility - Moved within same county (%) - White
Geographical mobility - Moved within same county (%) - Black or African American
Geographical mobility - Moved within same county (%) - Asian
Geographical mobility - Moved within same county (%) - Hispanic or Latino
Geographical mobility - Moved within same county (%) - American Indian and Alaska Native
Geographical mobility - Moved within same county (%) - Multirace
Geographical mobility - Moved within same county (%) - Other Race
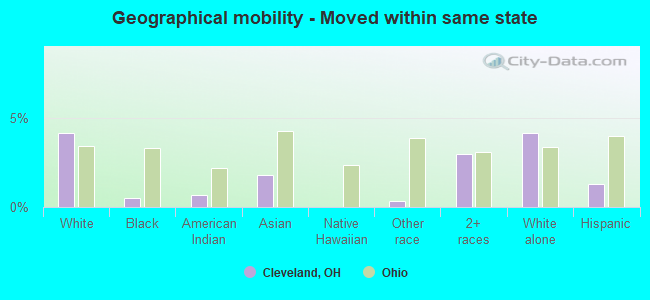
Geographical mobility - Moved from different county within same state (%)
Geographical mobility - Moved from different county within same state (%) - White
Geographical mobility - Moved from different county within same state (%) - Black or African American
Geographical mobility - Moved from different county within same state (%) - Asian
Geographical mobility - Moved from different county within same state (%) - Hispanic or Latino
Geographical mobility - Moved from different county within same state (%) - American Indian and Alaska Native
Geographical mobility - Moved from different county within same state (%) - Multirace
Geographical mobility - Moved from different county within same state (%) - Other Race
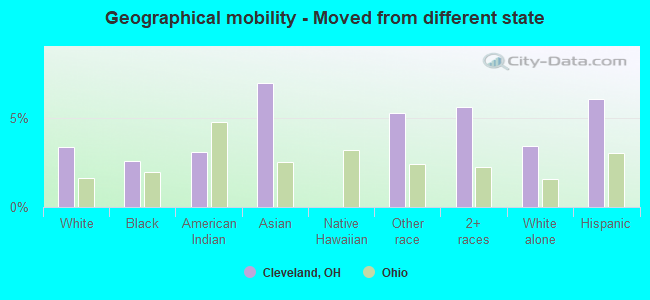
Geographical mobility - Moved from different state (%)
Geographical mobility - Moved from different state (%) - White
Geographical mobility - Moved from different state (%) - Black or African American
Geographical mobility - Moved from different state (%) - Asian
Geographical mobility - Moved from different state (%) - Hispanic or Latino
Geographical mobility - Moved from different state (%) - American Indian and Alaska Native
Geographical mobility - Moved from different state (%) - Multirace
Geographical mobility - Moved from different state (%) - Other Race
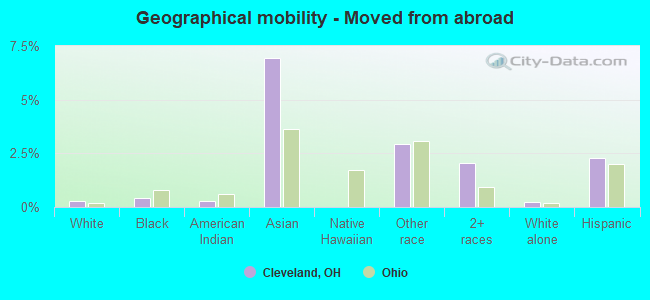
Geographical mobility - Moved from abroad (%)
Geographical mobility - Moved from abroad (%) - White
Geographical mobility - Moved from abroad (%) - Black or African American
Geographical mobility - Moved from abroad (%) - Asian
Geographical mobility - Moved from abroad (%) - Hispanic or Latino
Geographical mobility - Moved from abroad (%) - American Indian and Alaska Native
Geographical mobility - Moved from abroad (%) - Multirace
Geographical mobility - Moved from abroad (%) - Other Race
Place of birth for the foreign-born population - Ireland (%)
Place of birth for the foreign-born population - Denmark (%)
Place of birth for the foreign-born population - Norway (%)
Place of birth for the foreign-born population - Sweden (%)
Place of birth for the foreign-born population - United Kingdom (%)
Place of birth for the foreign-born population - England (%)
Place of birth for the foreign-born population - Scotland (%)
Place of birth for the foreign-born population - Other Northern Europe (%)
Place of birth for the foreign-born population - Austria (%)
Place of birth for the foreign-born population - Belgium (%)
Place of birth for the foreign-born population - France (%)
Place of birth for the foreign-born population - Germany (%)
Place of birth for the foreign-born population - Netherlands (%)
Place of birth for the foreign-born population - Switzerland (%)
Place of birth for the foreign-born population - Other Western Europe (%)
Place of birth for the foreign-born population - Greece (%)
Place of birth for the foreign-born population - Italy (%)
Place of birth for the foreign-born population - Portugal (%)
Place of birth for the foreign-born population - Spain (%)
Place of birth for the foreign-born population - Other Southern Europe (%)
Place of birth for the foreign-born population - Albania (%)
Place of birth for the foreign-born population - Belarus (%)
Place of birth for the foreign-born population - Bosnia and Herzegovina (%)
Place of birth for the foreign-born population - Bulgaria (%)
Place of birth for the foreign-born population - Croatia (%)
Place of birth for the foreign-born population - Czechoslovakia (%)
Place of birth for the foreign-born population - Hungary (%)
Place of birth for the foreign-born population - Latvia (%)
Place of birth for the foreign-born population - Lithuania (%)
Place of birth for the foreign-born population - North Macedonia (Macedonia) (%)
Place of birth for the foreign-born population - Moldova (%)
Place of birth for the foreign-born population - Poland (%)
Place of birth for the foreign-born population - Romania (%)
Place of birth for the foreign-born population - Russia (%)
Place of birth for the foreign-born population - Serbia (%)
Place of birth for the foreign-born population - Ukraine (%)
Place of birth for the foreign-born population - Other Eastern Europe (%)
Place of birth for the foreign-born population - China (%)
Place of birth for the foreign-born population - Hong Kong (%)
Place of birth for the foreign-born population - Taiwan (%)
Place of birth for the foreign-born population - Japan (%)
Place of birth for the foreign-born population - Korea (%)
Place of birth for the foreign-born population - Other Eastern Asia (%)
Place of birth for the foreign-born population - Afghanistan (%)
Place of birth for the foreign-born population - Bangladesh (%)
Place of birth for the foreign-born population - India (%)
Place of birth for the foreign-born population - Iran (%)
Place of birth for the foreign-born population - Kazakhstan (%)
Place of birth for the foreign-born population - Nepal (%)
Place of birth for the foreign-born population - Pakistan (%)
Place of birth for the foreign-born population - Sri Lanka (%)
Place of birth for the foreign-born population - Uzbekistan (%)
Place of birth for the foreign-born population - Other South Central Asia (%)
Place of birth for the foreign-born population - Burma (%)
Place of birth for the foreign-born population - Cambodia (%)
Place of birth for the foreign-born population - Indonesia (%)
Place of birth for the foreign-born population - Laos (%)
Place of birth for the foreign-born population - Malaysia (%)
Place of birth for the foreign-born population - Philippines (%)
Place of birth for the foreign-born population - Singapore (%)
Place of birth for the foreign-born population - Thailand (%)
Place of birth for the foreign-born population - Vietnam (%)
Place of birth for the foreign-born population - Other South Eastern Asia (%)
Place of birth for the foreign-born population - Armenia (%)
Place of birth for the foreign-born population - Iraq (%)
Place of birth for the foreign-born population - Israel (%)
Place of birth for the foreign-born population - Jordan (%)
Place of birth for the foreign-born population - Kuwait (%)
Place of birth for the foreign-born population - Lebanon (%)
Place of birth for the foreign-born population - Saudi Arabia (%)
Place of birth for the foreign-born population - Syria (%)
Place of birth for the foreign-born population - Turkey (%)
Place of birth for the foreign-born population - Yemen (%)
Place of birth for the foreign-born population - Other Western Asia (%)
Place of birth for the foreign-born population - Eritrea (%)
Place of birth for the foreign-born population - Ethiopia (%)
Place of birth for the foreign-born population - Kenya (%)
Place of birth for the foreign-born population - Somalia (%)
Place of birth for the foreign-born population - Uganda (%)
Place of birth for the foreign-born population - Zimbabwe (%)
Place of birth for the foreign-born population - Other Eastern Africa (%)
Place of birth for the foreign-born population - Cameroon (%)
Place of birth for the foreign-born population - Congo (%)
Place of birth for the foreign-born population - Democratic Republic of Congo (Zaire) (%)
Place of birth for the foreign-born population - Other Middle Africa (%)
Place of birth for the foreign-born population - Egypt (%)
Place of birth for the foreign-born population - Morocco (%)
Place of birth for the foreign-born population - Sudan (%)
Place of birth for the foreign-born population - Other Northern Africa (%)
Place of birth for the foreign-born population - South Africa (%)
Place of birth for the foreign-born population - Other Southern Africa (%)
Place of birth for the foreign-born population - Cabo Verde (%)
Place of birth for the foreign-born population - Ghana (%)
Place of birth for the foreign-born population - Liberia (%)
Place of birth for the foreign-born population - Nigeria (%)
Place of birth for the foreign-born population - Senegal (%)
Place of birth for the foreign-born population - Sierra Leone (%)
Place of birth for the foreign-born population - Other Western Africa (%)
Place of birth for the foreign-born population - Australia (%)
Place of birth for the foreign-born population - New Zealand (%)
Place of birth for the foreign-born population - Fiji (%)
Place of birth for the foreign-born population - Micronesia (%)
Place of birth for the foreign-born population - Bahamas (%)
Place of birth for the foreign-born population - Barbados (%)
Place of birth for the foreign-born population - Cuba (%)
Place of birth for the foreign-born population - Dominica (%)
Place of birth for the foreign-born population - Dominican Republic (%)
Place of birth for the foreign-born population - Grenada (%)
Place of birth for the foreign-born population - Haiti (%)
Place of birth for the foreign-born population - Jamaica (%)
Place of birth for the foreign-born population - St. Vincent and the Grenadines (%)
Place of birth for the foreign-born population - Trinidad and Tobago (%)
Place of birth for the foreign-born population - West Indies (%)
Place of birth for the foreign-born population - Other Caribbean (%)
Place of birth for the foreign-born population - Belize (%)
Place of birth for the foreign-born population - Costa Rica (%)
Place of birth for the foreign-born population - El Salvador (%)
Place of birth for the foreign-born population - Guatemala (%)
Place of birth for the foreign-born population - Honduras (%)
Place of birth for the foreign-born population - Mexico (%)
Place of birth for the foreign-born population - Nicaragua (%)
Place of birth for the foreign-born population - Panama (%)
Place of birth for the foreign-born population - Other Central America (%)
Place of birth for the foreign-born population - Argentina (%)
Place of birth for the foreign-born population - Bolivia (%)
Place of birth for the foreign-born population - Brazil (%)
Place of birth for the foreign-born population - Chile (%)
Place of birth for the foreign-born population - Colombia (%)
Place of birth for the foreign-born population - Ecuador (%)
Place of birth for the foreign-born population - Guyana (%)
Place of birth for the foreign-born population - Peru (%)
Place of birth for the foreign-born population - Uruguay (%)
Place of birth for the foreign-born population - Venezuela (%)
Place of birth for the foreign-born population - Other South America (%)
Place of birth for the foreign-born population - Canada (%)
Place of birth for the foreign-born population - Other Northern America (%)
Place of birth for the foreign-born population - Other (%)
Latest news about races in Cleveland, OH collected exclusively by city-data.com from local newspapers, TV, and radio stations
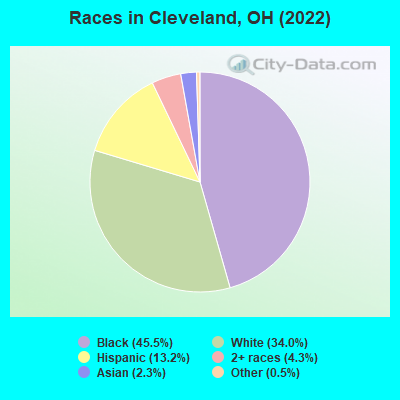
According to 2022 data, the most numerous races in Cleveland, OH are White alone (123,071 residents), Black alone (164,729 residents), and Two or more races (15,619 residents). 85.9% of Cleveland residents speak English at home. 6.2% of Cleveland, OH residents are foreign-born (2.4% born in Asia, 1.5% born in Latin America, 1.1% born in Europe, 0.7% born in Africa), which is 35.5% greater than the foreign-born rate of 4.0% across the entire state of Ohio.
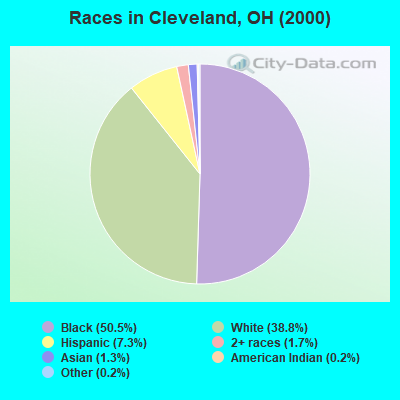
Race distribution in Cleveland
2000 2022
241,512 50.5% Black alone 185,641 38.8% White alone 34,728 7.3% Hispanic 8,093 1.7% Two or more races 6,284 1.3% Asian alone 827 0.2% Other race alone 1,195 0.2% American Indian alone 123 0.03% Native Hawaiian and Other
164,729 45.5% Black alone 123,071 34.0% White alone 47,730 13.2% Hispanic 15,619 4.3% Two or more races 8,263 2.3% Asian alone 1,958 0.5% Other race alone 146 0.04% American Indian alone 138 0.04% Native Hawaiian and Other
2000 2022
9,538,111 84.0% White alone 1,290,662 11.4% Black alone 217,123 1.9% Hispanic 137,770 1.2% Two or more races 131,670 1.2% Asian alone 21,985 0.2% American Indian alone 13,483 0.1% Other race alone 2,336 0.02% Native Hawaiian and Other
8,948,793 76.1% White alone 1,401,403 11.9% Black alone 529,291 4.5% Two or more races 517,232 4.4% Hispanic 293,387 2.5% Asian alone 52,805 0.4% Other race alone 9,785 0.08% American Indian alone 3,362 0.03% Native Hawaiian and Other
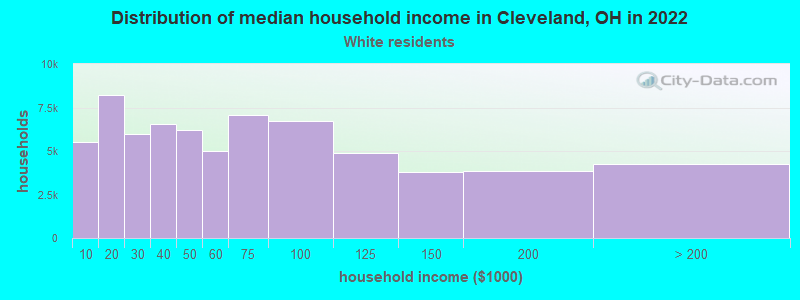
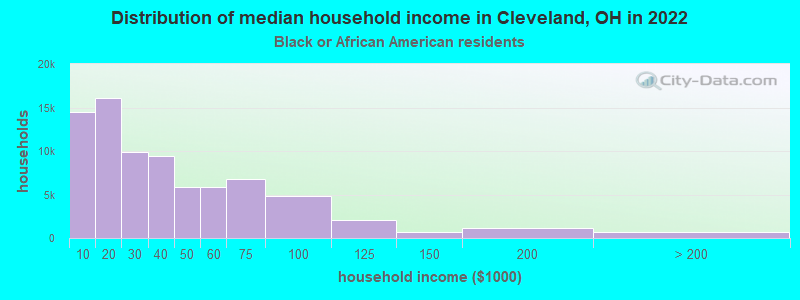
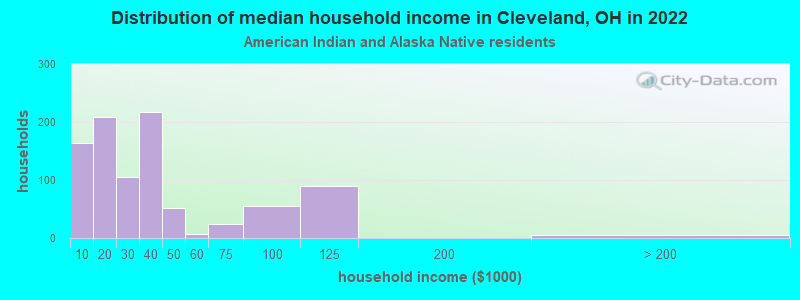
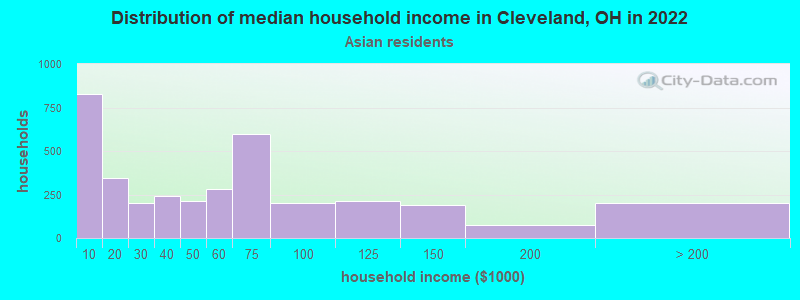
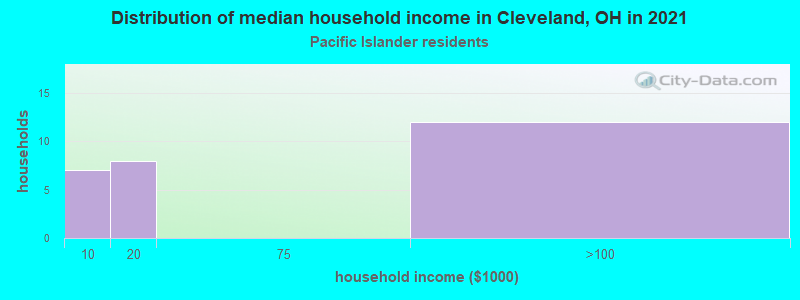
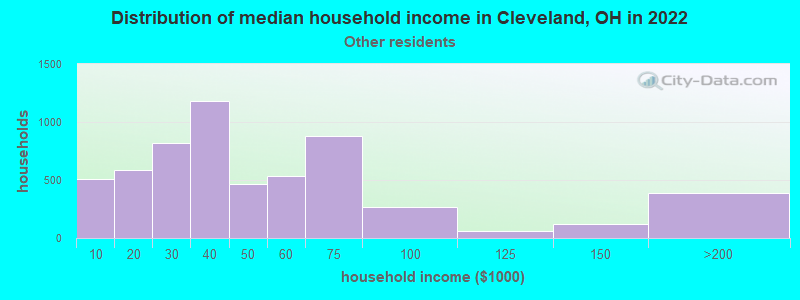
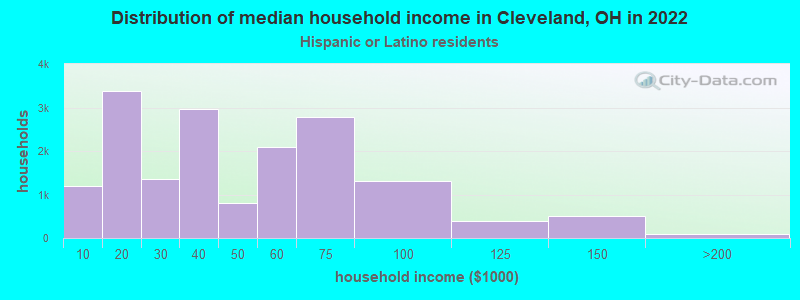
Income and house value in Cleveland Median household income in 2022 $53,676 White non-Hispanic householders$27,629 Black householders$28,701 American Indian and Alaska Native householders$45,120 Asian householders$38,095 Some other race householders$37,324 Two or more races householders$37,423 Hispanic or Latino race householdersMedian 2022 house value $112,591 White Non-Hispanic householders$94,715 Black or African American householders$97,310 American Indian or Alaska Native householders $131,620 Asian householders$105,671 Native Hawaiian and other Pacific Islander householders$101,202 Some other race householders$102,067 Two or more races householders$104,518 Hispanic or Latino householders
Median age by race in Cleveland
40.7 Median age for White residents39.9 41.5 36.9 Median age for Black or African American residents34.8 38.5 33.6 Median age for American Indian / Alaska Native residents61.9 33.4 31.4 Median age for Asian residents25.8 32.6 -666,666,666.0 Median age for Native Hawaiian / Pacific Islander residents-666,666,666.0 -666,666,666.0 37.8 Median age for Other race residents31.7 41.7 27.2 Median age for Two or more races residents26.0 28.1 41.4 Median age for White alone residents40.3 42.6 30.3 Median age for Hispanic or Latino residents30.2 30.3
Owner/renter occupied households by race in Cleveland
House owners and renters - White residents 33,677 49.4% Owner occupied34,435 50.6% Renter occupiedHouse owners and renters - Black or African American residents 26,963 34.7% Owner occupied50,830 65.3% Renter occupiedHouse owners and renters - American Indian / Alaska Native residents 151 19.6% Owner occupied619 80.4% Renter occupiedHouse owners and renters - Asian residents 1,255 34.9% Owner occupied2,345 65.1% Renter occupiedHouse owners and renters - Native Hawaiian / Pacific Islander residents 5 6.7% Owner occupied68 93.3% Renter occupiedHouse owners and renters - Other race residents 1,925 33.0% Owner occupied3,900 67.0% Renter occupiedHouse owners and renters - Two or more races residents 4,187 31.6% Owner occupied9,073 68.4% Renter occupiedHouse owners and renters - White alone residents 32,622 50.0% Owner occupied32,663 50.0% Renter occupiedHouse owners and renters - Hispanic or Latino residents 5,346 31.6% Owner occupied11,572 68.4% Renter occupied
Language usage in Cleveland
English speakers - Total 85.9% of residents of Cleveland speak English at home.
8.7% of residents speak Spanish at home 15,113 50.8% Speak English very well14,638 49.2% Speak English less than very well5.4% of residents speak other language at home 11,741 63.8% Speak English very well6,649 36.2% Speak English less than very well
English speakers - Born in the United States 91.3% of residents of Cleveland speak English at home.
5.2% of residents speak Spanish at home 2,691 80.6% Speak English very well649 19.4% Speak English less than very well3.5% of residents speak other language at home 1,816 80.2% Speak English very well449 19.8% Speak English less than very well
English speakers - Native, born elsewhere 17.6% of residents of Cleveland speak English at home.
82.1% of residents speak Spanish at home 4,651 37.0% Speak English very well7,907 63.0% Speak English less than very well0.3% of residents speak other language at home 3 5.7% Speak English very well50 94.3% Speak English less than very well
English speakers - Foreign-born 16.7% of residents of Cleveland speak English at home.
24.5% of residents speak Spanish at home 803 14.8% Speak English very well4,623 85.2% Speak English less than very well58.8% of residents speak other language at home 7,402 56.7% Speak English very well5,643 43.3% Speak English less than very well
White (Caucasian) - Speak only English Native:
95.8% (114,763)Foreign-born:
19.5% (1,194)
White (Caucasian) - Speak another language Native:
4.2% (4,983)Foreign-born:
80.5% (4,940)
Black or African American - Speak only English Native:
98.6% (148,836)Foreign-born:
20.5% (979)
Black or African American - Speak another language Native:
1.4% (2,140)Foreign-born:
79.5% (3,787)
American Indian / Alaska Native - Speak only English Native:
34.3% (453)Foreign-born:
2.3% (12)
American Indian / Alaska Native - Speak another language Native:
83.8% (1,107)Foreign-born:
94.7% (499)
Asian - Speak only English Native:
50.7% (1,368)Foreign-born:
20.2% (1,117)
Asian - Speak another language Native:
49.3% (1,332)Foreign-born:
79.8% (4,418)
Other race - Speak another language Native:
67.3% (9,392)Foreign-born:
100.0% (2,137)
Two or more races - Speak only English Native:
63.4% (19,278)Foreign-born:
10.9% (388)
Two or more races - Speak another language Native:
36.6% (11,109)Foreign-born:
89.1% (3,156)
White alone - Speak only English Native:
97.1% (110,205)Foreign-born:
20.0% (1,157)
White alone - Speak another language Native:
2.9% (3,251)Foreign-born:
80.0% (4,629)
Hispanic or Latino - Speak only English Native:
39.4% (15,017)Foreign-born:
6.1% (348)
Hispanic or Latino - Speak another language Native:
60.6% (23,100)Foreign-born:
93.9% (5,332)
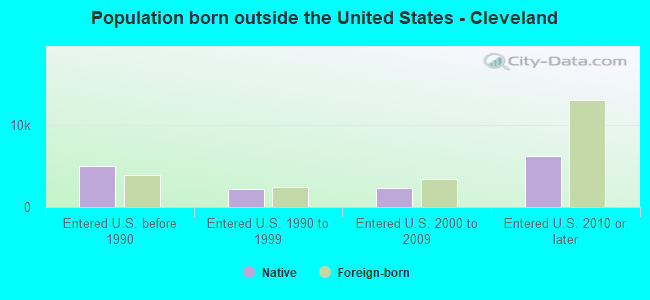
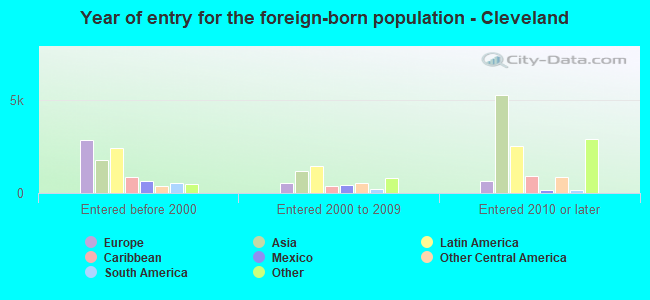
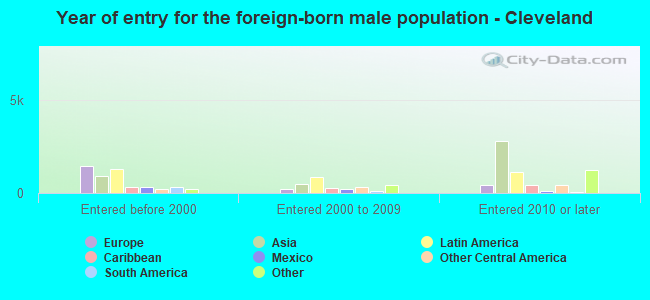
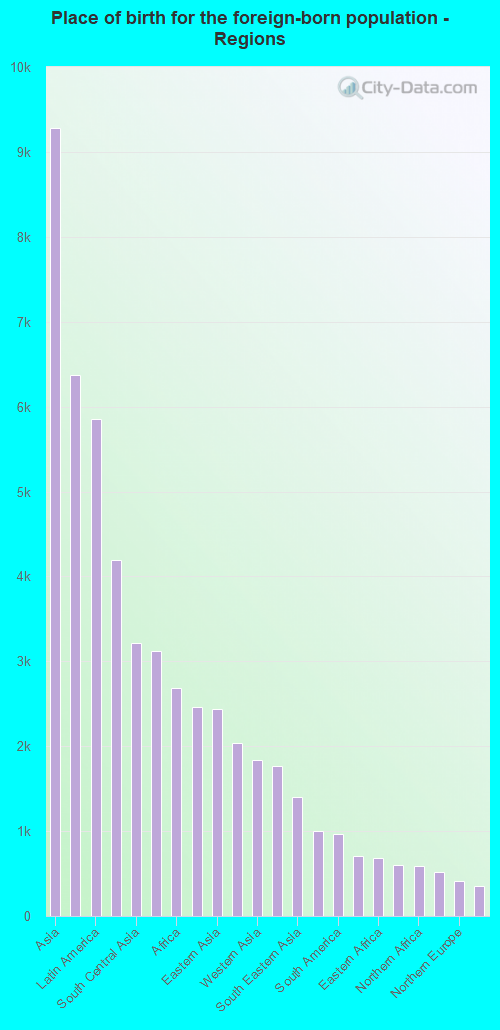
Foreign-born residents in Cleveland 22,576 residents are foreign born (2.4% Asia , 1.5% Latin America , 1.1% Europe , 0.7% Africa ).
Marital status for residents in Cleveland Marital status - White (Caucasian) population 15 years and over
Males 53.4% Never married30.7% Now married2.2% Separated3.1% Widowed10.7% DivorcedFemales 47.0% Never married32.1% Now married1.1% Separated9.4% Widowed10.4% DivorcedWomen who gave birth in the past 12 months Now married:
81.7% (411)Unmarried:
18.3% (92)
Women who did not give birth in the past 12 months Now married:
27.4% (8,143)Unmarried:
72.6% (21,546)
Marital status - Black or African American population 15 years and over
Males 56.9% Never married21.5% Now married5.3% Separated3.2% Widowed13.2% DivorcedFemales 54.3% Never married16.8% Now married3.1% Separated12.0% Widowed13.8% DivorcedWomen who gave birth in the past 12 months Now married:
14.6% (394)Unmarried:
85.4% (2,302)
Women who did not give birth in the past 12 months Now married:
14.9% (5,425)Unmarried:
85.1% (31,057)
Marital status - American Indian / Alaska Native population 15 years and over
Males 52.4% Never married33.5% Now married0.5% Separated2.5% Widowed11.2% DivorcedFemales 45.9% Never married30.9% Now married2.0% Separated8.0% Widowed13.2% DivorcedWomen who gave birth in the past 12 months Now married:
0.0% (0)Unmarried:
100.0% (18)
Women who did not give birth in the past 12 months Now married:
21.6% (87)Unmarried:
78.4% (314)
Marital status - Asian population 15 years and over
Males 56.3% Never married39.4% Now married0.7% Separated0.3% Widowed3.3% DivorcedFemales 44.4% Never married44.2% Now married1.6% Separated5.1% Widowed4.7% DivorcedWomen who gave birth in the past 12 months Now married:
100.0% (85)Unmarried:
0.0% (0)
Women who did not give birth in the past 12 months Now married:
26.9% (664)Unmarried:
73.1% (1,804)
Marital status - Native Hawaiian / Pacific Islander population 15 years and over
Males 16.1% Never married83.9% Now married0.0% Separated0.0% Widowed0.0% DivorcedFemales 14.8% Never married57.4% Now married0.0% Separated0.0% Widowed27.9% DivorcedWomen who did not give birth in the past 12 months Now married:
75.0% (28)Unmarried:
25.0% (9)
Marital status - Other race population 15 years and over
Males 58.7% Never married30.5% Now married2.6% Separated0.8% Widowed7.4% DivorcedFemales 39.8% Never married34.7% Now married3.5% Separated9.8% Widowed12.3% DivorcedWomen who gave birth in the past 12 months Now married:
100.0% (200)Unmarried:
0.0% (0)
Women who did not give birth in the past 12 months Now married:
40.6% (1,858)Unmarried:
59.4% (2,720)
Marital status - Two or more races population 15 years and over
Males 73.4% Never married15.0% Now married1.2% Separated1.6% Widowed8.8% DivorcedFemales 54.9% Never married14.2% Now married8.6% Separated3.3% Widowed18.9% DivorcedWomen who gave birth in the past 12 months Now married:
30.5% (76)Unmarried:
69.5% (173)
Women who did not give birth in the past 12 months Now married:
22.3% (2,057)Unmarried:
77.7% (7,160)
Marital status - White alone, not Hispanic / Latino population 15 years and over
Males 52.8% Never married31.8% Now married1.6% Separated2.9% Widowed10.9% DivorcedFemales 46.2% Never married32.9% Now married1.0% Separated9.3% Widowed10.5% DivorcedWomen who gave birth in the past 12 months Now married:
89.8% (360)Unmarried:
10.2% (41)
Women who did not give birth in the past 12 months Now married:
28.5% (8,023)Unmarried:
71.5% (20,139)
Marital status - Hispanic or Latino population 15 years and over
Males 62.1% Never married20.8% Now married5.8% Separated2.2% Widowed9.1% DivorcedFemales 51.6% Never married18.6% Now married7.2% Separated5.0% Widowed17.5% DivorcedWomen who gave birth in the past 12 months Now married:
72.9% (398)Unmarried:
27.1% (148)
Women who did not give birth in the past 12 months Now married:
23.6% (2,942)Unmarried:
76.4% (9,512)
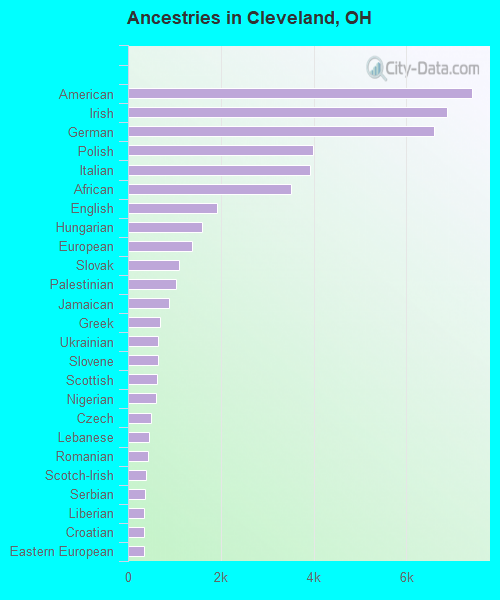
Ancestries in Cleveland
7,409 3.4% American6,876 3.2% Irish6,595 3.1% German3,988 1.9% Polish3,921 1.8% Italian3,509 1.6% African1,910 0.9% English1,590 0.7% Hungarian1,389 0.6% European1,101 0.5% Slovak1,041 0.5% Palestinian887 0.4% Jamaican693 0.3% Greek651 0.3% Ukrainian649 0.3% Slovene630 0.3% Scottish597 0.3% Nigerian496 0.2% Czech455 0.2% Lebanese433 0.2% Romanian394 0.2% Scotch-Irish371 0.2% Serbian355 0.2% Liberian340 0.2% Croatian336 0.2% Eastern European325 0.2% Russian322 0.1% Syrian284 0.1% British273 0.1% Arab245 0.1% Ghanaian219 0.1% Welsh213 0.10% Somali200 0.09% Lithuanian195 0.09% Moroccan190 0.09% Trinidadian and Tobagonian181 0.08% Yugoslavian177 0.08% Iranian158 0.07% Sudanese157 0.07% French144 0.07% Swedish141 0.07% Haitian130 0.06% Dutch129 0.06% Afghan128 0.06% Albanian127 0.06% Swiss113 0.05% Egyptian103 0.05% Jordanian102 0.05% Israeli99 0.05% Austrian91 0.04% Iraqi87 0.04% Finnish83 0.04% Czechoslovakian80 0.04% Northern European80 0.04% Ethiopian78 0.04% French Canadian65 0.03% Guyanese65 0.03% Canadian62 0.03% Zimbabwean61 0.03% Icelander56 0.03% Norwegian56 0.03% Armenian54 0.03% Belizean50 0.02% Bulgarian49 0.02% Portuguese48 0.02% Scandinavian47 0.02% West Indian35 0.02% Barbadian28 0.01% South African25 0.01% Latvian24 0.01% Turkish18 0.01% Belgian18 0.01% Celtic15 0.01% Pennsylvania German15 0.01% Slavic12 0.01% Brazilian
Geographical mobility in Cleveland Same house 1 year ago 103,593 79.8% White (Caucasian)139,280 84.6% Black or African American1,541 80.3% American Indian / Alaska Native6,182 75.1% Asian163 100.0% Native Hawaiian / Pacific Islander12,008 71.0% Other race28,431 76.5% Two or more races97,577 79.6% White alone, not Hispanic / Latino34,425 72.7% Hispanic or LatinoMoved within same county 16,074 12.4% White / Caucasian19,609 11.9% Black or African American229 11.9% American Indian / Alaska Native766 9.3% Asian3,460 20.5% Other race4,774 12.9% Two or more races15,488 12.6% White alone, not Hispanic / Latino8,401 17.7% Hispanic or LatinoMoved within same state 5,381 4.1% White / Caucasian821 0.5% Black or African American13 0.7% American Indian / Alaska Native147 1.8% Asian59 0.3% Other race1,090 2.9% Two or more races5,053 4.1% White alone, not Hispanic / Latino615 1.3% Hispanic or LatinoMoved from different state 4,341 3.3% White / Caucasian4,191 2.5% Black or African American59 3.1% American Indian / Alaska Native570 6.9% Asian884 5.2% Other race2,082 5.6% Two or more races4,176 3.4% White alone, not Hispanic / Latino2,861 6.0% Hispanic or LatinoMoved from abroad 360 0.3% White719 0.4% Black or African American6 0.3% American Indian / Alaska Native570 6.9% Asian498 2.9% Other race766 2.1% Two or more races311 0.3% White alone, not Hispanic / Latino1,075 2.3% Hispanic or Latino
Children Nativity (place of birth) in Cleveland
Children under 6 years - Living with two parents Both parents native 4,355 100.0% NativeBoth parents foreign-born 398 58.7% Native280 41.3% Foreign-bornOne native, one foreign-born parent 45 100.0% NativeChildren under 6 years - Living with one parent Native parent 18,107 100.0% NativeForeign-born parent 763 79.3% Native199 20.7% Foreign-bornChildren 6 to 17 years - Living with two parents Both parents native 7,577 100.0% NativeBoth parents foreign-born 396 47.0% Native447 53.0% Foreign-bornOne native, one foreign-born parent 163 100.0% NativeChildren 6 to 17 years - Living with one parent Native parent 33,112 100.0% NativeForeign-born parent 2,410 62.8% Native1,430 37.2% Foreign-born
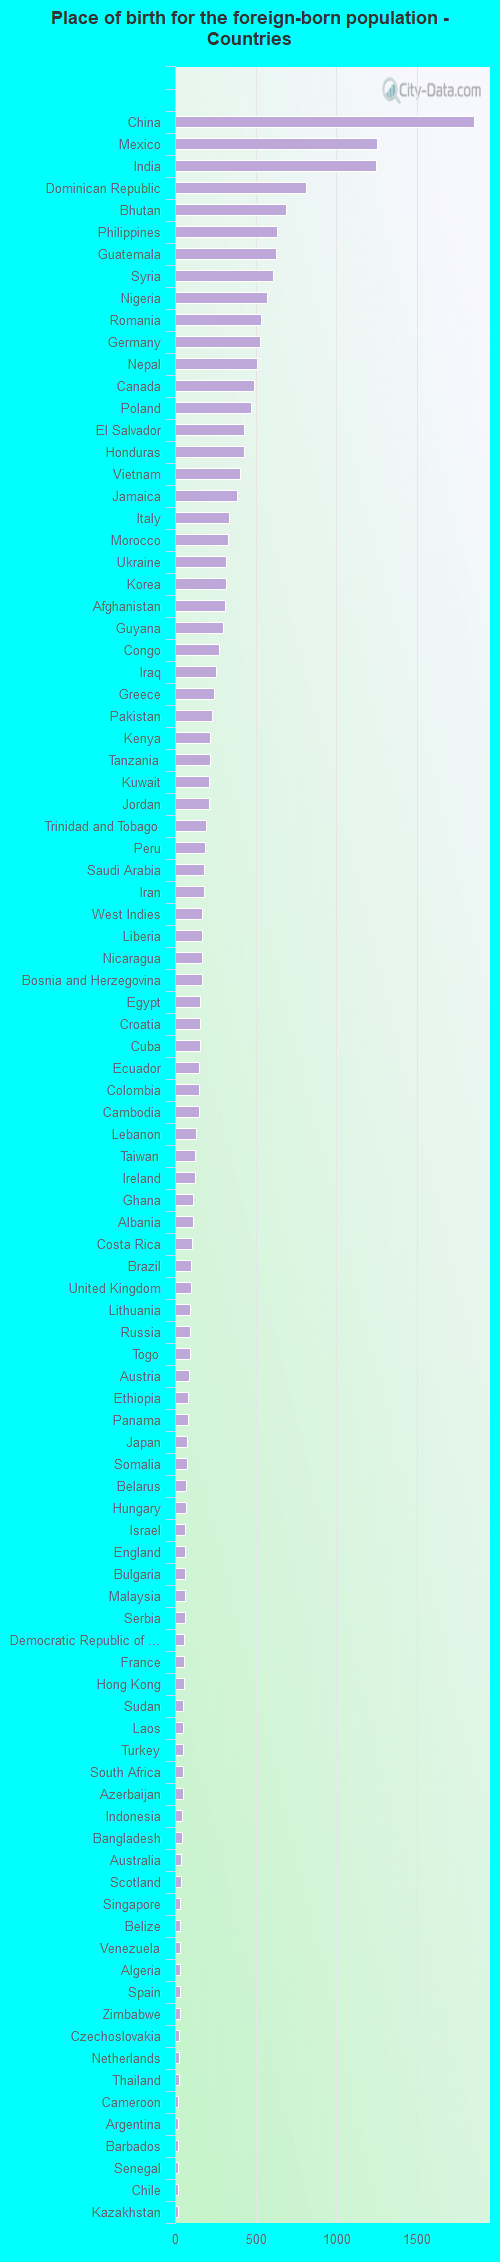
Place of birth for residents in Cleveland 9,280 Asia6,375 Americas5,852 Latin America4,192 Europe3,218 South Central Asia3,118 Central America2,687 Africa2,467 Eastern Europe2,439 Eastern Asia2,033 China1,837 Western Asia1,769 Caribbean1,402 South Eastern Asia1,004 Western Africa964 South America703 Western Europe682 Eastern Africa605 Southern Europe594 Northern Africa523 Northern America416 Northern Europe355 Middle Africa50 Southern Africa39 Oceania39 Australia and New Zealand Subregion1,854 China1,251 Mexico1,245 India812 Dominican Republic690 Bhutan632 Philippines628 Guatemala606 Syria568 Nigeria531 Romania530 Germany507 Nepal487 Canada469 Poland426 El Salvador425 Honduras402 Vietnam385 Jamaica332 Italy327 Morocco319 Ukraine319 Korea307 Afghanistan298 Guyana275 Congo256 Iraq243 Greece229 Pakistan220 Kenya217 Tanzania211 Kuwait210 Jordan195 Trinidad and Tobago188 Peru179 Saudi Arabia177 Iran170 West Indies166 Liberia165 Nicaragua165 Bosnia and Herzegovina158 Egypt157 Croatia155 Cuba150 Ecuador150 Colombia149 Cambodia129 Lebanon122 Taiwan121 Ireland111 Ghana110 Albania107 Costa Rica100 Brazil99 United Kingdom94 Lithuania93 Russia91 Togo86 Austria81 Ethiopia80 Panama74 Japan72 Somalia69 Belarus66 Hungary65 Israel62 England60 Bulgaria59 Malaysia59 Serbia58 Democratic Republic of Congo (Zaire)57 France56 Hong Kong52 Sudan52 Laos52 Turkey50 South Africa48 Azerbaijan41 Indonesia41 Bangladesh39 Australia38 Scotland31 Singapore31 Belize29 Venezuela28 Algeria28 Spain28 Zimbabwe26 Czechoslovakia23 Netherlands22 Thailand21 Cameroon20 Argentina19 Barbados19 Senegal19 Chile19 Kazakhstan13 Sierra Leone11 Sweden10 Burma (Myanmar)9 Haiti7 Norway6 Belgium6 Uruguay5 Cabo Verde4 United Arab Emirates2 Uganda
Grandparents responsible for own grandchildren in Cleveland
Grandparents (30 to 59 years) White / Caucasian 221 22.4% Responsible for grandchildren767 77.6% Not responsible for grandchildrenBlack or African American 698 43.2% Responsible for grandchildren918 56.8% Not responsible for grandchildrenAmerican Indian / Alaska Native 38 100.0% Responsible for grandchildrenAsian 68 37.5% Responsible for grandchildren114 62.5% Not responsible for grandchildrenOther race 163 30.4% Responsible for grandchildren373 69.6% Not responsible for grandchildrenTwo or more races 219 45.8% Responsible for grandchildren259 54.2% Not responsible for grandchildrenWhite alone, not Hispanic / Latino 221 25.9% Responsible for grandchildren632 74.1% Not responsible for grandchildrenHispanic or Latino 376 28.6% Responsible for grandchildren937 71.4% Not responsible for grandchildrenGrandparents (60 years and over) White / Caucasian 1,039 44.9% Responsible for grandchildren1,276 55.1% Not responsible for grandchildrenBlack or African American 743 37.9% Responsible for grandchildren1,215 62.1% Not responsible for grandchildrenAmerican Indian / Alaska Native 84 100.0% Not responsible for grandchildrenAsian 79 38.4% Responsible for grandchildren127 61.6% Not responsible for grandchildrenOther race 17 9.5% Responsible for grandchildren165 90.5% Not responsible for grandchildrenTwo or more races 200 48.8% Responsible for grandchildren210 51.2% Not responsible for grandchildrenWhite alone, not Hispanic / Latino 1,039 44.9% Responsible for grandchildren1,276 55.1% Not responsible for grandchildrenHispanic or Latino 195 31.6% Responsible for grandchildren422 68.4% Not responsible for grandchildren
Zip codes: 44101 , 44103 , 44104 , 44105 , 44106 , 44107 , 44111 , 44112 , 44113 , 44114 , 44115 , 44117 , 44119 , 44120 , 44121 , 44125 , 44127 , 44134 .