Races in Clemson, South Carolina (SC) Detailed Stats Ancestries, Foreign-born residents, place of birth
Data:
Races - White alone (%)
Races - White alone (% change since 2000)
Races - Black alone (%)
Races - Black alone (% change since 2000)
Races - American Indian alone (%)
Races - American Indian alone (% change since 2000)
Races - Asian alone (%)
Races - Asian alone (% change since 2000)
Races - Hispanic (%)
Races - Hispanic (% change since 2000)
Races - Native Hawaiian and Other Pacific Islander alone (%)
Races - Native Hawaiian and Other Pacific Islander alone (% change since 2000)
Races - Two or more races(%)
Races - Two or more races(% change since 2000)
Races - Other race alone (%)
Races - Other race alone (% change since 2000)
Racial diversity
Place of birth - Born in state of residence (%)
Place of birth - Born in state of residence (%) - White
Place of birth - Born in state of residence (%) - Black or African American
Place of birth - Born in state of residence (%) - Asian
Place of birth - Born in state of residence (%) - Hispanic or Latino
Place of birth - Born in state of residence (%) - American Indian and Alaska Native
Place of birth - Born in state of residence (%) - Multirace
Place of birth - Born in state of residence (%) - Other Race
Place of birth - Born in other state (%)
Place of birth - Born in other state (%) - White
Place of birth - Born in other state (%) - Black or African American
Place of birth - Born in other state (%) - Asian
Place of birth - Born in other state (%) - Hispanic or Latino
Place of birth - Born in other state (%) - American Indian and Alaska Native
Place of birth - Born in other state (%) - Multirace
Place of birth - Born in other state (%) - Other Race
Place of birth - Native, outside of US (%)
Place of birth - Native, outside of US (%) - White
Place of birth - Native, outside of US (%) - Black or African American
Place of birth - Native, outside of US (%) - Asian
Place of birth - Native, outside of US (%) - Hispanic or Latino
Place of birth - Native, outside of US (%) - American Indian and Alaska Native
Place of birth - Native, outside of US (%) - Multirace
Place of birth - Native, outside of US (%) - Other Race
Place of birth - Foreign born (%)
Place of birth - Foreign born (%) - White
Place of birth - Foreign born (%) - Black or African American
Place of birth - Foreign born (%) - Asian
Place of birth - Foreign born (%) - Hispanic or Latino
Place of birth - Foreign born (%) - American Indian and Alaska Native
Place of birth - Foreign born (%) - Multirace
Place of birth - Foreign born (%) - Other Race
Residents speaking English at home (%)
Residents speaking English at home - Born in the United States (%)
Residents speaking English at home - Native, born elsewhere (%)
Residents speaking English at home - Foreign born (%)
Residents speaking Spanish at home (%)
Residents speaking Spanish at home - Born in the United States (%)
Residents speaking Spanish at home - Native, born elsewhere (%)
Residents speaking Spanish at home - Foreign born (%)
Residents speaking other language at home (%)
Residents speaking other language at home - Born in the United States (%)
Residents speaking other language at home - Native, born elsewhere (%)
Residents speaking other language at home - Foreign born (%)
Marital status - Never married (%)
Marital status - Now married (%)
Marital status - Separated (%)
Marital status - Widowed (%)
Marital status - Divorced (%)
Ancestries Reported - Arab (%)
Ancestries Reported - Czech (%)
Ancestries Reported - Danish (%)
Ancestries Reported - Dutch (%)
Ancestries Reported - English (%)
Ancestries Reported - French (%)
Ancestries Reported - French Canadian (%)
Ancestries Reported - German (%)
Ancestries Reported - Greek (%)
Ancestries Reported - Hungarian (%)
Ancestries Reported - Irish (%)
Ancestries Reported - Italian (%)
Ancestries Reported - Lithuanian (%)
Ancestries Reported - Norwegian (%)
Ancestries Reported - Polish (%)
Ancestries Reported - Portuguese (%)
Ancestries Reported - Russian (%)
Ancestries Reported - Scotch-Irish (%)
Ancestries Reported - Scottish (%)
Ancestries Reported - Slovak (%)
Ancestries Reported - Subsaharan African (%)
Ancestries Reported - Swedish (%)
Ancestries Reported - Swiss (%)
Ancestries Reported - Ukrainian (%)
Ancestries Reported - United States (%)
Ancestries Reported - Welsh (%)
Ancestries Reported - West Indian (%)
Ancestries Reported - Other (%)
Geographical mobility - Same house 1 year ago (%)
Geographical mobility - Same house 1 year ago (%) - White
Geographical mobility - Same house 1 year ago (%) - Black or African American
Geographical mobility - Same house 1 year ago (%) - Asian
Geographical mobility - Same house 1 year ago (%) - Hispanic or Latino
Geographical mobility - Same house 1 year ago (%) - American Indian and Alaska Native
Geographical mobility - Same house 1 year ago (%) - Multirace
Geographical mobility - Same house 1 year ago (%) - Other Race
Geographical mobility - Moved within same county (%)
Geographical mobility - Moved within same county (%) - White
Geographical mobility - Moved within same county (%) - Black or African American
Geographical mobility - Moved within same county (%) - Asian
Geographical mobility - Moved within same county (%) - Hispanic or Latino
Geographical mobility - Moved within same county (%) - American Indian and Alaska Native
Geographical mobility - Moved within same county (%) - Multirace
Geographical mobility - Moved within same county (%) - Other Race
Geographical mobility - Moved from different county within same state (%)
Geographical mobility - Moved from different county within same state (%) - White
Geographical mobility - Moved from different county within same state (%) - Black or African American
Geographical mobility - Moved from different county within same state (%) - Asian
Geographical mobility - Moved from different county within same state (%) - Hispanic or Latino
Geographical mobility - Moved from different county within same state (%) - American Indian and Alaska Native
Geographical mobility - Moved from different county within same state (%) - Multirace
Geographical mobility - Moved from different county within same state (%) - Other Race
Geographical mobility - Moved from different state (%)
Geographical mobility - Moved from different state (%) - White
Geographical mobility - Moved from different state (%) - Black or African American
Geographical mobility - Moved from different state (%) - Asian
Geographical mobility - Moved from different state (%) - Hispanic or Latino
Geographical mobility - Moved from different state (%) - American Indian and Alaska Native
Geographical mobility - Moved from different state (%) - Multirace
Geographical mobility - Moved from different state (%) - Other Race
Geographical mobility - Moved from abroad (%)
Geographical mobility - Moved from abroad (%) - White
Geographical mobility - Moved from abroad (%) - Black or African American
Geographical mobility - Moved from abroad (%) - Asian
Geographical mobility - Moved from abroad (%) - Hispanic or Latino
Geographical mobility - Moved from abroad (%) - American Indian and Alaska Native
Geographical mobility - Moved from abroad (%) - Multirace
Geographical mobility - Moved from abroad (%) - Other Race
Place of birth for the foreign-born population - Ireland (%)
Place of birth for the foreign-born population - Denmark (%)
Place of birth for the foreign-born population - Norway (%)
Place of birth for the foreign-born population - Sweden (%)
Place of birth for the foreign-born population - United Kingdom (%)
Place of birth for the foreign-born population - England (%)
Place of birth for the foreign-born population - Scotland (%)
Place of birth for the foreign-born population - Other Northern Europe (%)
Place of birth for the foreign-born population - Austria (%)
Place of birth for the foreign-born population - Belgium (%)
Place of birth for the foreign-born population - France (%)
Place of birth for the foreign-born population - Germany (%)
Place of birth for the foreign-born population - Netherlands (%)
Place of birth for the foreign-born population - Switzerland (%)
Place of birth for the foreign-born population - Other Western Europe (%)
Place of birth for the foreign-born population - Greece (%)
Place of birth for the foreign-born population - Italy (%)
Place of birth for the foreign-born population - Portugal (%)
Place of birth for the foreign-born population - Spain (%)
Place of birth for the foreign-born population - Other Southern Europe (%)
Place of birth for the foreign-born population - Albania (%)
Place of birth for the foreign-born population - Belarus (%)
Place of birth for the foreign-born population - Bosnia and Herzegovina (%)
Place of birth for the foreign-born population - Bulgaria (%)
Place of birth for the foreign-born population - Croatia (%)
Place of birth for the foreign-born population - Czechoslovakia (%)
Place of birth for the foreign-born population - Hungary (%)
Place of birth for the foreign-born population - Latvia (%)
Place of birth for the foreign-born population - Lithuania (%)
Place of birth for the foreign-born population - North Macedonia (Macedonia) (%)
Place of birth for the foreign-born population - Moldova (%)
Place of birth for the foreign-born population - Poland (%)
Place of birth for the foreign-born population - Romania (%)
Place of birth for the foreign-born population - Russia (%)
Place of birth for the foreign-born population - Serbia (%)
Place of birth for the foreign-born population - Ukraine (%)
Place of birth for the foreign-born population - Other Eastern Europe (%)
Place of birth for the foreign-born population - China (%)
Place of birth for the foreign-born population - Hong Kong (%)
Place of birth for the foreign-born population - Taiwan (%)
Place of birth for the foreign-born population - Japan (%)
Place of birth for the foreign-born population - Korea (%)
Place of birth for the foreign-born population - Other Eastern Asia (%)
Place of birth for the foreign-born population - Afghanistan (%)
Place of birth for the foreign-born population - Bangladesh (%)
Place of birth for the foreign-born population - India (%)
Place of birth for the foreign-born population - Iran (%)
Place of birth for the foreign-born population - Kazakhstan (%)
Place of birth for the foreign-born population - Nepal (%)
Place of birth for the foreign-born population - Pakistan (%)
Place of birth for the foreign-born population - Sri Lanka (%)
Place of birth for the foreign-born population - Uzbekistan (%)
Place of birth for the foreign-born population - Other South Central Asia (%)
Place of birth for the foreign-born population - Burma (%)
Place of birth for the foreign-born population - Cambodia (%)
Place of birth for the foreign-born population - Indonesia (%)
Place of birth for the foreign-born population - Laos (%)
Place of birth for the foreign-born population - Malaysia (%)
Place of birth for the foreign-born population - Philippines (%)
Place of birth for the foreign-born population - Singapore (%)
Place of birth for the foreign-born population - Thailand (%)
Place of birth for the foreign-born population - Vietnam (%)
Place of birth for the foreign-born population - Other South Eastern Asia (%)
Place of birth for the foreign-born population - Armenia (%)
Place of birth for the foreign-born population - Iraq (%)
Place of birth for the foreign-born population - Israel (%)
Place of birth for the foreign-born population - Jordan (%)
Place of birth for the foreign-born population - Kuwait (%)
Place of birth for the foreign-born population - Lebanon (%)
Place of birth for the foreign-born population - Saudi Arabia (%)
Place of birth for the foreign-born population - Syria (%)
Place of birth for the foreign-born population - Turkey (%)
Place of birth for the foreign-born population - Yemen (%)
Place of birth for the foreign-born population - Other Western Asia (%)
Place of birth for the foreign-born population - Eritrea (%)
Place of birth for the foreign-born population - Ethiopia (%)
Place of birth for the foreign-born population - Kenya (%)
Place of birth for the foreign-born population - Somalia (%)
Place of birth for the foreign-born population - Uganda (%)
Place of birth for the foreign-born population - Zimbabwe (%)
Place of birth for the foreign-born population - Other Eastern Africa (%)
Place of birth for the foreign-born population - Cameroon (%)
Place of birth for the foreign-born population - Congo (%)
Place of birth for the foreign-born population - Democratic Republic of Congo (Zaire) (%)
Place of birth for the foreign-born population - Other Middle Africa (%)
Place of birth for the foreign-born population - Egypt (%)
Place of birth for the foreign-born population - Morocco (%)
Place of birth for the foreign-born population - Sudan (%)
Place of birth for the foreign-born population - Other Northern Africa (%)
Place of birth for the foreign-born population - South Africa (%)
Place of birth for the foreign-born population - Other Southern Africa (%)
Place of birth for the foreign-born population - Cabo Verde (%)
Place of birth for the foreign-born population - Ghana (%)
Place of birth for the foreign-born population - Liberia (%)
Place of birth for the foreign-born population - Nigeria (%)
Place of birth for the foreign-born population - Senegal (%)
Place of birth for the foreign-born population - Sierra Leone (%)
Place of birth for the foreign-born population - Other Western Africa (%)
Place of birth for the foreign-born population - Australia (%)
Place of birth for the foreign-born population - New Zealand (%)
Place of birth for the foreign-born population - Fiji (%)
Place of birth for the foreign-born population - Micronesia (%)
Place of birth for the foreign-born population - Bahamas (%)
Place of birth for the foreign-born population - Barbados (%)
Place of birth for the foreign-born population - Cuba (%)
Place of birth for the foreign-born population - Dominica (%)
Place of birth for the foreign-born population - Dominican Republic (%)
Place of birth for the foreign-born population - Grenada (%)
Place of birth for the foreign-born population - Haiti (%)
Place of birth for the foreign-born population - Jamaica (%)
Place of birth for the foreign-born population - St. Vincent and the Grenadines (%)
Place of birth for the foreign-born population - Trinidad and Tobago (%)
Place of birth for the foreign-born population - West Indies (%)
Place of birth for the foreign-born population - Other Caribbean (%)
Place of birth for the foreign-born population - Belize (%)
Place of birth for the foreign-born population - Costa Rica (%)
Place of birth for the foreign-born population - El Salvador (%)
Place of birth for the foreign-born population - Guatemala (%)
Place of birth for the foreign-born population - Honduras (%)
Place of birth for the foreign-born population - Mexico (%)
Place of birth for the foreign-born population - Nicaragua (%)
Place of birth for the foreign-born population - Panama (%)
Place of birth for the foreign-born population - Other Central America (%)
Place of birth for the foreign-born population - Argentina (%)
Place of birth for the foreign-born population - Bolivia (%)
Place of birth for the foreign-born population - Brazil (%)
Place of birth for the foreign-born population - Chile (%)
Place of birth for the foreign-born population - Colombia (%)
Place of birth for the foreign-born population - Ecuador (%)
Place of birth for the foreign-born population - Guyana (%)
Place of birth for the foreign-born population - Peru (%)
Place of birth for the foreign-born population - Uruguay (%)
Place of birth for the foreign-born population - Venezuela (%)
Place of birth for the foreign-born population - Other South America (%)
Place of birth for the foreign-born population - Canada (%)
Place of birth for the foreign-born population - Other Northern America (%)
Place of birth for the foreign-born population - Other (%)
Latest news about races in Clemson, SC collected exclusively by city-data.com from local newspapers, TV, and radio stations
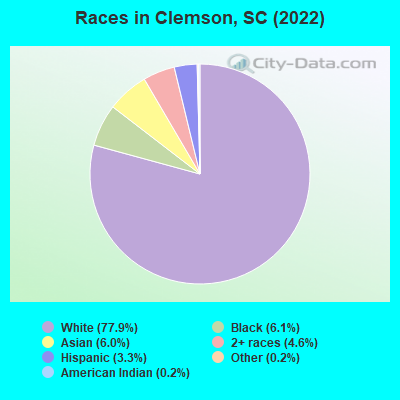
According to 2022 data, the most numerous races in Clemson, SC are White alone (13,925 residents), Black alone (1,099 residents), and Hispanic (588 residents). 90.1% of Clemson residents speak English at home. 7.7% of Clemson, SC residents are foreign-born (5.9% born in Asia, 1.0% born in Europe), which is 35.1% greater than the foreign-born rate of 5.0% across the entire state of South Carolina.
Race distribution in Clemson
2000
2022
2,652,291 66.1% White alone
1,178,486 29.4% Black alone
95,076 2.4% Hispanic
35,568 0.9% Asian alone
33,290 0.8% Two or more races
12,765 0.3% American Indian alone
3,266 0.08% Other race alone
1,270 0.03% Native Hawaiian and Other Pacific Islander alone
3,301,739 62.5% White alone
1,313,290 24.9% Black alone
343,783 6.5% Hispanic
190,508 3.6% Two or more races
89,888 1.7% Asian alone
29,390 0.6% Other race alone
12,112 0.2% American Indian alone
1,924 0.04% Native Hawaiian and Other Pacific Islander alone
Income and house value in Clemson Median household income in 2022 $50,319 White non-Hispanic householders
$42,325 American Indian and Alaska Native householders
$46,778 Asian householders
$57,821 Some other race householders
$27,584 Hispanic or Latino race householders
Median 2022 house value $432,751 White Non-Hispanic householders
$215,595 Black or African American householders
$362,862 Asian householders
$452,407 Two or more races householders
$171,602 Hispanic or Latino householders
Median age by race in Clemson
24.5 Median age for White residents23.2 Males28.2 Females26.4 Median age for Black or African American residents24.1 Males31.8 Females53.0 Median age for American Indian / Alaska Native residents49.5 Males-659,400,544.3 Females23.8 Median age for Asian residents21.9 Males24.4 Females-698,412,697.7 Median age for Native Hawaiian / Pacific Islander residents-666,666,666.0 Males-1,016,109,044.8 Females25.4 Median age for Other race residents30.4 Males-553,763,440.3 Females23.9 Median age for Two or more races residents22.2 Males32.2 Females24.5 Median age for White alone residents22.9 Males28.1 Females23.6 Median age for Hispanic or Latino residents25.6 Males24.7 Females
Owner/renter occupied households by race in Clemson
House owners and renters - White residents 2,419 36.4% Owner occupied4,229 63.6% Renter occupiedHouse owners and renters - Black or African American residents 134 33.7% Owner occupied264 66.3% Renter occupiedHouse owners and renters - American Indian / Alaska Native residents 11 52.8% Owner occupied10 47.2% Renter occupiedHouse owners and renters - Asian residents 56 15.1% Owner occupied313 84.9% Renter occupiedHouse owners and renters - Other race residents 10 11.0% Owner occupied84 89.0% Renter occupiedHouse owners and renters - Two or more races residents 64 31.3% Owner occupied140 68.7% Renter occupiedHouse owners and renters - White alone residents 2,404 37.3% Owner occupied4,045 62.7% Renter occupiedHouse owners and renters - Hispanic or Latino residents 28 7.1% Owner occupied369 92.9% Renter occupied
Language usage in Clemson
English speakers - Total 90.1% of residents of Clemson speak English at home.
0.9% of residents speak Spanish at home 75 48.1% Speak English very well81 51.9% Speak English less than very well9.5% of residents speak other language at home 1,372 81.1% Speak English very well320 18.9% Speak English less than very well
English speakers - Born in the United States 98.0% of residents of Clemson speak English at home.
0.3% of residents speak Spanish at home 26 100.0% Speak English very well2.2% of residents speak other language at home 176 91.7% Speak English very well16 8.3% Speak English less than very well
English speakers - Native, born elsewhere 53.2% of residents of Clemson speak English at home.
73.0% of residents speak other language at home 81 100.0% Speak English very well
English speakers - Foreign-born 10.0% of residents of Clemson speak English at home.
6.5% of residents speak Spanish at home 15 14.9% Speak English very well86 85.1% Speak English less than very well75.0% of residents speak other language at home 960 82.4% Speak English very well205 17.6% Speak English less than very well
White (Caucasian) - Speak only English Native:
98.8% (13,526)Foreign-born:
43.2% (146)
White (Caucasian) - Speak another language Native:
1.2% (160)Foreign-born:
57.1% (193)
Black or African American - Speak only English Native:
99.6% (1,465)Foreign-born:
68.5% (22)
Asian - Speak only English Native:
60.1% (150)Foreign-born:
1.5% (14)
Asian - Speak another language Native:
39.2% (98)Foreign-born:
100.0% (922)
Other race - Speak another language Native:
41.7% (34)Foreign-born:
100.0% (165)
Two or more races - Speak another language Native:
17.0% (124)Foreign-born:
100.0% (25)
White alone - Speak only English Native:
98.9% (13,394)Foreign-born:
34.1% (128)
White alone - Speak another language Native:
1.1% (143)Foreign-born:
65.4% (245)
Hispanic or Latino - Speak only English Native:
89.6% (269)Foreign-born:
16.5% (49)
Hispanic or Latino - Speak another language Native:
12.9% (39)Foreign-born:
78.9% (233)
Foreign-born residents in Clemson 1,376 residents are foreign born (5.9% Asia , 1.0% Europe ).
This city:
7.7%South Carolina:
5.3%
Marital status for residents in Clemson Marital status - White (Caucasian) population 15 years and over
Males 68.4% Never married27.1% Now married0.2% Separated2.0% Widowed2.2% DivorcedFemales 50.6% Never married32.6% Now married0.0% Separated8.3% Widowed8.4% DivorcedWomen who did not give birth in the past 12 months Now married:
23.0% (841)Unmarried:
77.0% (2,821)
Marital status - Black or African American population 15 years and over
Males 73.1% Never married15.7% Now married0.0% Separated0.0% Widowed11.3% DivorcedFemales 61.9% Never married26.8% Now married0.0% Separated4.9% Widowed6.5% DivorcedWomen who did not give birth in the past 12 months Now married:
26.1% (113)Unmarried:
73.9% (322)
Marital status - American Indian / Alaska Native population 15 years and over
Males 6.4% Never married89.4% Now married0.0% Separated0.0% Widowed4.3% DivorcedFemales 0.0% Never married0.0% Now married0.0% Separated0.0% Widowed100.0% DivorcedWomen who did not give birth in the past 12 months Now married:
0.0% (0)Unmarried:
100.0% (7)
Marital status - Asian population 15 years and over
Males 80.2% Never married11.6% Now married0.0% Separated1.7% Widowed6.5% DivorcedFemales 64.8% Never married27.9% Now married0.0% Separated2.2% Widowed5.1% DivorcedWomen who did not give birth in the past 12 months Now married:
25.6% (99)Unmarried:
74.4% (286)
Marital status - Other race population 15 years and over
Males 95.6% Never married4.4% Now married0.0% Separated0.0% Widowed0.0% DivorcedFemales 0.0% Never married100.0% Now married0.0% Separated0.0% Widowed0.0% DivorcedWomen who did not give birth in the past 12 months Now married:
100.0% (10)Unmarried:
0.0% (0)
Marital status - Two or more races population 15 years and over
Males 75.1% Never married13.0% Now married0.0% Separated0.0% Widowed11.9% DivorcedFemales 38.1% Never married37.0% Now married0.0% Separated0.0% Widowed24.9% DivorcedWomen who gave birth in the past 12 months Now married:
100.0% (39)Unmarried:
0.0% (0)
Women who did not give birth in the past 12 months Now married:
27.0% (55)Unmarried:
73.0% (149)
Marital status - White alone, not Hispanic / Latino population 15 years and over
Males 68.2% Never married27.3% Now married0.2% Separated2.1% Widowed2.2% DivorcedFemales 49.0% Never married33.7% Now married0.0% Separated8.6% Widowed8.7% DivorcedWomen who did not give birth in the past 12 months Now married:
24.1% (850)Unmarried:
75.9% (2,675)
Marital status - Hispanic or Latino population 15 years and over
Males 83.4% Never married16.6% Now married0.0% Separated0.0% Widowed0.0% DivorcedFemales 93.5% Never married6.5% Now married0.0% Separated0.0% Widowed0.0% DivorcedWomen who did not give birth in the past 12 months Now married:
6.5% (17)Unmarried:
93.5% (238)
Ancestries in Clemson
1,467 18.2% English
750 9.3% German
721 8.9% Irish
595 7.4% Scottish
524 6.5% American
298 3.7% Scotch-Irish
286 3.5% Italian
209 2.6% European
160 2.0% Polish
155 1.9% African
136 1.7% French
104 1.3% Welsh
74 0.9% Romanian
55 0.7% Russian
49 0.6% Dutch
42 0.5% Iranian
34 0.4% Finnish
29 0.4% French Canadian
20 0.2% British
19 0.2% Croatian
19 0.2% Celtic
17 0.2% Hungarian
16 0.2% Portuguese
15 0.2% Norwegian
14 0.2% Scandinavian
12 0.1% Lebanese
12 0.1% Palestinian
12 0.1% British West Indian
11 0.1% Northern European
11 0.1% Eastern European
10 0.1% Lithuanian
9 0.1% Czechoslovakian
8 0.10% Egyptian
3 0.04% U.S. Virgin Islander
Geographical mobility in Clemson
Same house 1 year ago 9,874 69.8% White (Caucasian)
732 65.6% Black or African American
46 64.0% American Indian / Alaska Native
445 37.2% Asian
111 62.5% Other race
563 65.2% Two or more races
9,834 70.1% White alone, not Hispanic / Latino
312 53.6% Hispanic or Latino
Moved within same county 1,981 14.0% White / Caucasian
266 23.8% Black or African American
4 5.8% American Indian / Alaska Native
434 36.2% Asian
64 7.4% Two or more races
1,891 13.5% White alone, not Hispanic / Latino
182 31.3% Hispanic or Latino
Moved within same state 1,692 12.0% White / Caucasian
43 3.8% Black or African American
13 18.4% American Indian / Alaska Native
101 11.7% Two or more races
1,682 12.0% White alone, not Hispanic / Latino
82 14.2% Hispanic or Latino
Moved from different state 562 4.0% White / Caucasian
216 19.4% Black or African American
106 8.8% Asian
120 13.9% Two or more races
583 4.2% White alone, not Hispanic / Latino
37 6.3% Hispanic or Latino
Moved from abroad 16 0.1% White
190 15.9% Asian
63 35.2% Other race
16 0.1% White alone, not Hispanic / Latino
55 9.4% Hispanic or Latino
Children Nativity (place of birth) in Clemson
Children under 6 years - Living with two parents Both parents native 139 100.0% NativeBoth parents foreign-born 15 100.0% NativeChildren 6 to 17 years - Living with two parents Both parents native 1,229 99.1% Native12 0.9% Foreign-bornBoth parents foreign-born 73 71.3% Native29 28.7% Foreign-bornOne native, one foreign-born parent 92 100.0% NativeChildren 6 to 17 years - Living with one parent Native parent 105 100.0% NativeForeign-born parent 10 49.6% Native10 50.4% Foreign-born
Grandparents responsible for own grandchildren in Clemson
Grandparents (30 to 59 years) White / Caucasian 15 100.0% Responsible for grandchildrenWhite alone, not Hispanic / Latino 15 100.0% Responsible for grandchildrenGrandparents (60 years and over) White / Caucasian 9 63.5% Responsible for grandchildren5 36.5% Not responsible for grandchildrenWhite alone, not Hispanic / Latino 9 62.1% Responsible for grandchildren6 37.9% Not responsible for grandchildren