Races in Clearwater, Florida (FL) Detailed Stats
Data:
Races - White alone (%)
Races - White alone (% change since 2000)
Races - Black alone (%)
Races - Black alone (% change since 2000)
Races - American Indian alone (%)
Races - American Indian alone (% change since 2000)
Races - Asian alone (%)
Races - Asian alone (% change since 2000)
Races - Hispanic (%)
Races - Hispanic (% change since 2000)
Races - Native Hawaiian and Other Pacific Islander alone (%)
Races - Native Hawaiian and Other Pacific Islander alone (% change since 2000)
Races - Two or more races(%)
Races - Two or more races(% change since 2000)
Races - Other race alone (%)
Races - Other race alone (% change since 2000)
Racial diversity
Place of birth - Born in state of residence (%)
Place of birth - Born in state of residence (%) - White
Place of birth - Born in state of residence (%) - Black or African American
Place of birth - Born in state of residence (%) - Asian
Place of birth - Born in state of residence (%) - Hispanic or Latino
Place of birth - Born in state of residence (%) - American Indian and Alaska Native
Place of birth - Born in state of residence (%) - Multirace
Place of birth - Born in state of residence (%) - Other Race
Place of birth - Born in other state (%)
Place of birth - Born in other state (%) - White
Place of birth - Born in other state (%) - Black or African American
Place of birth - Born in other state (%) - Asian
Place of birth - Born in other state (%) - Hispanic or Latino
Place of birth - Born in other state (%) - American Indian and Alaska Native
Place of birth - Born in other state (%) - Multirace
Place of birth - Born in other state (%) - Other Race
Place of birth - Native, outside of US (%)
Place of birth - Native, outside of US (%) - White
Place of birth - Native, outside of US (%) - Black or African American
Place of birth - Native, outside of US (%) - Asian
Place of birth - Native, outside of US (%) - Hispanic or Latino
Place of birth - Native, outside of US (%) - American Indian and Alaska Native
Place of birth - Native, outside of US (%) - Multirace
Place of birth - Native, outside of US (%) - Other Race
Place of birth - Foreign born (%)
Place of birth - Foreign born (%) - White
Place of birth - Foreign born (%) - Black or African American
Place of birth - Foreign born (%) - Asian
Place of birth - Foreign born (%) - Hispanic or Latino
Place of birth - Foreign born (%) - American Indian and Alaska Native
Place of birth - Foreign born (%) - Multirace
Place of birth - Foreign born (%) - Other Race
Residents speaking English at home (%)
Residents speaking English at home - Born in the United States (%)
Residents speaking English at home - Native, born elsewhere (%)
Residents speaking English at home - Foreign born (%)
Residents speaking Spanish at home (%)
Residents speaking Spanish at home - Born in the United States (%)
Residents speaking Spanish at home - Native, born elsewhere (%)
Residents speaking Spanish at home - Foreign born (%)
Residents speaking other language at home (%)
Residents speaking other language at home - Born in the United States (%)
Residents speaking other language at home - Native, born elsewhere (%)
Residents speaking other language at home - Foreign born (%)
Marital status - Never married (%)
Marital status - Now married (%)
Marital status - Separated (%)
Marital status - Widowed (%)
Marital status - Divorced (%)
Ancestries Reported - Arab (%)
Ancestries Reported - Czech (%)
Ancestries Reported - Danish (%)
Ancestries Reported - Dutch (%)
Ancestries Reported - English (%)
Ancestries Reported - French (%)
Ancestries Reported - French Canadian (%)
Ancestries Reported - German (%)
Ancestries Reported - Greek (%)
Ancestries Reported - Hungarian (%)
Ancestries Reported - Irish (%)
Ancestries Reported - Italian (%)
Ancestries Reported - Lithuanian (%)
Ancestries Reported - Norwegian (%)
Ancestries Reported - Polish (%)
Ancestries Reported - Portuguese (%)
Ancestries Reported - Russian (%)
Ancestries Reported - Scotch-Irish (%)
Ancestries Reported - Scottish (%)
Ancestries Reported - Slovak (%)
Ancestries Reported - Subsaharan African (%)
Ancestries Reported - Swedish (%)
Ancestries Reported - Swiss (%)
Ancestries Reported - Ukrainian (%)
Ancestries Reported - United States (%)
Ancestries Reported - Welsh (%)
Ancestries Reported - West Indian (%)
Ancestries Reported - Other (%)
Geographical mobility - Same house 1 year ago (%)
Geographical mobility - Same house 1 year ago (%) - White
Geographical mobility - Same house 1 year ago (%) - Black or African American
Geographical mobility - Same house 1 year ago (%) - Asian
Geographical mobility - Same house 1 year ago (%) - Hispanic or Latino
Geographical mobility - Same house 1 year ago (%) - American Indian and Alaska Native
Geographical mobility - Same house 1 year ago (%) - Multirace
Geographical mobility - Same house 1 year ago (%) - Other Race
Geographical mobility - Moved within same county (%)
Geographical mobility - Moved within same county (%) - White
Geographical mobility - Moved within same county (%) - Black or African American
Geographical mobility - Moved within same county (%) - Asian
Geographical mobility - Moved within same county (%) - Hispanic or Latino
Geographical mobility - Moved within same county (%) - American Indian and Alaska Native
Geographical mobility - Moved within same county (%) - Multirace
Geographical mobility - Moved within same county (%) - Other Race
Geographical mobility - Moved from different county within same state (%)
Geographical mobility - Moved from different county within same state (%) - White
Geographical mobility - Moved from different county within same state (%) - Black or African American
Geographical mobility - Moved from different county within same state (%) - Asian
Geographical mobility - Moved from different county within same state (%) - Hispanic or Latino
Geographical mobility - Moved from different county within same state (%) - American Indian and Alaska Native
Geographical mobility - Moved from different county within same state (%) - Multirace
Geographical mobility - Moved from different county within same state (%) - Other Race
Geographical mobility - Moved from different state (%)
Geographical mobility - Moved from different state (%) - White
Geographical mobility - Moved from different state (%) - Black or African American
Geographical mobility - Moved from different state (%) - Asian
Geographical mobility - Moved from different state (%) - Hispanic or Latino
Geographical mobility - Moved from different state (%) - American Indian and Alaska Native
Geographical mobility - Moved from different state (%) - Multirace
Geographical mobility - Moved from different state (%) - Other Race
Geographical mobility - Moved from abroad (%)
Geographical mobility - Moved from abroad (%) - White
Geographical mobility - Moved from abroad (%) - Black or African American
Geographical mobility - Moved from abroad (%) - Asian
Geographical mobility - Moved from abroad (%) - Hispanic or Latino
Geographical mobility - Moved from abroad (%) - American Indian and Alaska Native
Geographical mobility - Moved from abroad (%) - Multirace
Geographical mobility - Moved from abroad (%) - Other Race
Place of birth for the foreign-born population - Ireland (%)
Place of birth for the foreign-born population - Denmark (%)
Place of birth for the foreign-born population - Norway (%)
Place of birth for the foreign-born population - Sweden (%)
Place of birth for the foreign-born population - United Kingdom (%)
Place of birth for the foreign-born population - England (%)
Place of birth for the foreign-born population - Scotland (%)
Place of birth for the foreign-born population - Other Northern Europe (%)
Place of birth for the foreign-born population - Austria (%)
Place of birth for the foreign-born population - Belgium (%)
Place of birth for the foreign-born population - France (%)
Place of birth for the foreign-born population - Germany (%)
Place of birth for the foreign-born population - Netherlands (%)
Place of birth for the foreign-born population - Switzerland (%)
Place of birth for the foreign-born population - Other Western Europe (%)
Place of birth for the foreign-born population - Greece (%)
Place of birth for the foreign-born population - Italy (%)
Place of birth for the foreign-born population - Portugal (%)
Place of birth for the foreign-born population - Spain (%)
Place of birth for the foreign-born population - Other Southern Europe (%)
Place of birth for the foreign-born population - Albania (%)
Place of birth for the foreign-born population - Belarus (%)
Place of birth for the foreign-born population - Bosnia and Herzegovina (%)
Place of birth for the foreign-born population - Bulgaria (%)
Place of birth for the foreign-born population - Croatia (%)
Place of birth for the foreign-born population - Czechoslovakia (%)
Place of birth for the foreign-born population - Hungary (%)
Place of birth for the foreign-born population - Latvia (%)
Place of birth for the foreign-born population - Lithuania (%)
Place of birth for the foreign-born population - North Macedonia (Macedonia) (%)
Place of birth for the foreign-born population - Moldova (%)
Place of birth for the foreign-born population - Poland (%)
Place of birth for the foreign-born population - Romania (%)
Place of birth for the foreign-born population - Russia (%)
Place of birth for the foreign-born population - Serbia (%)
Place of birth for the foreign-born population - Ukraine (%)
Place of birth for the foreign-born population - Other Eastern Europe (%)
Place of birth for the foreign-born population - China (%)
Place of birth for the foreign-born population - Hong Kong (%)
Place of birth for the foreign-born population - Taiwan (%)
Place of birth for the foreign-born population - Japan (%)
Place of birth for the foreign-born population - Korea (%)
Place of birth for the foreign-born population - Other Eastern Asia (%)
Place of birth for the foreign-born population - Afghanistan (%)
Place of birth for the foreign-born population - Bangladesh (%)
Place of birth for the foreign-born population - India (%)
Place of birth for the foreign-born population - Iran (%)
Place of birth for the foreign-born population - Kazakhstan (%)
Place of birth for the foreign-born population - Nepal (%)
Place of birth for the foreign-born population - Pakistan (%)
Place of birth for the foreign-born population - Sri Lanka (%)
Place of birth for the foreign-born population - Uzbekistan (%)
Place of birth for the foreign-born population - Other South Central Asia (%)
Place of birth for the foreign-born population - Burma (%)
Place of birth for the foreign-born population - Cambodia (%)
Place of birth for the foreign-born population - Indonesia (%)
Place of birth for the foreign-born population - Laos (%)
Place of birth for the foreign-born population - Malaysia (%)
Place of birth for the foreign-born population - Philippines (%)
Place of birth for the foreign-born population - Singapore (%)
Place of birth for the foreign-born population - Thailand (%)
Place of birth for the foreign-born population - Vietnam (%)
Place of birth for the foreign-born population - Other South Eastern Asia (%)
Place of birth for the foreign-born population - Armenia (%)
Place of birth for the foreign-born population - Iraq (%)
Place of birth for the foreign-born population - Israel (%)
Place of birth for the foreign-born population - Jordan (%)
Place of birth for the foreign-born population - Kuwait (%)
Place of birth for the foreign-born population - Lebanon (%)
Place of birth for the foreign-born population - Saudi Arabia (%)
Place of birth for the foreign-born population - Syria (%)
Place of birth for the foreign-born population - Turkey (%)
Place of birth for the foreign-born population - Yemen (%)
Place of birth for the foreign-born population - Other Western Asia (%)
Place of birth for the foreign-born population - Eritrea (%)
Place of birth for the foreign-born population - Ethiopia (%)
Place of birth for the foreign-born population - Kenya (%)
Place of birth for the foreign-born population - Somalia (%)
Place of birth for the foreign-born population - Uganda (%)
Place of birth for the foreign-born population - Zimbabwe (%)
Place of birth for the foreign-born population - Other Eastern Africa (%)
Place of birth for the foreign-born population - Cameroon (%)
Place of birth for the foreign-born population - Congo (%)
Place of birth for the foreign-born population - Democratic Republic of Congo (Zaire) (%)
Place of birth for the foreign-born population - Other Middle Africa (%)
Place of birth for the foreign-born population - Egypt (%)
Place of birth for the foreign-born population - Morocco (%)
Place of birth for the foreign-born population - Sudan (%)
Place of birth for the foreign-born population - Other Northern Africa (%)
Place of birth for the foreign-born population - South Africa (%)
Place of birth for the foreign-born population - Other Southern Africa (%)
Place of birth for the foreign-born population - Cabo Verde (%)
Place of birth for the foreign-born population - Ghana (%)
Place of birth for the foreign-born population - Liberia (%)
Place of birth for the foreign-born population - Nigeria (%)
Place of birth for the foreign-born population - Senegal (%)
Place of birth for the foreign-born population - Sierra Leone (%)
Place of birth for the foreign-born population - Other Western Africa (%)
Place of birth for the foreign-born population - Australia (%)
Place of birth for the foreign-born population - New Zealand (%)
Place of birth for the foreign-born population - Fiji (%)
Place of birth for the foreign-born population - Micronesia (%)
Place of birth for the foreign-born population - Bahamas (%)
Place of birth for the foreign-born population - Barbados (%)
Place of birth for the foreign-born population - Cuba (%)
Place of birth for the foreign-born population - Dominica (%)
Place of birth for the foreign-born population - Dominican Republic (%)
Place of birth for the foreign-born population - Grenada (%)
Place of birth for the foreign-born population - Haiti (%)
Place of birth for the foreign-born population - Jamaica (%)
Place of birth for the foreign-born population - St. Vincent and the Grenadines (%)
Place of birth for the foreign-born population - Trinidad and Tobago (%)
Place of birth for the foreign-born population - West Indies (%)
Place of birth for the foreign-born population - Other Caribbean (%)
Place of birth for the foreign-born population - Belize (%)
Place of birth for the foreign-born population - Costa Rica (%)
Place of birth for the foreign-born population - El Salvador (%)
Place of birth for the foreign-born population - Guatemala (%)
Place of birth for the foreign-born population - Honduras (%)
Place of birth for the foreign-born population - Mexico (%)
Place of birth for the foreign-born population - Nicaragua (%)
Place of birth for the foreign-born population - Panama (%)
Place of birth for the foreign-born population - Other Central America (%)
Place of birth for the foreign-born population - Argentina (%)
Place of birth for the foreign-born population - Bolivia (%)
Place of birth for the foreign-born population - Brazil (%)
Place of birth for the foreign-born population - Chile (%)
Place of birth for the foreign-born population - Colombia (%)
Place of birth for the foreign-born population - Ecuador (%)
Place of birth for the foreign-born population - Guyana (%)
Place of birth for the foreign-born population - Peru (%)
Place of birth for the foreign-born population - Uruguay (%)
Place of birth for the foreign-born population - Venezuela (%)
Place of birth for the foreign-born population - Other South America (%)
Place of birth for the foreign-born population - Canada (%)
Place of birth for the foreign-born population - Other Northern America (%)
Place of birth for the foreign-born population - Other (%)
Latest news about races in Clearwater, FL collected exclusively by city-data.com from local newspapers, TV, and radio stations
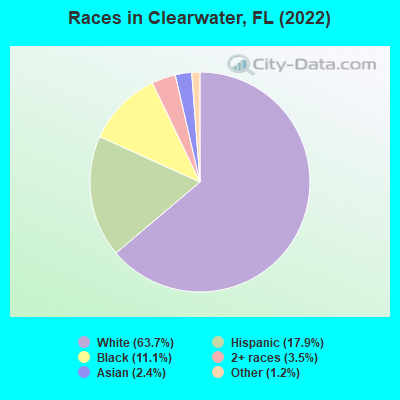
According to 2022 data, the most numerous races in Clearwater, FL are White alone (74,519 residents), Hispanic (20,979 residents), and Black alone (12,954 residents). 77.3% of Clearwater residents speak English at home. 17.8% of Clearwater, FL residents are foreign-born (7.2% born in Latin America, 4.5% born in Europe, 2.8% born in Asia), which is 18.0% less than the foreign-born rate of 21.0% across the entire state of Florida.
Race distribution in Clearwater
2000 2022
85,015 78.1% White alone 10,361 9.5% Black alone 9,754 9.0% Hispanic 1,757 1.6% Asian alone 1,444 1.3% Two or more races 168 0.2% Other race alone 220 0.2% American Indian alone 68 0.06% Native Hawaiian and Other
74,519 63.7% White alone 20,979 17.9% Hispanic 12,954 11.1% Black alone 4,118 3.5% Two or more races 2,795 2.4% Asian alone 1,452 1.2% Other race alone 106 0.09% Native Hawaiian and Other 87 0.07% American Indian alone
2000 2022
10,458,509 65.4% White alone 2,682,715 16.8% Hispanic 2,264,268 14.2% Black alone 261,693 1.6% Asian alone 236,954 1.5% Two or more races 42,358 0.3% American Indian alone 28,994 0.2% Other race alone 6,887 0.04% Native Hawaiian and Other
11,309,403 50.8% White alone 6,025,039 27.1% Hispanic 3,241,015 14.6% Black alone 861,630 3.9% Two or more races 623,692 2.8% Asian alone 152,054 0.7% Other race alone 22,504 0.1% American Indian alone 9,486 0.04% Native Hawaiian and Other
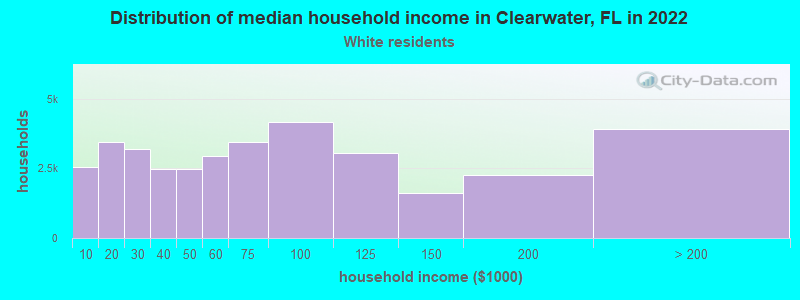
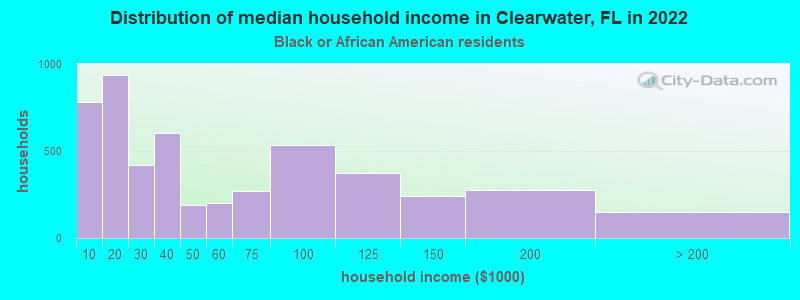
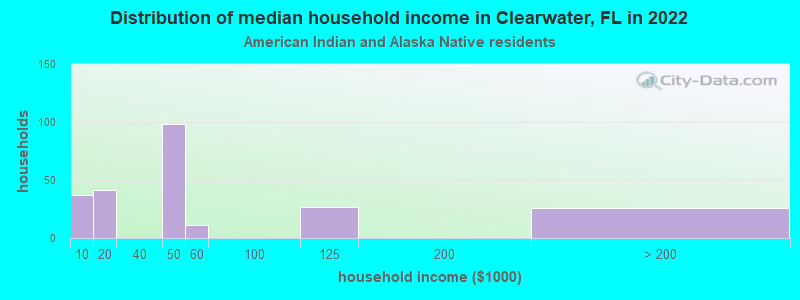
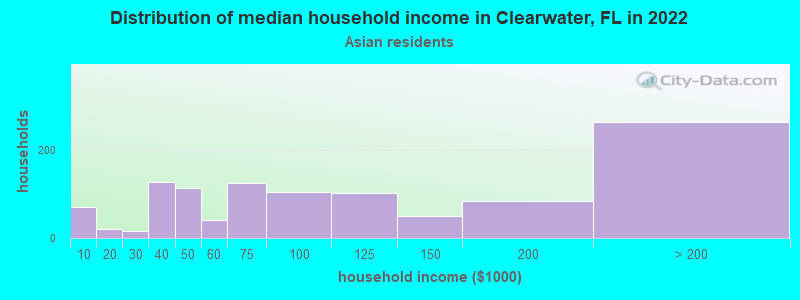
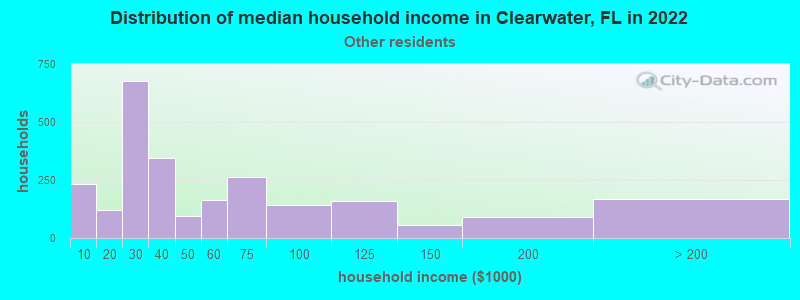
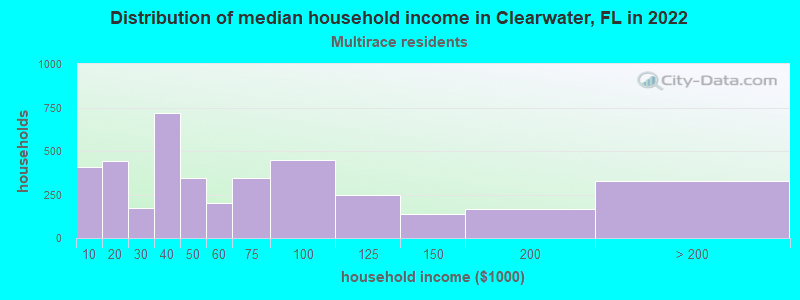
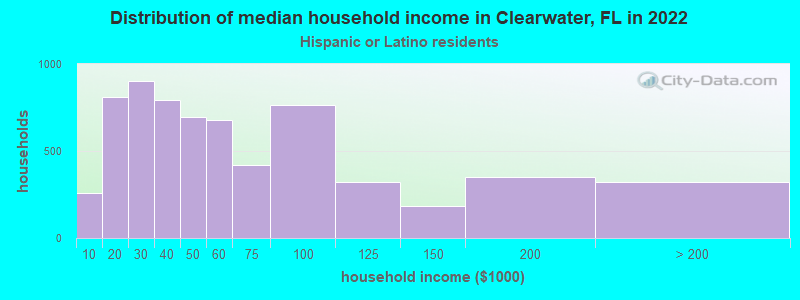
Income and house value in Clearwater Median household income in 2022 $63,015 White non-Hispanic householders$36,539 Black householders$27,680 American Indian and Alaska Native householders$100,905 Asian householders$51,212 Some other race householders$44,276 Two or more races householders$43,435 Hispanic or Latino race householdersMedian 2022 house value $412,869 White Non-Hispanic householders$266,555 Black or African American householders$290,682 American Indian or Alaska Native householders $333,875 Asian householders$312,084 Some other race householders$353,332 Two or more races householders$343,215 Hispanic or Latino householders
Median age by race in Clearwater
51.6 Median age for White residents50.1 52.6 35.4 Median age for Black or African American residents47.3 32.3 19.5 Median age for American Indian / Alaska Native residents42.5 17.4 39.7 Median age for Asian residents44.8 36.1 70.5 Median age for Native Hawaiian / Pacific Islander residents-666,666,666.0 -666,666,666.0 29.6 Median age for Other race residents34.0 28.0 34.6 Median age for Two or more races residents26.5 38.8 52.4 Median age for White alone residents51.7 52.7 36.5 Median age for Hispanic or Latino residents38.5 36.2
Owner/renter occupied households by race in Clearwater
House owners and renters - White residents 23,725 66.9% Owner occupied11,754 33.1% Renter occupiedHouse owners and renters - Black or African American residents 1,410 25.7% Owner occupied4,073 74.3% Renter occupiedHouse owners and renters - American Indian / Alaska Native residents 99 41.5% Owner occupied140 58.5% Renter occupiedHouse owners and renters - Asian residents 638 65.4% Owner occupied337 34.6% Renter occupiedHouse owners and renters - Native Hawaiian / Pacific Islander residents 4 100.0% Renter occupiedHouse owners and renters - Other race residents 1,095 39.1% Owner occupied1,706 60.9% Renter occupiedHouse owners and renters - Two or more races residents 1,594 46.5% Owner occupied1,837 53.5% Renter occupiedHouse owners and renters - White alone residents 23,536 68.1% Owner occupied11,027 31.9% Renter occupiedHouse owners and renters - Hispanic or Latino residents 2,229 34.3% Owner occupied4,273 65.7% Renter occupied
Language usage in Clearwater
English speakers - Total 77.3% of residents of Clearwater speak English at home.
14.5% of residents speak Spanish at home 6,062 37.5% Speak English very well10,083 62.5% Speak English less than very well8.2% of residents speak other language at home 5,585 60.9% Speak English very well3,583 39.1% Speak English less than very well
English speakers - Born in the United States 93.3% of residents of Clearwater speak English at home.
4.4% of residents speak Spanish at home 1,002 43.4% Speak English very well1,308 56.6% Speak English less than very well2.4% of residents speak other language at home 875 69.6% Speak English very well382 30.4% Speak English less than very well
English speakers - Native, born elsewhere 47.0% of residents of Clearwater speak English at home.
35.3% of residents speak Spanish at home 332 41.3% Speak English very well472 58.7% Speak English less than very well17.7% of residents speak other language at home 403 100.0% Speak English very well
English speakers - Foreign-born 20.6% of residents of Clearwater speak English at home.
43.3% of residents speak Spanish at home 2,263 25.8% Speak English very well6,502 74.2% Speak English less than very well36.1% of residents speak other language at home 4,100 56.2% Speak English very well3,201 43.8% Speak English less than very well
White (Caucasian) - Speak only English Native:
95.9% (62,769)Foreign-born:
29.5% (3,000)
White (Caucasian) - Speak another language Native:
4.1% (2,663)Foreign-born:
70.5% (7,180)
Black or African American - Speak only English Native:
99.4% (10,596)Foreign-born:
61.8% (553)
Black or African American - Speak another language Native:
0.9% (101)Foreign-born:
37.0% (331)
American Indian / Alaska Native - Speak another language Native:
100.0% (591)Foreign-born:
100.0% (169)
Asian - Speak only English Native:
75.4% (639)Foreign-born:
22.1% (421)
Asian - Speak another language Native:
24.6% (208)Foreign-born:
77.9% (1,485)
Other race - Speak only English Native:
40.9% (2,058)Foreign-born:
1.7% (43)
Other race - Speak another language Native:
59.1% (2,975)Foreign-born:
98.3% (2,550)
Two or more races - Speak only English Native:
63.8% (4,779)Foreign-born:
10.7% (507)
Two or more races - Speak another language Native:
36.2% (2,712)Foreign-born:
89.3% (4,239)
White alone - Speak only English Native:
98.1% (62,295)Foreign-born:
33.6% (2,958)
White alone - Speak another language Native:
1.9% (1,195)Foreign-born:
66.4% (5,853)
Hispanic or Latino - Speak only English Native:
32.5% (3,372)Foreign-born:
4.7% (416)
Hispanic or Latino - Speak another language Native:
67.5% (7,013)Foreign-born:
95.3% (8,386)
Foreign-born residents in Clearwater 20,858 residents are foreign born (7.2% Latin America , 4.5% Europe , 2.8% Asia ).
This city:
17.8%Florida:
21.1%
Marital status for residents in Clearwater Marital status - White (Caucasian) population 15 years and over
Males 34.3% Never married48.8% Now married0.9% Separated2.9% Widowed13.1% DivorcedFemales 28.3% Never married41.3% Now married2.0% Separated13.2% Widowed15.3% DivorcedWomen who gave birth in the past 12 months Now married:
100.0% (101)Unmarried:
0.0% (0)
Women who did not give birth in the past 12 months Now married:
36.6% (5,714)Unmarried:
63.4% (9,891)
Marital status - Black or African American population 15 years and over
Males 44.9% Never married37.5% Now married0.3% Separated8.0% Widowed9.4% DivorcedFemales 74.0% Never married17.3% Now married2.0% Separated1.9% Widowed4.9% DivorcedWomen who gave birth in the past 12 months Now married:
4.2% (12)Unmarried:
95.8% (279)
Women who did not give birth in the past 12 months Now married:
29.7% (831)Unmarried:
70.3% (1,969)
Marital status - American Indian / Alaska Native population 15 years and over
Males 36.4% Never married36.7% Now married0.0% Separated12.5% Widowed14.4% DivorcedFemales 38.9% Never married35.4% Now married0.0% Separated0.0% Widowed25.7% DivorcedWomen who did not give birth in the past 12 months Now married:
54.9% (101)Unmarried:
45.1% (83)
Marital status - Asian population 15 years and over
Males 34.9% Never married55.0% Now married0.0% Separated5.5% Widowed4.6% DivorcedFemales 34.2% Never married54.8% Now married0.3% Separated5.4% Widowed5.2% DivorcedWomen who gave birth in the past 12 months Now married:
100.0% (37)Unmarried:
0.0% (0)
Women who did not give birth in the past 12 months Now married:
45.9% (491)Unmarried:
54.1% (579)
Marital status - Native Hawaiian / Pacific Islander population 15 years and over
Males 0.0% Never married100.0% Now married0.0% Separated0.0% Widowed0.0% DivorcedFemales 0.0% Never married100.0% Now married0.0% Separated0.0% Widowed0.0% DivorcedWomen who did not give birth in the past 12 months Now married:
100.0% (5)Unmarried:
0.0% (0)
Marital status - Other race population 15 years and over
Males 47.5% Never married41.4% Now married3.1% Separated0.7% Widowed7.5% DivorcedFemales 36.4% Never married44.9% Now married1.3% Separated0.1% Widowed17.2% DivorcedWomen who gave birth in the past 12 months Now married:
29.6% (42)Unmarried:
70.4% (100)
Women who did not give birth in the past 12 months Now married:
42.0% (843)Unmarried:
58.0% (1,165)
Marital status - Two or more races population 15 years and over
Males 51.8% Never married39.4% Now married0.0% Separated0.0% Widowed8.8% DivorcedFemales 47.5% Never married28.2% Now married1.8% Separated13.1% Widowed9.4% DivorcedWomen who gave birth in the past 12 months Now married:
100.0% (189)Unmarried:
0.0% (0)
Women who did not give birth in the past 12 months Now married:
40.9% (1,096)Unmarried:
59.1% (1,585)
Marital status - White alone, not Hispanic / Latino population 15 years and over
Males 32.5% Never married49.9% Now married0.9% Separated3.0% Widowed13.6% DivorcedFemales 27.4% Never married42.2% Now married2.1% Separated13.4% Widowed14.9% DivorcedWomen who gave birth in the past 12 months Now married:
100.0% (101)Unmarried:
0.0% (0)
Women who did not give birth in the past 12 months Now married:
37.8% (5,714)Unmarried:
62.2% (9,411)
Marital status - Hispanic or Latino population 15 years and over
Males 49.6% Never married36.4% Now married2.8% Separated0.0% Widowed11.1% DivorcedFemales 46.0% Never married32.9% Now married0.7% Separated9.5% Widowed10.9% DivorcedWomen who gave birth in the past 12 months Now married:
40.9% (90)Unmarried:
59.1% (130)
Women who did not give birth in the past 12 months Now married:
30.3% (1,206)Unmarried:
69.7% (2,772)
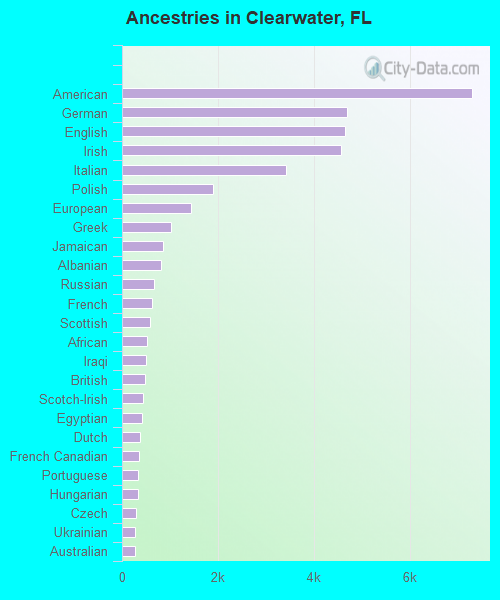
Ancestries in Clearwater
7,287 11.3% American4,687 7.3% German4,653 7.2% English4,562 7.1% Irish3,412 5.3% Italian1,887 2.9% Polish1,442 2.2% European1,023 1.6% Greek854 1.3% Jamaican810 1.3% Albanian665 1.0% Russian629 1.0% French579 0.9% Scottish511 0.8% African493 0.8% Iraqi477 0.7% British444 0.7% Scotch-Irish412 0.6% Egyptian371 0.6% Dutch345 0.5% French Canadian331 0.5% Portuguese327 0.5% Hungarian299 0.5% Czech281 0.4% Ukrainian270 0.4% Australian264 0.4% Canadian261 0.4% Nigerian238 0.4% Yugoslavian234 0.4% Welsh228 0.4% Eastern European222 0.3% Lebanese201 0.3% Brazilian195 0.3% Swedish191 0.3% Swiss182 0.3% Croatian182 0.3% Haitian171 0.3% Iranian135 0.2% Serbian132 0.2% Lithuanian126 0.2% South African125 0.2% Norwegian103 0.2% Belgian99 0.2% Czechoslovakian98 0.2% Palestinian88 0.1% Moroccan69 0.1% Guyanese69 0.1% Bulgarian68 0.1% Scandinavian67 0.1% Northern European65 0.1% Romanian55 0.09% Armenian54 0.08% Israeli52 0.08% Turkish48 0.07% Austrian43 0.07% Ghanaian42 0.07% Danish42 0.07% Slovene41 0.06% Slavic39 0.06% Cape Verdean39 0.06% New Zealander34 0.05% Slovak27 0.04% Macedonian24 0.04% Finnish21 0.03% Pennsylvania German20 0.03% Celtic17 0.03% Assyrian16 0.02% Syrian15 0.02% Bahamian15 0.02% Barbadian12 0.02% Carpatho Rusyn11 0.02% Latvian10 0.02% Cajun10 0.02% Icelander10 0.02% Trinidadian and Tobagonian9 0.01% Jordanian9 0.01% West Indian
Geographical mobility in Clearwater Same house 1 year ago 65,794 84.8% White (Caucasian)11,941 91.1% Black or African American787 95.4% American Indian / Alaska Native3,393 87.1% Asian4,863 70.1% Other race10,609 83.4% Two or more races62,291 84.2% White alone, not Hispanic / Latino17,786 86.0% Hispanic or LatinoMoved within same county 5,981 7.7% White / Caucasian775 5.9% Black or African American33 4.0% American Indian / Alaska Native207 5.3% Asian19 46.6% Native Hawaiian / Pacific Islander906 13.1% Other race983 7.7% Two or more races5,981 8.1% White alone, not Hispanic / Latino1,531 7.4% Hispanic or LatinoMoved within same state 966 1.2% White / Caucasian80 0.6% Black or African American130 3.3% Asian71 1.0% Other race388 3.1% Two or more races924 1.2% White alone, not Hispanic / Latino185 0.9% Hispanic or LatinoMoved from different state 3,439 4.4% White / Caucasian308 2.4% Black or African American16 1.9% American Indian / Alaska Native136 3.5% Asian38 93.7% Native Hawaiian / Pacific Islander254 3.7% Other race243 1.9% Two or more races3,439 4.6% White alone, not Hispanic / Latino824 4.0% Hispanic or LatinoMoved from abroad 1,365 1.8% White19 0.5% Asian95 1.4% Other race196 1.5% Two or more races1,365 1.8% White alone, not Hispanic / Latino360 1.7% Hispanic or Latino
Children Nativity (place of birth) in Clearwater
Children under 6 years - Living with two parents Both parents native 1,740 100.0% NativeBoth parents foreign-born 142 48.6% Native150 51.4% Foreign-bornOne native, one foreign-born parent 300 100.0% NativeChildren under 6 years - Living with one parent Native parent 2,529 100.0% NativeForeign-born parent 773 89.7% Native89 10.3% Foreign-bornChildren 6 to 17 years - Living with two parents Both parents native 3,584 100.0% NativeBoth parents foreign-born 496 44.2% Native625 55.8% Foreign-bornOne native, one foreign-born parent 1,525 100.0% NativeChildren 6 to 17 years - Living with one parent Native parent 4,176 100.0% NativeForeign-born parent 1,280 50.0% Native1,280 50.0% Foreign-born
Place of birth for residents in Clearwater 10,385 Americas8,840 Latin America5,559 Europe3,658 Central America3,394 Asia2,977 South America2,890 Eastern Europe2,205 Caribbean1,561 South Eastern Asia1,544 Northern America1,063 Southern Europe929 South Central Asia925 Africa845 Northern Europe759 Western Europe651 Western Asia593 Oceania593 Australia and New Zealand Subregion385 Northern Africa291 Western Africa250 Eastern Asia185 Southern Africa151 China63 Eastern Africa2,594 Mexico1,541 Canada1,175 Venezuela1,042 Cuba767 Philippines742 Poland736 India639 Albania593 Colombia578 Brazil558 Australia543 Germany507 El Salvador502 Italy473 Jamaica473 Vietnam464 Greece413 United Kingdom394 Dominican Republic361 Egypt348 Bosnia and Herzegovina301 Iraq283 Ukraine268 Guatemala245 England189 Nicaragua188 Nigeria185 South Africa182 Peru157 Ecuador154 Iran149 Turkey142 Scotland141 Malaysia134 Haiti129 Russia124 China109 Bolivia105 Argentina104 Lebanon92 Hungary87 Ghana77 Switzerland74 Chile73 Spain72 Serbia69 Laos68 Korea63 Bulgaria61 Croatia61 Thailand53 Trinidad and Tobago52 Romania51 Israel49 Netherlands49 Panama48 Costa Rica47 Kenya47 France41 Bahamas36 Dominica35 New Zealand34 Cambodia31 Czechoslovakia30 Japan30 Belgium27 Taiwan25 North Macedonia (Macedonia)24 Morocco23 Sweden22 Belarus14 Sri Lanka14 West Indies13 Senegal13 Singapore13 Ireland12 Bangladesh11 Kazakhstan10 Austria9 Syria8 Barbados8 Portugal7 Latvia6 Lithuania
Grandparents responsible for own grandchildren in Clearwater
Grandparents (30 to 59 years) White / Caucasian 40 5.2% Responsible for grandchildren729 94.8% Not responsible for grandchildrenBlack or African American 93 87.3% Responsible for grandchildren13 12.7% Not responsible for grandchildrenAsian 16 100.0% Not responsible for grandchildrenOther race 163 100.0% Not responsible for grandchildrenTwo or more races 25 21.1% Responsible for grandchildren92 78.9% Not responsible for grandchildrenWhite alone, not Hispanic / Latino 148 43.6% Responsible for grandchildren191 56.4% Not responsible for grandchildrenHispanic or Latino 14 4.8% Responsible for grandchildren275 95.2% Not responsible for grandchildrenGrandparents (60 years and over) White / Caucasian 210 27.3% Responsible for grandchildren560 72.7% Not responsible for grandchildrenBlack or African American 161 57.0% Responsible for grandchildren121 43.0% Not responsible for grandchildrenOther race 7 8.7% Responsible for grandchildren77 91.3% Not responsible for grandchildrenTwo or more races 100 100.0% Not responsible for grandchildrenWhite alone, not Hispanic / Latino 136 21.7% Responsible for grandchildren489 78.3% Not responsible for grandchildrenHispanic or Latino 121 25.1% Responsible for grandchildren360 74.9% Not responsible for grandchildren