Races in City of The Dalles, Oregon (OR) Detailed Stats
Ancestries, Foreign-born residents, place of birth

Discuss City of The Dalles, Oregon races on our local forum with over 2,400,000 registered users
6.8% of City of The Dalles, OR residents are foreign-born (5.0% born in Latin America, 0.7% born in Europe), which is 31.7% less than the foreign-born rate of 9.0% across the entire state of Oregon.
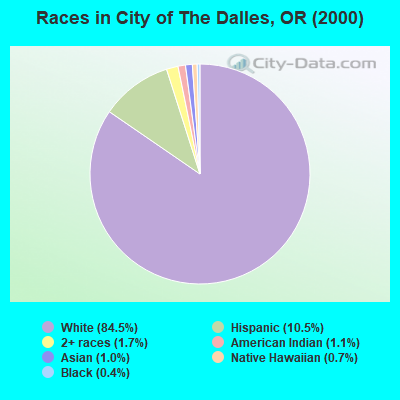
Race distribution in City of The Dalles

- 10,27184.5%White alone
- 1,27610.5%Hispanic
- 2111.7%Two or more races
- 1371.1%American Indian alone
- 1171.0%Asian alone
- 900.7%Native Hawaiian and Other
Pacific Islander alone - 450.4%Black alone
- 90.07%Other race alone
2000
2022
-
- 2,857,61683.5%White alone
- 275,3148.0%Hispanic
- 100,3332.9%Asian alone
- 82,7332.4%Two or more races
- 53,3251.6%Black alone
- 40,1301.2%American Indian alone
- 7,3980.2%Native Hawaiian and Other
Pacific Islander alone - 4,5500.1%Other race alone

-
- 3,037,57171.6%White alone
- 609,53814.4%Hispanic
- 252,7446.0%Two or more races
- 191,2834.5%Asian alone
- 78,2281.8%Black alone
- 29,3990.7%American Indian alone
- 25,7310.6%Other race alone
- 15,6430.4%Native Hawaiian and Other
Pacific Islander alone

Income and house value in City of The Dalles
- Median household income in 2022
- $65,321White non-Hispanic householders
- $133,798Black householders
- $33,412American Indian and Alaska Native householders
- $55,335Asian householders
- $118,525Native Hawaiian and other Pacific Islander householders
- $80,236Some other race householders
- $87,846Two or more races householders
- $73,785Hispanic or Latino race householders
- Median 2022 house value
- $346,164White Non-Hispanic householders
- $293,010Black or African American householders
- $157,800American Indian or Alaska Native householders
- $456,791Asian householders
- $295,336Some other race householders
- $379,718Two or more races householders
- $322,577Hispanic or Latino householders
Household income for White non-Hispanic householders

Household income for Black householders

Household income for American Indian and Alaska Native householders

Household income for Asian householders

Household income for Native Hawaiian and other Pacific Islander householders

Household income for Two or more races householders

Household income for Hispanic or Latino race householders

Foreign-born residents in City of The Dalles
831 residents are foreign born (5.0% Latin America, 0.7% Europe).
| This city: | 6.8% |
| Oregon: | 8.5% |
Ancestries in City of The Dalles

- 2,58220.0%Other
- 2,52519.6%German
- 1,69213.1%English
- 1,47811.4%Irish
- 7025.4%Norwegian
- 6985.4%United States
- 6204.8%French
- 4483.5%Swedish
- 3122.4%Dutch
- 3092.4%Scottish
- 2932.3%Scotch-Irish
- 2682.1%Italian
- 1941.5%Danish
- 1671.3%Welsh
- 1471.1%Polish
- 960.7%Czech
- 790.6%French Canadian
- 740.6%Portuguese
- 610.5%Swiss
- 570.4%Russian
- 460.4%Greek
- 280.2%Ukrainian
- 190.1%Hungarian
- 180.1%Arab

Zip codes: 97058.