Races in Chillum, Maryland (MD) Detailed Stats
Data:
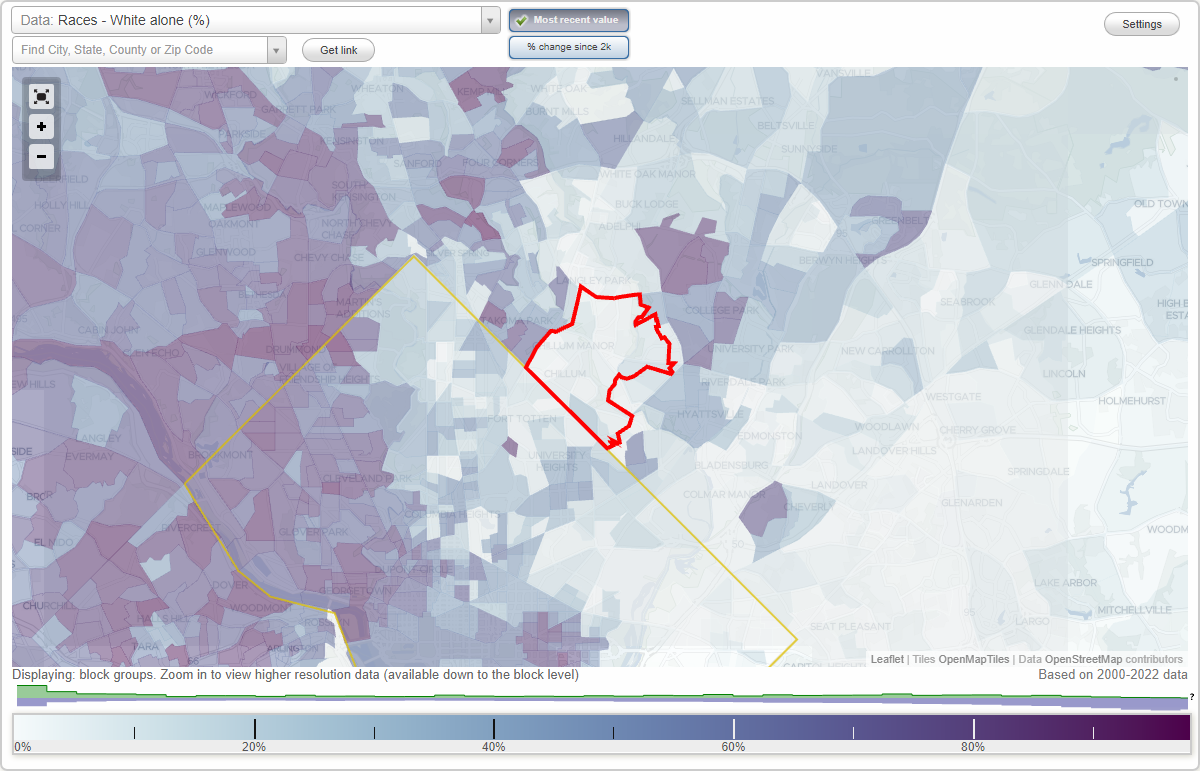
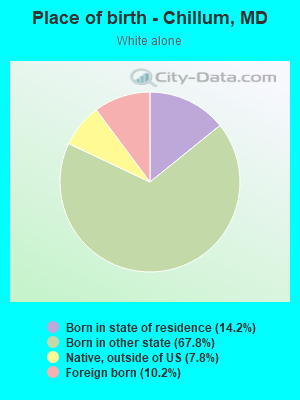
Races - White alone (%)
Races - White alone (% change since 2000)
Races - Black alone (%)
Races - Black alone (% change since 2000)
Races - American Indian alone (%)
Races - American Indian alone (% change since 2000)
Races - Asian alone (%)
Races - Asian alone (% change since 2000)
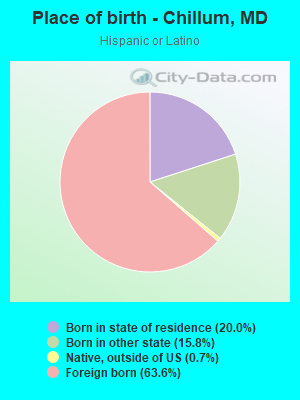
Races - Hispanic (%)
Races - Hispanic (% change since 2000)
Races - Native Hawaiian and Other Pacific Islander alone (%)
Races - Native Hawaiian and Other Pacific Islander alone (% change since 2000)
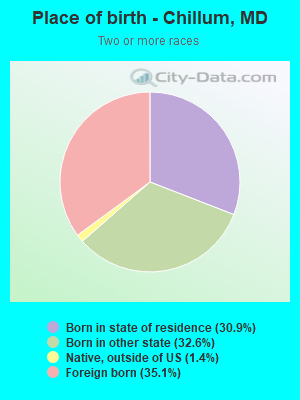
Races - Two or more races(%)
Races - Two or more races(% change since 2000)
Races - Other race alone (%)
Races - Other race alone (% change since 2000)
Racial diversity
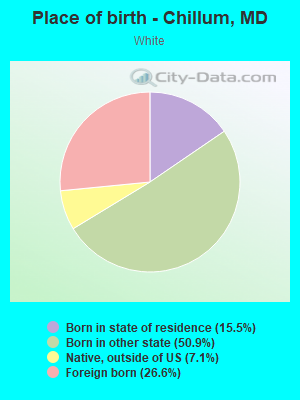
Place of birth - Born in state of residence (%)
Place of birth - Born in state of residence (%) - White
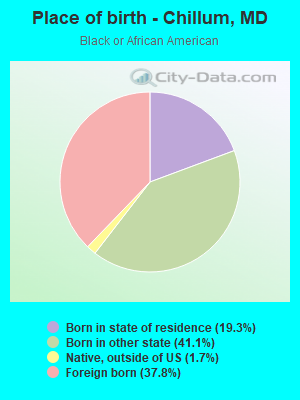
Place of birth - Born in state of residence (%) - Black or African American
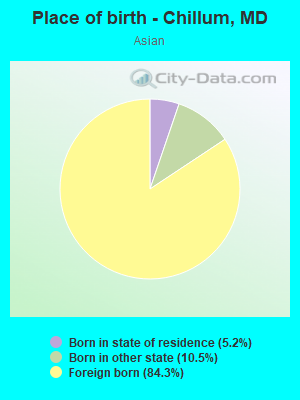
Place of birth - Born in state of residence (%) - Asian
Place of birth - Born in state of residence (%) - Hispanic or Latino
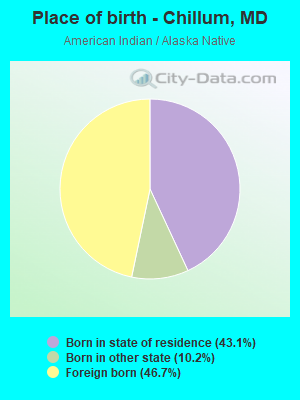
Place of birth - Born in state of residence (%) - American Indian and Alaska Native
Place of birth - Born in state of residence (%) - Multirace
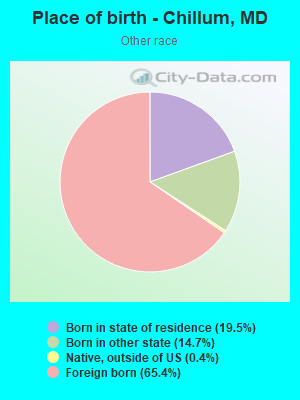
Place of birth - Born in state of residence (%) - Other Race
Place of birth - Born in other state (%)
Place of birth - Born in other state (%) - White
Place of birth - Born in other state (%) - Black or African American
Place of birth - Born in other state (%) - Asian
Place of birth - Born in other state (%) - Hispanic or Latino
Place of birth - Born in other state (%) - American Indian and Alaska Native
Place of birth - Born in other state (%) - Multirace
Place of birth - Born in other state (%) - Other Race
Place of birth - Native, outside of US (%)
Place of birth - Native, outside of US (%) - White
Place of birth - Native, outside of US (%) - Black or African American
Place of birth - Native, outside of US (%) - Asian
Place of birth - Native, outside of US (%) - Hispanic or Latino
Place of birth - Native, outside of US (%) - American Indian and Alaska Native
Place of birth - Native, outside of US (%) - Multirace
Place of birth - Native, outside of US (%) - Other Race
Place of birth - Foreign born (%)
Place of birth - Foreign born (%) - White
Place of birth - Foreign born (%) - Black or African American
Place of birth - Foreign born (%) - Asian
Place of birth - Foreign born (%) - Hispanic or Latino
Place of birth - Foreign born (%) - American Indian and Alaska Native
Place of birth - Foreign born (%) - Multirace
Place of birth - Foreign born (%) - Other Race
Residents speaking English at home (%)
Residents speaking English at home - Born in the United States (%)
Residents speaking English at home - Native, born elsewhere (%)
Residents speaking English at home - Foreign born (%)
Residents speaking Spanish at home (%)
Residents speaking Spanish at home - Born in the United States (%)
Residents speaking Spanish at home - Native, born elsewhere (%)
Residents speaking Spanish at home - Foreign born (%)
Residents speaking other language at home (%)
Residents speaking other language at home - Born in the United States (%)
Residents speaking other language at home - Native, born elsewhere (%)
Residents speaking other language at home - Foreign born (%)
Marital status - Never married (%)
Marital status - Now married (%)
Marital status - Separated (%)
Marital status - Widowed (%)
Marital status - Divorced (%)
Ancestries Reported - Arab (%)
Ancestries Reported - Czech (%)
Ancestries Reported - Danish (%)
Ancestries Reported - Dutch (%)
Ancestries Reported - English (%)
Ancestries Reported - French (%)
Ancestries Reported - French Canadian (%)
Ancestries Reported - German (%)
Ancestries Reported - Greek (%)
Ancestries Reported - Hungarian (%)
Ancestries Reported - Irish (%)
Ancestries Reported - Italian (%)
Ancestries Reported - Lithuanian (%)
Ancestries Reported - Norwegian (%)
Ancestries Reported - Polish (%)
Ancestries Reported - Portuguese (%)
Ancestries Reported - Russian (%)
Ancestries Reported - Scotch-Irish (%)
Ancestries Reported - Scottish (%)
Ancestries Reported - Slovak (%)
Ancestries Reported - Subsaharan African (%)
Ancestries Reported - Swedish (%)
Ancestries Reported - Swiss (%)
Ancestries Reported - Ukrainian (%)
Ancestries Reported - United States (%)
Ancestries Reported - Welsh (%)
Ancestries Reported - West Indian (%)
Ancestries Reported - Other (%)
Geographical mobility - Same house 1 year ago (%)
Geographical mobility - Same house 1 year ago (%) - White
Geographical mobility - Same house 1 year ago (%) - Black or African American
Geographical mobility - Same house 1 year ago (%) - Asian
Geographical mobility - Same house 1 year ago (%) - Hispanic or Latino
Geographical mobility - Same house 1 year ago (%) - American Indian and Alaska Native
Geographical mobility - Same house 1 year ago (%) - Multirace
Geographical mobility - Same house 1 year ago (%) - Other Race
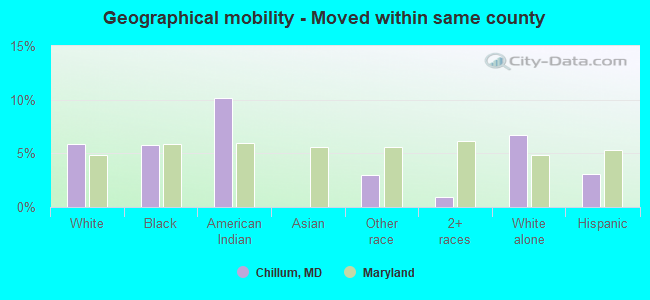
Geographical mobility - Moved within same county (%)
Geographical mobility - Moved within same county (%) - White
Geographical mobility - Moved within same county (%) - Black or African American
Geographical mobility - Moved within same county (%) - Asian
Geographical mobility - Moved within same county (%) - Hispanic or Latino
Geographical mobility - Moved within same county (%) - American Indian and Alaska Native
Geographical mobility - Moved within same county (%) - Multirace
Geographical mobility - Moved within same county (%) - Other Race
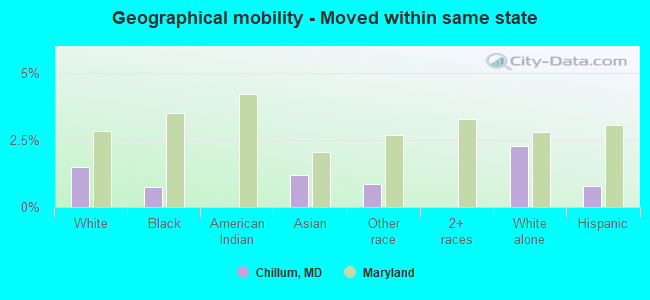
Geographical mobility - Moved from different county within same state (%)
Geographical mobility - Moved from different county within same state (%) - White
Geographical mobility - Moved from different county within same state (%) - Black or African American
Geographical mobility - Moved from different county within same state (%) - Asian
Geographical mobility - Moved from different county within same state (%) - Hispanic or Latino
Geographical mobility - Moved from different county within same state (%) - American Indian and Alaska Native
Geographical mobility - Moved from different county within same state (%) - Multirace
Geographical mobility - Moved from different county within same state (%) - Other Race
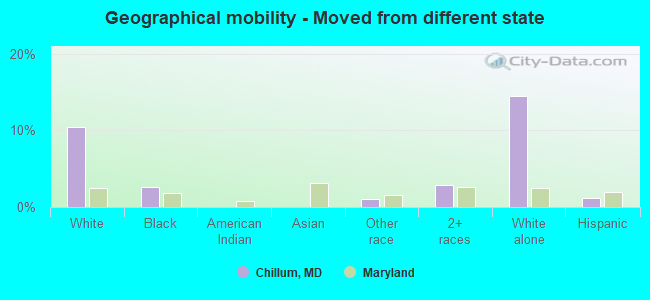
Geographical mobility - Moved from different state (%)
Geographical mobility - Moved from different state (%) - White
Geographical mobility - Moved from different state (%) - Black or African American
Geographical mobility - Moved from different state (%) - Asian
Geographical mobility - Moved from different state (%) - Hispanic or Latino
Geographical mobility - Moved from different state (%) - American Indian and Alaska Native
Geographical mobility - Moved from different state (%) - Multirace
Geographical mobility - Moved from different state (%) - Other Race
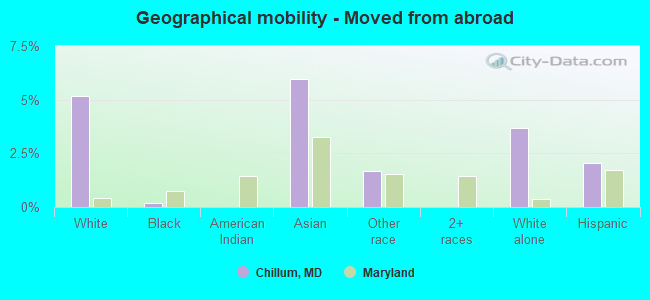
Geographical mobility - Moved from abroad (%)
Geographical mobility - Moved from abroad (%) - White
Geographical mobility - Moved from abroad (%) - Black or African American
Geographical mobility - Moved from abroad (%) - Asian
Geographical mobility - Moved from abroad (%) - Hispanic or Latino
Geographical mobility - Moved from abroad (%) - American Indian and Alaska Native
Geographical mobility - Moved from abroad (%) - Multirace
Geographical mobility - Moved from abroad (%) - Other Race
Place of birth for the foreign-born population - Ireland (%)
Place of birth for the foreign-born population - Denmark (%)
Place of birth for the foreign-born population - Norway (%)
Place of birth for the foreign-born population - Sweden (%)
Place of birth for the foreign-born population - United Kingdom (%)
Place of birth for the foreign-born population - England (%)
Place of birth for the foreign-born population - Scotland (%)
Place of birth for the foreign-born population - Other Northern Europe (%)
Place of birth for the foreign-born population - Austria (%)
Place of birth for the foreign-born population - Belgium (%)
Place of birth for the foreign-born population - France (%)
Place of birth for the foreign-born population - Germany (%)
Place of birth for the foreign-born population - Netherlands (%)
Place of birth for the foreign-born population - Switzerland (%)
Place of birth for the foreign-born population - Other Western Europe (%)
Place of birth for the foreign-born population - Greece (%)
Place of birth for the foreign-born population - Italy (%)
Place of birth for the foreign-born population - Portugal (%)
Place of birth for the foreign-born population - Spain (%)
Place of birth for the foreign-born population - Other Southern Europe (%)
Place of birth for the foreign-born population - Albania (%)
Place of birth for the foreign-born population - Belarus (%)
Place of birth for the foreign-born population - Bosnia and Herzegovina (%)
Place of birth for the foreign-born population - Bulgaria (%)
Place of birth for the foreign-born population - Croatia (%)
Place of birth for the foreign-born population - Czechoslovakia (%)
Place of birth for the foreign-born population - Hungary (%)
Place of birth for the foreign-born population - Latvia (%)
Place of birth for the foreign-born population - Lithuania (%)
Place of birth for the foreign-born population - North Macedonia (Macedonia) (%)
Place of birth for the foreign-born population - Moldova (%)
Place of birth for the foreign-born population - Poland (%)
Place of birth for the foreign-born population - Romania (%)
Place of birth for the foreign-born population - Russia (%)
Place of birth for the foreign-born population - Serbia (%)
Place of birth for the foreign-born population - Ukraine (%)
Place of birth for the foreign-born population - Other Eastern Europe (%)
Place of birth for the foreign-born population - China (%)
Place of birth for the foreign-born population - Hong Kong (%)
Place of birth for the foreign-born population - Taiwan (%)
Place of birth for the foreign-born population - Japan (%)
Place of birth for the foreign-born population - Korea (%)
Place of birth for the foreign-born population - Other Eastern Asia (%)
Place of birth for the foreign-born population - Afghanistan (%)
Place of birth for the foreign-born population - Bangladesh (%)
Place of birth for the foreign-born population - India (%)
Place of birth for the foreign-born population - Iran (%)
Place of birth for the foreign-born population - Kazakhstan (%)
Place of birth for the foreign-born population - Nepal (%)
Place of birth for the foreign-born population - Pakistan (%)
Place of birth for the foreign-born population - Sri Lanka (%)
Place of birth for the foreign-born population - Uzbekistan (%)
Place of birth for the foreign-born population - Other South Central Asia (%)
Place of birth for the foreign-born population - Burma (%)
Place of birth for the foreign-born population - Cambodia (%)
Place of birth for the foreign-born population - Indonesia (%)
Place of birth for the foreign-born population - Laos (%)
Place of birth for the foreign-born population - Malaysia (%)
Place of birth for the foreign-born population - Philippines (%)
Place of birth for the foreign-born population - Singapore (%)
Place of birth for the foreign-born population - Thailand (%)
Place of birth for the foreign-born population - Vietnam (%)
Place of birth for the foreign-born population - Other South Eastern Asia (%)
Place of birth for the foreign-born population - Armenia (%)
Place of birth for the foreign-born population - Iraq (%)
Place of birth for the foreign-born population - Israel (%)
Place of birth for the foreign-born population - Jordan (%)
Place of birth for the foreign-born population - Kuwait (%)
Place of birth for the foreign-born population - Lebanon (%)
Place of birth for the foreign-born population - Saudi Arabia (%)
Place of birth for the foreign-born population - Syria (%)
Place of birth for the foreign-born population - Turkey (%)
Place of birth for the foreign-born population - Yemen (%)
Place of birth for the foreign-born population - Other Western Asia (%)
Place of birth for the foreign-born population - Eritrea (%)
Place of birth for the foreign-born population - Ethiopia (%)
Place of birth for the foreign-born population - Kenya (%)
Place of birth for the foreign-born population - Somalia (%)
Place of birth for the foreign-born population - Uganda (%)
Place of birth for the foreign-born population - Zimbabwe (%)
Place of birth for the foreign-born population - Other Eastern Africa (%)
Place of birth for the foreign-born population - Cameroon (%)
Place of birth for the foreign-born population - Congo (%)
Place of birth for the foreign-born population - Democratic Republic of Congo (Zaire) (%)
Place of birth for the foreign-born population - Other Middle Africa (%)
Place of birth for the foreign-born population - Egypt (%)
Place of birth for the foreign-born population - Morocco (%)
Place of birth for the foreign-born population - Sudan (%)
Place of birth for the foreign-born population - Other Northern Africa (%)
Place of birth for the foreign-born population - South Africa (%)
Place of birth for the foreign-born population - Other Southern Africa (%)
Place of birth for the foreign-born population - Cabo Verde (%)
Place of birth for the foreign-born population - Ghana (%)
Place of birth for the foreign-born population - Liberia (%)
Place of birth for the foreign-born population - Nigeria (%)
Place of birth for the foreign-born population - Senegal (%)
Place of birth for the foreign-born population - Sierra Leone (%)
Place of birth for the foreign-born population - Other Western Africa (%)
Place of birth for the foreign-born population - Australia (%)
Place of birth for the foreign-born population - New Zealand (%)
Place of birth for the foreign-born population - Fiji (%)
Place of birth for the foreign-born population - Micronesia (%)
Place of birth for the foreign-born population - Bahamas (%)
Place of birth for the foreign-born population - Barbados (%)
Place of birth for the foreign-born population - Cuba (%)
Place of birth for the foreign-born population - Dominica (%)
Place of birth for the foreign-born population - Dominican Republic (%)
Place of birth for the foreign-born population - Grenada (%)
Place of birth for the foreign-born population - Haiti (%)
Place of birth for the foreign-born population - Jamaica (%)
Place of birth for the foreign-born population - St. Vincent and the Grenadines (%)
Place of birth for the foreign-born population - Trinidad and Tobago (%)
Place of birth for the foreign-born population - West Indies (%)
Place of birth for the foreign-born population - Other Caribbean (%)
Place of birth for the foreign-born population - Belize (%)
Place of birth for the foreign-born population - Costa Rica (%)
Place of birth for the foreign-born population - El Salvador (%)
Place of birth for the foreign-born population - Guatemala (%)
Place of birth for the foreign-born population - Honduras (%)
Place of birth for the foreign-born population - Mexico (%)
Place of birth for the foreign-born population - Nicaragua (%)
Place of birth for the foreign-born population - Panama (%)
Place of birth for the foreign-born population - Other Central America (%)
Place of birth for the foreign-born population - Argentina (%)
Place of birth for the foreign-born population - Bolivia (%)
Place of birth for the foreign-born population - Brazil (%)
Place of birth for the foreign-born population - Chile (%)
Place of birth for the foreign-born population - Colombia (%)
Place of birth for the foreign-born population - Ecuador (%)
Place of birth for the foreign-born population - Guyana (%)
Place of birth for the foreign-born population - Peru (%)
Place of birth for the foreign-born population - Uruguay (%)
Place of birth for the foreign-born population - Venezuela (%)
Place of birth for the foreign-born population - Other South America (%)
Place of birth for the foreign-born population - Canada (%)
Place of birth for the foreign-born population - Other Northern America (%)
Place of birth for the foreign-born population - Other (%)
Latest news about races in Chillum, MD collected exclusively by city-data.com from local newspapers, TV, and radio stations
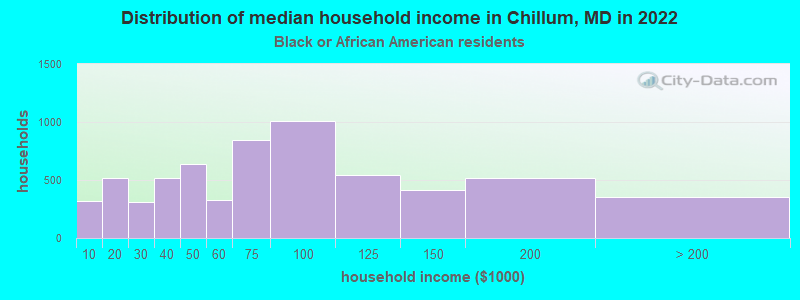
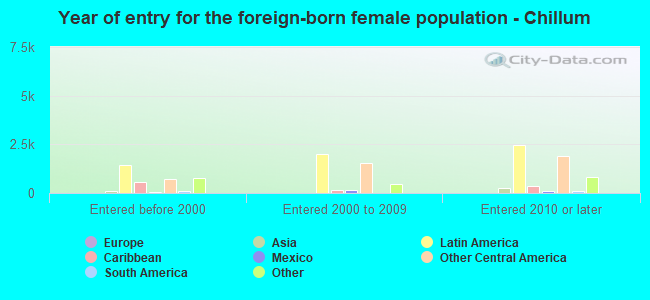
According to 2022 data, the most numerous races in Chillum, MD are White alone (1,377 residents), Black alone (14,744 residents), and Hispanic (18,181 residents). 35.2% of Chillum residents speak English at home. 50.8% of Chillum, MD residents are foreign-born (34.2% born in Latin America, 11.0% born in Africa), which is 68.5% greater than the foreign-born rate of 16.0% across the entire state of Maryland.
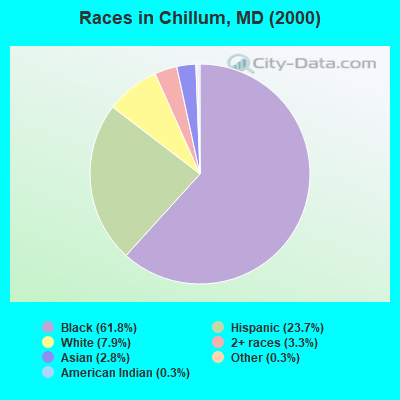
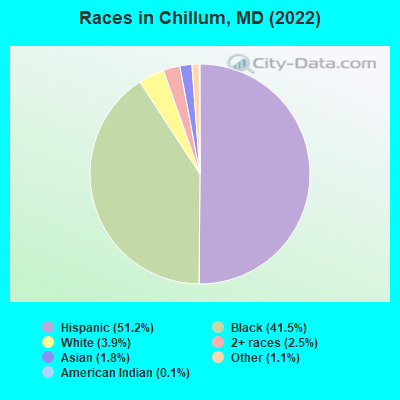
Race distribution in Chillum
2000 2022
3,286,547 62.1% White alone 1,464,735 27.7% Black alone 227,916 4.3% Hispanic 209,738 4.0% Asian alone 82,946 1.6% Two or more races 13,312 0.3% American Indian alone 9,379 0.2% Other race alone 1,913 0.04% Native Hawaiian and Other
2,906,492 47.1% White alone 1,800,914 29.2% Black alone 705,842 11.4% Hispanic 401,818 6.5% Asian alone 291,317 4.7% Two or more races 46,930 0.8% Other race alone 8,930 0.1% American Indian alone 2,417 0.04% Native Hawaiian and Other
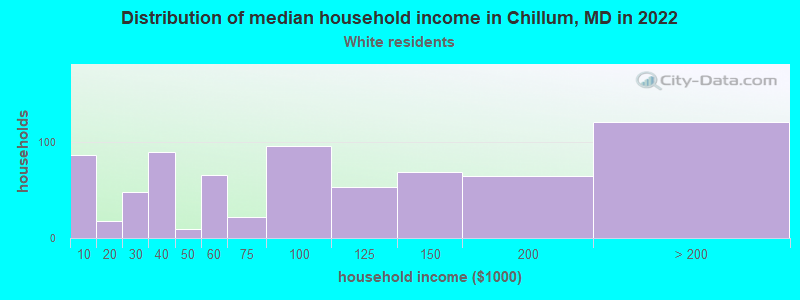
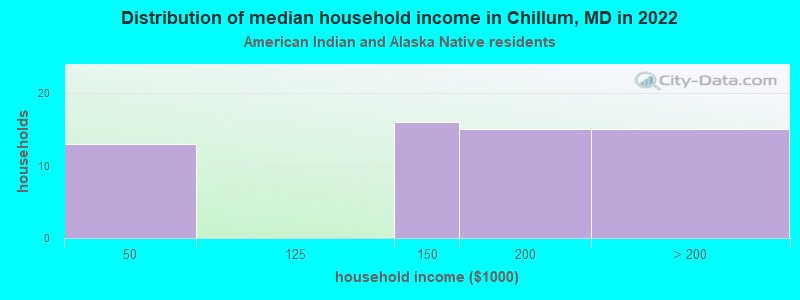
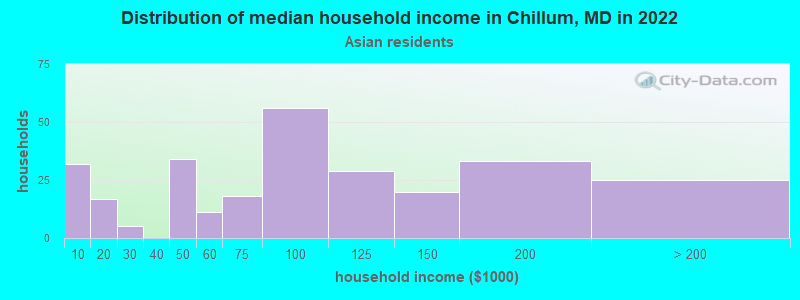
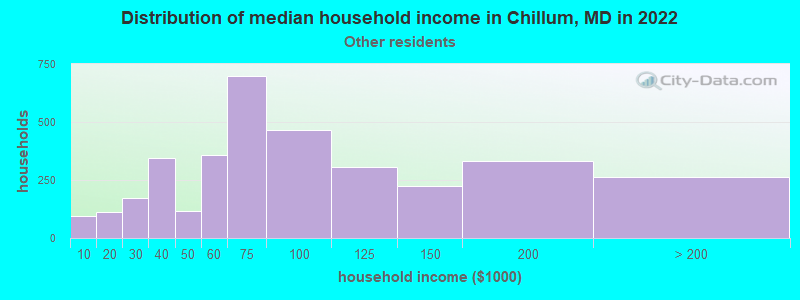
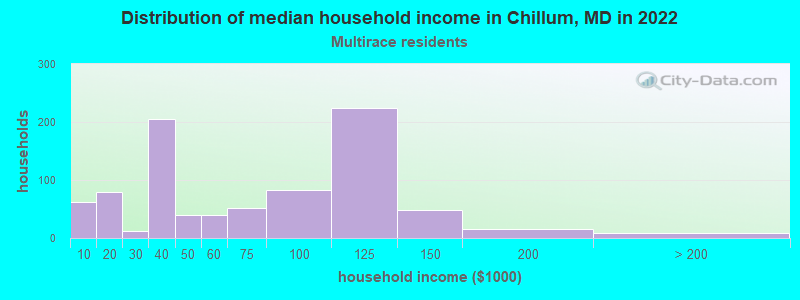
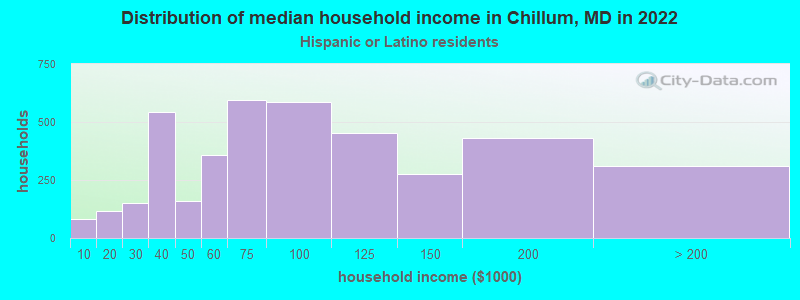
Income and house value in Chillum Median household income in 2022 $73,478 White non-Hispanic householders$70,878 Black householders$199,528 American Indian and Alaska Native householders$85,409 Asian householders$76,368 Some other race householders$55,063 Two or more races householders$78,488 Hispanic or Latino race householdersMedian 2022 house value $381,552 White Non-Hispanic householders$407,594 Black or African American householders$284,116 American Indian or Alaska Native householders $390,915 Asian householders$396,767 Some other race householders$411,983 Two or more races householders$393,841 Hispanic or Latino householders
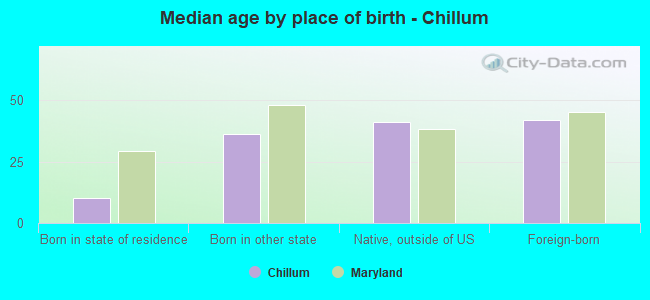
Median age by race in Chillum
39.7 Median age for White residents41.8 36.7 43.1 Median age for Black or African American residents39.9 46.9 41.9 Median age for American Indian / Alaska Native residents77.4 23.0 36.7 Median age for Asian residents36.1 34.1 -571,600,480.8 Median age for Native Hawaiian / Pacific Islander residents-720,061,021.4 -760,942,760.2 28.7 Median age for Other race residents31.3 27.7 31.5 Median age for Two or more races residents18.7 36.7 39.4 Median age for White alone residents36.7 53.1 29.8 Median age for Hispanic or Latino residents33.0 28.0
Owner/renter occupied households by race in Chillum
House owners and renters - White residents 384 50.1% Owner occupied382 49.9% Renter occupiedHouse owners and renters - Black or African American residents 2,301 37.0% Owner occupied3,912 63.0% Renter occupiedHouse owners and renters - American Indian / Alaska Native residents 50 93.4% Owner occupied4 6.6% Renter occupiedHouse owners and renters - Asian residents 192 71.9% Owner occupied75 28.1% Renter occupiedHouse owners and renters - Other race residents 1,609 47.1% Owner occupied1,804 52.9% Renter occupiedHouse owners and renters - Two or more races residents 223 26.4% Owner occupied622 73.6% Renter occupiedHouse owners and renters - White alone residents 279 49.9% Owner occupied280 50.1% Renter occupiedHouse owners and renters - Hispanic or Latino residents 1,913 46.8% Owner occupied2,178 53.2% Renter occupied
Language usage in Chillum
English speakers - Total 35.2% of residents of Chillum speak English at home.
48.2% of residents speak Spanish at home 5,374 34.1% Speak English very well10,399 65.9% Speak English less than very well19.6% of residents speak other language at home 4,199 65.4% Speak English very well2,220 34.6% Speak English less than very well
English speakers - Born in the United States 74.2% of residents of Chillum speak English at home.
20.8% of residents speak Spanish at home 1,858 89.8% Speak English very well211 10.2% Speak English less than very well7.5% of residents speak other language at home 749 100.0% Speak English very well
English speakers - Native, born elsewhere 64.2% of residents of Chillum speak English at home.
28.3% of residents speak Spanish at home 62 43.1% Speak English very well82 56.9% Speak English less than very well4.9% of residents speak other language at home 25 100.0% Speak English very well
English speakers - Foreign-born 10.1% of residents of Chillum speak English at home.
61.6% of residents speak Spanish at home 1,608 14.5% Speak English very well9,504 85.5% Speak English less than very well26.4% of residents speak other language at home 2,670 56.0% Speak English very well2,098 44.0% Speak English less than very well
White (Caucasian) - Speak only English Native:
75.9% (1,031)Foreign-born:
13.5% (65)
White (Caucasian) - Speak another language Native:
22.8% (310)Foreign-born:
82.3% (398)
Black or African American - Speak only English Native:
85.8% (7,623)Foreign-born:
23.2% (1,370)
Black or African American - Speak another language Native:
15.7% (1,393)Foreign-born:
78.7% (4,644)
American Indian / Alaska Native - Speak only English Native:
21.5% (13)Foreign-born:
1.9% (2)
American Indian / Alaska Native - Speak another language Native:
93.3% (55)Foreign-born:
98.0% (116)
Asian - Speak only English Native:
35.8% (35)Foreign-born:
22.9% (110)
Asian - Speak another language Native:
66.4% (66)Foreign-born:
78.9% (379)
Other race - Speak only English Native:
10.7% (420)Foreign-born:
2.1% (210)
Other race - Speak another language Native:
88.5% (3,481)Foreign-born:
98.1% (9,865)
Two or more races - Speak only English Native:
43.3% (781)Foreign-born:
2.8% (31)
Two or more races - Speak another language Native:
60.0% (1,083)Foreign-born:
100.0% (1,134)
White alone - Speak only English Native:
82.1% (1,014)Foreign-born:
11.6% (16)
White alone - Speak another language Native:
20.7% (256)Foreign-born:
87.2% (121)
Hispanic or Latino - Speak only English Native:
10.3% (499)Foreign-born:
2.1% (235)
Hispanic or Latino - Speak another language Native:
88.7% (4,307)Foreign-born:
98.3% (11,150)
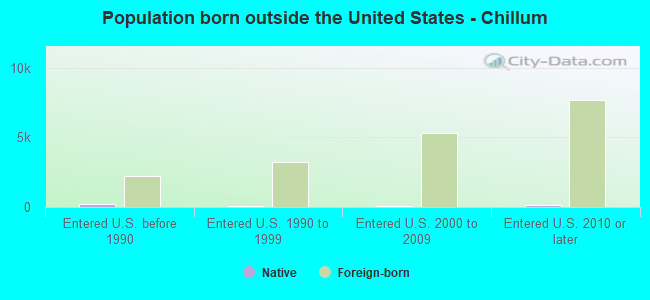
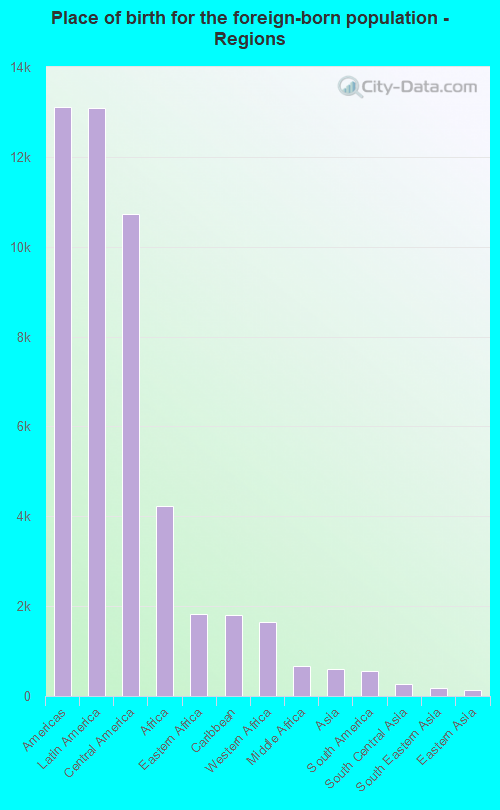
Foreign-born residents in Chillum 18,035 residents are foreign born (34.2% Latin America , 11.0% Africa ).
This city:
50.8%Maryland:
15.7%
Marital status for residents in Chillum Marital status - White (Caucasian) population 15 years and over
Males 51.2% Never married34.6% Now married2.4% Separated1.0% Widowed10.9% DivorcedFemales 41.5% Never married50.3% Now married0.0% Separated5.2% Widowed3.0% DivorcedWomen who gave birth in the past 12 months Now married:
100.0% (9)Unmarried:
0.0% (0)
Women who did not give birth in the past 12 months Now married:
36.4% (182)Unmarried:
63.6% (318)
Marital status - Black or African American population 15 years and over
Males 39.0% Never married46.3% Now married4.2% Separated2.6% Widowed7.8% DivorcedFemales 40.4% Never married30.1% Now married3.6% Separated11.5% Widowed14.3% DivorcedWomen who gave birth in the past 12 months Now married:
66.1% (110)Unmarried:
33.9% (56)
Women who did not give birth in the past 12 months Now married:
31.4% (903)Unmarried:
68.6% (1,974)
Marital status - American Indian / Alaska Native population 15 years and over
Males 37.1% Never married40.3% Now married0.0% Separated0.0% Widowed22.6% DivorcedFemales 51.4% Never married40.0% Now married0.0% Separated5.7% Widowed2.9% DivorcedWomen who gave birth in the past 12 months Now married:
100.0% (4)Unmarried:
0.0% (0)
Women who did not give birth in the past 12 months Now married:
28.6% (9)Unmarried:
71.4% (22)
Marital status - Asian population 15 years and over
Males 15.8% Never married62.9% Now married0.0% Separated0.0% Widowed21.2% DivorcedFemales 17.8% Never married70.6% Now married0.0% Separated7.9% Widowed3.6% DivorcedWomen who did not give birth in the past 12 months Now married:
70.2% (144)Unmarried:
29.8% (61)
Marital status - Other race population 15 years and over
Males 55.5% Never married40.2% Now married1.9% Separated0.6% Widowed1.8% DivorcedFemales 53.2% Never married37.7% Now married1.0% Separated4.4% Widowed3.8% DivorcedWomen who gave birth in the past 12 months Now married:
66.1% (164)Unmarried:
33.9% (84)
Women who did not give birth in the past 12 months Now married:
37.3% (1,463)Unmarried:
62.7% (2,464)
Marital status - Two or more races population 15 years and over
Males 44.3% Never married37.0% Now married6.3% Separated8.7% Widowed3.7% DivorcedFemales 57.6% Never married24.1% Now married0.0% Separated5.8% Widowed12.5% DivorcedWomen who gave birth in the past 12 months Now married:
21.3% (21)Unmarried:
78.7% (76)
Women who did not give birth in the past 12 months Now married:
21.3% (147)Unmarried:
78.7% (543)
Marital status - White alone, not Hispanic / Latino population 15 years and over
Males 52.5% Never married31.0% Now married3.6% Separated0.0% Widowed12.9% DivorcedFemales 44.0% Never married45.0% Now married0.0% Separated8.1% Widowed2.9% DivorcedWomen who gave birth in the past 12 months Now married:
100.0% (10)Unmarried:
0.0% (0)
Women who did not give birth in the past 12 months Now married:
31.5% (95)Unmarried:
68.5% (207)
Marital status - Hispanic or Latino population 15 years and over
Males 53.9% Never married41.3% Now married1.9% Separated0.7% Widowed2.3% DivorcedFemales 53.6% Never married38.4% Now married0.8% Separated3.3% Widowed3.9% DivorcedWomen who gave birth in the past 12 months Now married:
53.8% (175)Unmarried:
46.2% (150)
Women who did not give birth in the past 12 months Now married:
36.7% (1,601)Unmarried:
63.3% (2,766)
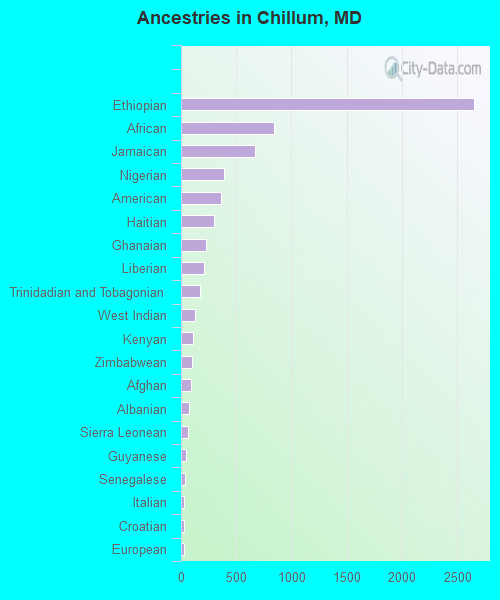
Ancestries in Chillum
2,656 9.5% Ethiopian844 3.0% African668 2.4% Jamaican393 1.4% Nigerian359 1.3% American297 1.1% Haitian229 0.8% Ghanaian204 0.7% Liberian171 0.6% Trinidadian and Tobagonian131 0.5% West Indian109 0.4% Kenyan98 0.3% Zimbabwean89 0.3% Afghan75 0.3% Albanian64 0.2% Sierra Leonean43 0.2% Guyanese36 0.1% Senegalese29 0.1% Italian27 0.10% Croatian25 0.09% European24 0.09% Irish17 0.06% English15 0.05% German15 0.05% Ukrainian11 0.04% Turkish10 0.04% Hungarian8 0.03% Scotch-Irish7 0.02% British6 0.02% South African4 0.01% Romanian3 0.01% Armenian2 0.01% Russian
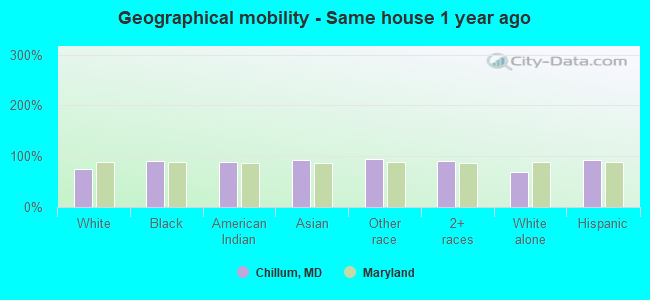
Geographical mobility in Chillum Same house 1 year ago 1,493 75.8% White (Caucasian)13,466 90.2% Black or African American176 88.8% American Indian / Alaska Native597 92.7% Asian14,532 94.0% Other race2,804 90.3% Two or more races948 69.2% White alone, not Hispanic / Latino16,710 93.6% Hispanic or LatinoMoved within same county 115 5.8% White / Caucasian861 5.8% Black or African American20 10.1% American Indian / Alaska Native461 3.0% Other race30 1.0% Two or more races92 6.7% White alone, not Hispanic / Latino552 3.1% Hispanic or LatinoMoved within same state 29 1.5% White / Caucasian113 0.8% Black or African American8 1.2% Asian135 0.9% Other race31 2.3% White alone, not Hispanic / Latino137 0.8% Hispanic or LatinoMoved from different state 206 10.5% White / Caucasian385 2.6% Black or African American162 1.1% Other race87 2.8% Two or more races198 14.5% White alone, not Hispanic / Latino203 1.1% Hispanic or LatinoMoved from abroad 102 5.2% White30 0.2% Black or African American38 5.9% Asian263 1.7% Other race50 3.7% White alone, not Hispanic / Latino367 2.1% Hispanic or Latino
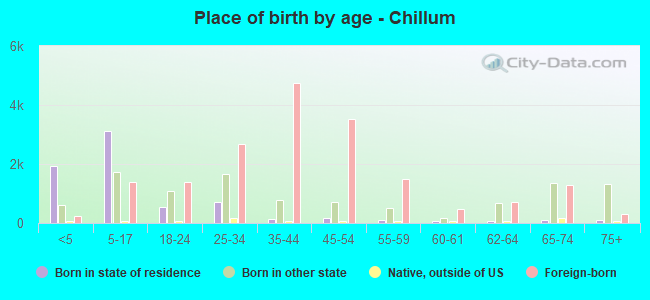
Children Nativity (place of birth) in Chillum
Children under 6 years - Living with two parents Both parents native 32 100.0% NativeBoth parents foreign-born 1,234 94.4% Native74 5.6% Foreign-bornOne native, one foreign-born parent 84 100.0% NativeChildren under 6 years - Living with one parent Native parent 231 99.8% Native1 0.2% Foreign-bornForeign-born parent 1,106 88.4% Native146 11.6% Foreign-bornChildren 6 to 17 years - Living with two parents Both parents native 2 100.0% Foreign-bornBoth parents foreign-born 2,372 81.2% Native550 18.8% Foreign-bornOne native, one foreign-born parent 214 100.0% NativeChildren 6 to 17 years - Living with one parent Foreign-born parent 2,111 58.2% Native1,513 41.8% Foreign-born
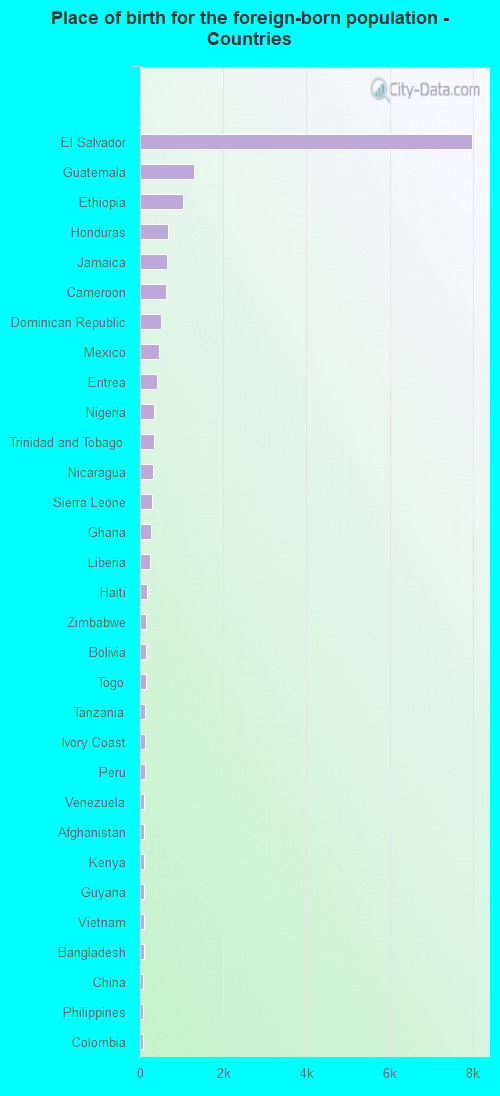
Place of birth for residents in Chillum 13,113 Americas13,085 Latin America10,734 Central America4,221 Africa1,819 Eastern Africa1,801 Caribbean1,643 Western Africa661 Middle Africa593 Asia549 South America259 South Central Asia185 South Eastern Asia130 Eastern Asia108 China105 Europe91 Eastern Europe28 Northern America19 Western Asia13 Southern Europe6 Southern Africa7,990 El Salvador1,298 Guatemala1,036 Ethiopia662 Honduras654 Jamaica635 Cameroon509 Dominican Republic463 Mexico402 Eritrea345 Nigeria336 Trinidad and Tobago318 Nicaragua289 Sierra Leone253 Ghana237 Liberia158 Haiti151 Zimbabwe141 Bolivia135 Togo132 Tanzania119 Ivory Coast109 Peru101 Venezuela98 Afghanistan97 Kenya93 Guyana92 Vietnam89 Bangladesh83 China76 Philippines75 Colombia46 Cuba45 Senegal43 Nepal42 Barbados37 St. Lucia28 Canada26 Argentina25 Hong Kong21 Korea19 Pakistan15 Cambodia13 Ukraine13 Italy13 Grenada11 Turkey10 Congo9 Romania7 Russia7 Saudi Arabia6 South Africa3 Iran2 India
Grandparents responsible for own grandchildren in Chillum
Grandparents (30 to 59 years) White / Caucasian 6 100.0% Not responsible for grandchildrenBlack or African American 107 70.1% Responsible for grandchildren46 29.9% Not responsible for grandchildrenOther race 233 47.2% Responsible for grandchildren261 52.8% Not responsible for grandchildrenTwo or more races 25 100.0% Not responsible for grandchildrenHispanic or Latino 219 43.1% Responsible for grandchildren288 56.9% Not responsible for grandchildrenGrandparents (60 years and over) Black or African American 95 27.8% Responsible for grandchildren247 72.2% Not responsible for grandchildrenOther race 70 36.7% Responsible for grandchildren122 63.3% Not responsible for grandchildrenHispanic or Latino 63 30.1% Responsible for grandchildren146 69.9% Not responsible for grandchildren