Races in Cheval, Florida (FL) Detailed Stats
Data:
Races - White alone (%)
Races - White alone (% change since 2000)
Races - Black alone (%)
Races - Black alone (% change since 2000)
Races - American Indian alone (%)
Races - American Indian alone (% change since 2000)
Races - Asian alone (%)
Races - Asian alone (% change since 2000)
Races - Hispanic (%)
Races - Hispanic (% change since 2000)
Races - Native Hawaiian and Other Pacific Islander alone (%)
Races - Native Hawaiian and Other Pacific Islander alone (% change since 2000)
Races - Two or more races(%)
Races - Two or more races(% change since 2000)
Races - Other race alone (%)
Races - Other race alone (% change since 2000)
Racial diversity
Place of birth - Born in state of residence (%)
Place of birth - Born in state of residence (%) - White
Place of birth - Born in state of residence (%) - Black or African American
Place of birth - Born in state of residence (%) - Asian
Place of birth - Born in state of residence (%) - Hispanic or Latino
Place of birth - Born in state of residence (%) - American Indian and Alaska Native
Place of birth - Born in state of residence (%) - Multirace
Place of birth - Born in state of residence (%) - Other Race
Place of birth - Born in other state (%)
Place of birth - Born in other state (%) - White
Place of birth - Born in other state (%) - Black or African American
Place of birth - Born in other state (%) - Asian
Place of birth - Born in other state (%) - Hispanic or Latino
Place of birth - Born in other state (%) - American Indian and Alaska Native
Place of birth - Born in other state (%) - Multirace
Place of birth - Born in other state (%) - Other Race
Place of birth - Native, outside of US (%)
Place of birth - Native, outside of US (%) - White
Place of birth - Native, outside of US (%) - Black or African American
Place of birth - Native, outside of US (%) - Asian
Place of birth - Native, outside of US (%) - Hispanic or Latino
Place of birth - Native, outside of US (%) - American Indian and Alaska Native
Place of birth - Native, outside of US (%) - Multirace
Place of birth - Native, outside of US (%) - Other Race
Place of birth - Foreign born (%)
Place of birth - Foreign born (%) - White
Place of birth - Foreign born (%) - Black or African American
Place of birth - Foreign born (%) - Asian
Place of birth - Foreign born (%) - Hispanic or Latino
Place of birth - Foreign born (%) - American Indian and Alaska Native
Place of birth - Foreign born (%) - Multirace
Place of birth - Foreign born (%) - Other Race
Residents speaking English at home (%)
Residents speaking English at home - Born in the United States (%)
Residents speaking English at home - Native, born elsewhere (%)
Residents speaking English at home - Foreign born (%)
Residents speaking Spanish at home (%)
Residents speaking Spanish at home - Born in the United States (%)
Residents speaking Spanish at home - Native, born elsewhere (%)
Residents speaking Spanish at home - Foreign born (%)
Residents speaking other language at home (%)
Residents speaking other language at home - Born in the United States (%)
Residents speaking other language at home - Native, born elsewhere (%)
Residents speaking other language at home - Foreign born (%)
Marital status - Never married (%)
Marital status - Now married (%)
Marital status - Separated (%)
Marital status - Widowed (%)
Marital status - Divorced (%)
Ancestries Reported - Arab (%)
Ancestries Reported - Czech (%)
Ancestries Reported - Danish (%)
Ancestries Reported - Dutch (%)
Ancestries Reported - English (%)
Ancestries Reported - French (%)
Ancestries Reported - French Canadian (%)
Ancestries Reported - German (%)
Ancestries Reported - Greek (%)
Ancestries Reported - Hungarian (%)
Ancestries Reported - Irish (%)
Ancestries Reported - Italian (%)
Ancestries Reported - Lithuanian (%)
Ancestries Reported - Norwegian (%)
Ancestries Reported - Polish (%)
Ancestries Reported - Portuguese (%)
Ancestries Reported - Russian (%)
Ancestries Reported - Scotch-Irish (%)
Ancestries Reported - Scottish (%)
Ancestries Reported - Slovak (%)
Ancestries Reported - Subsaharan African (%)
Ancestries Reported - Swedish (%)
Ancestries Reported - Swiss (%)
Ancestries Reported - Ukrainian (%)
Ancestries Reported - United States (%)
Ancestries Reported - Welsh (%)
Ancestries Reported - West Indian (%)
Ancestries Reported - Other (%)
Geographical mobility - Same house 1 year ago (%)
Geographical mobility - Same house 1 year ago (%) - White
Geographical mobility - Same house 1 year ago (%) - Black or African American
Geographical mobility - Same house 1 year ago (%) - Asian
Geographical mobility - Same house 1 year ago (%) - Hispanic or Latino
Geographical mobility - Same house 1 year ago (%) - American Indian and Alaska Native
Geographical mobility - Same house 1 year ago (%) - Multirace
Geographical mobility - Same house 1 year ago (%) - Other Race
Geographical mobility - Moved within same county (%)
Geographical mobility - Moved within same county (%) - White
Geographical mobility - Moved within same county (%) - Black or African American
Geographical mobility - Moved within same county (%) - Asian
Geographical mobility - Moved within same county (%) - Hispanic or Latino
Geographical mobility - Moved within same county (%) - American Indian and Alaska Native
Geographical mobility - Moved within same county (%) - Multirace
Geographical mobility - Moved within same county (%) - Other Race
Geographical mobility - Moved from different county within same state (%)
Geographical mobility - Moved from different county within same state (%) - White
Geographical mobility - Moved from different county within same state (%) - Black or African American
Geographical mobility - Moved from different county within same state (%) - Asian
Geographical mobility - Moved from different county within same state (%) - Hispanic or Latino
Geographical mobility - Moved from different county within same state (%) - American Indian and Alaska Native
Geographical mobility - Moved from different county within same state (%) - Multirace
Geographical mobility - Moved from different county within same state (%) - Other Race
Geographical mobility - Moved from different state (%)
Geographical mobility - Moved from different state (%) - White
Geographical mobility - Moved from different state (%) - Black or African American
Geographical mobility - Moved from different state (%) - Asian
Geographical mobility - Moved from different state (%) - Hispanic or Latino
Geographical mobility - Moved from different state (%) - American Indian and Alaska Native
Geographical mobility - Moved from different state (%) - Multirace
Geographical mobility - Moved from different state (%) - Other Race
Geographical mobility - Moved from abroad (%)
Geographical mobility - Moved from abroad (%) - White
Geographical mobility - Moved from abroad (%) - Black or African American
Geographical mobility - Moved from abroad (%) - Asian
Geographical mobility - Moved from abroad (%) - Hispanic or Latino
Geographical mobility - Moved from abroad (%) - American Indian and Alaska Native
Geographical mobility - Moved from abroad (%) - Multirace
Geographical mobility - Moved from abroad (%) - Other Race
Place of birth for the foreign-born population - Ireland (%)
Place of birth for the foreign-born population - Denmark (%)
Place of birth for the foreign-born population - Norway (%)
Place of birth for the foreign-born population - Sweden (%)
Place of birth for the foreign-born population - United Kingdom (%)
Place of birth for the foreign-born population - England (%)
Place of birth for the foreign-born population - Scotland (%)
Place of birth for the foreign-born population - Other Northern Europe (%)
Place of birth for the foreign-born population - Austria (%)
Place of birth for the foreign-born population - Belgium (%)
Place of birth for the foreign-born population - France (%)
Place of birth for the foreign-born population - Germany (%)
Place of birth for the foreign-born population - Netherlands (%)
Place of birth for the foreign-born population - Switzerland (%)
Place of birth for the foreign-born population - Other Western Europe (%)
Place of birth for the foreign-born population - Greece (%)
Place of birth for the foreign-born population - Italy (%)
Place of birth for the foreign-born population - Portugal (%)
Place of birth for the foreign-born population - Spain (%)
Place of birth for the foreign-born population - Other Southern Europe (%)
Place of birth for the foreign-born population - Albania (%)
Place of birth for the foreign-born population - Belarus (%)
Place of birth for the foreign-born population - Bosnia and Herzegovina (%)
Place of birth for the foreign-born population - Bulgaria (%)
Place of birth for the foreign-born population - Croatia (%)
Place of birth for the foreign-born population - Czechoslovakia (%)
Place of birth for the foreign-born population - Hungary (%)
Place of birth for the foreign-born population - Latvia (%)
Place of birth for the foreign-born population - Lithuania (%)
Place of birth for the foreign-born population - North Macedonia (Macedonia) (%)
Place of birth for the foreign-born population - Moldova (%)
Place of birth for the foreign-born population - Poland (%)
Place of birth for the foreign-born population - Romania (%)
Place of birth for the foreign-born population - Russia (%)
Place of birth for the foreign-born population - Serbia (%)
Place of birth for the foreign-born population - Ukraine (%)
Place of birth for the foreign-born population - Other Eastern Europe (%)
Place of birth for the foreign-born population - China (%)
Place of birth for the foreign-born population - Hong Kong (%)
Place of birth for the foreign-born population - Taiwan (%)
Place of birth for the foreign-born population - Japan (%)
Place of birth for the foreign-born population - Korea (%)
Place of birth for the foreign-born population - Other Eastern Asia (%)
Place of birth for the foreign-born population - Afghanistan (%)
Place of birth for the foreign-born population - Bangladesh (%)
Place of birth for the foreign-born population - India (%)
Place of birth for the foreign-born population - Iran (%)
Place of birth for the foreign-born population - Kazakhstan (%)
Place of birth for the foreign-born population - Nepal (%)
Place of birth for the foreign-born population - Pakistan (%)
Place of birth for the foreign-born population - Sri Lanka (%)
Place of birth for the foreign-born population - Uzbekistan (%)
Place of birth for the foreign-born population - Other South Central Asia (%)
Place of birth for the foreign-born population - Burma (%)
Place of birth for the foreign-born population - Cambodia (%)
Place of birth for the foreign-born population - Indonesia (%)
Place of birth for the foreign-born population - Laos (%)
Place of birth for the foreign-born population - Malaysia (%)
Place of birth for the foreign-born population - Philippines (%)
Place of birth for the foreign-born population - Singapore (%)
Place of birth for the foreign-born population - Thailand (%)
Place of birth for the foreign-born population - Vietnam (%)
Place of birth for the foreign-born population - Other South Eastern Asia (%)
Place of birth for the foreign-born population - Armenia (%)
Place of birth for the foreign-born population - Iraq (%)
Place of birth for the foreign-born population - Israel (%)
Place of birth for the foreign-born population - Jordan (%)
Place of birth for the foreign-born population - Kuwait (%)
Place of birth for the foreign-born population - Lebanon (%)
Place of birth for the foreign-born population - Saudi Arabia (%)
Place of birth for the foreign-born population - Syria (%)
Place of birth for the foreign-born population - Turkey (%)
Place of birth for the foreign-born population - Yemen (%)
Place of birth for the foreign-born population - Other Western Asia (%)
Place of birth for the foreign-born population - Eritrea (%)
Place of birth for the foreign-born population - Ethiopia (%)
Place of birth for the foreign-born population - Kenya (%)
Place of birth for the foreign-born population - Somalia (%)
Place of birth for the foreign-born population - Uganda (%)
Place of birth for the foreign-born population - Zimbabwe (%)
Place of birth for the foreign-born population - Other Eastern Africa (%)
Place of birth for the foreign-born population - Cameroon (%)
Place of birth for the foreign-born population - Congo (%)
Place of birth for the foreign-born population - Democratic Republic of Congo (Zaire) (%)
Place of birth for the foreign-born population - Other Middle Africa (%)
Place of birth for the foreign-born population - Egypt (%)
Place of birth for the foreign-born population - Morocco (%)
Place of birth for the foreign-born population - Sudan (%)
Place of birth for the foreign-born population - Other Northern Africa (%)
Place of birth for the foreign-born population - South Africa (%)
Place of birth for the foreign-born population - Other Southern Africa (%)
Place of birth for the foreign-born population - Cabo Verde (%)
Place of birth for the foreign-born population - Ghana (%)
Place of birth for the foreign-born population - Liberia (%)
Place of birth for the foreign-born population - Nigeria (%)
Place of birth for the foreign-born population - Senegal (%)
Place of birth for the foreign-born population - Sierra Leone (%)
Place of birth for the foreign-born population - Other Western Africa (%)
Place of birth for the foreign-born population - Australia (%)
Place of birth for the foreign-born population - New Zealand (%)
Place of birth for the foreign-born population - Fiji (%)
Place of birth for the foreign-born population - Micronesia (%)
Place of birth for the foreign-born population - Bahamas (%)
Place of birth for the foreign-born population - Barbados (%)
Place of birth for the foreign-born population - Cuba (%)
Place of birth for the foreign-born population - Dominica (%)
Place of birth for the foreign-born population - Dominican Republic (%)
Place of birth for the foreign-born population - Grenada (%)
Place of birth for the foreign-born population - Haiti (%)
Place of birth for the foreign-born population - Jamaica (%)
Place of birth for the foreign-born population - St. Vincent and the Grenadines (%)
Place of birth for the foreign-born population - Trinidad and Tobago (%)
Place of birth for the foreign-born population - West Indies (%)
Place of birth for the foreign-born population - Other Caribbean (%)
Place of birth for the foreign-born population - Belize (%)
Place of birth for the foreign-born population - Costa Rica (%)
Place of birth for the foreign-born population - El Salvador (%)
Place of birth for the foreign-born population - Guatemala (%)
Place of birth for the foreign-born population - Honduras (%)
Place of birth for the foreign-born population - Mexico (%)
Place of birth for the foreign-born population - Nicaragua (%)
Place of birth for the foreign-born population - Panama (%)
Place of birth for the foreign-born population - Other Central America (%)
Place of birth for the foreign-born population - Argentina (%)
Place of birth for the foreign-born population - Bolivia (%)
Place of birth for the foreign-born population - Brazil (%)
Place of birth for the foreign-born population - Chile (%)
Place of birth for the foreign-born population - Colombia (%)
Place of birth for the foreign-born population - Ecuador (%)
Place of birth for the foreign-born population - Guyana (%)
Place of birth for the foreign-born population - Peru (%)
Place of birth for the foreign-born population - Uruguay (%)
Place of birth for the foreign-born population - Venezuela (%)
Place of birth for the foreign-born population - Other South America (%)
Place of birth for the foreign-born population - Canada (%)
Place of birth for the foreign-born population - Other Northern America (%)
Place of birth for the foreign-born population - Other (%)
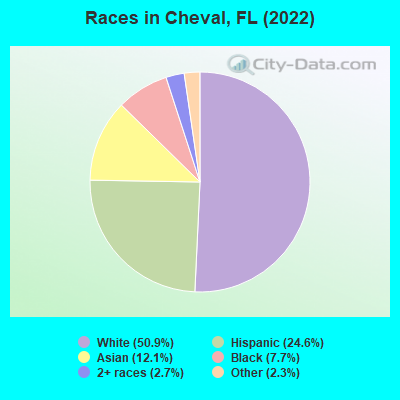
According to 2022 data, the most numerous races in Cheval, FL are White alone (6,913 residents), Hispanic (3,343 residents), and Black alone (1,046 residents). 69.4% of Cheval residents speak English at home. 16.6% of Cheval, FL residents are foreign-born (6.8% born in Asia, 6.0% born in Latin America, 1.8% born in Europe), which is 26.7% less than the foreign-born rate of 21.0% across the entire state of Florida.
Race distribution in Cheval
2000 2022
10,458,509 65.4% White alone 2,682,715 16.8% Hispanic 2,264,268 14.2% Black alone 261,693 1.6% Asian alone 236,954 1.5% Two or more races 42,358 0.3% American Indian alone 28,994 0.2% Other race alone 6,887 0.04% Native Hawaiian and Other
11,309,403 50.8% White alone 6,025,039 27.1% Hispanic 3,241,015 14.6% Black alone 861,630 3.9% Two or more races 623,692 2.8% Asian alone 152,054 0.7% Other race alone 22,504 0.1% American Indian alone 9,486 0.04% Native Hawaiian and Other
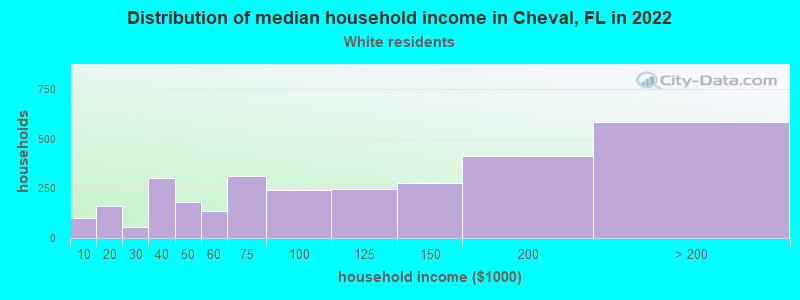
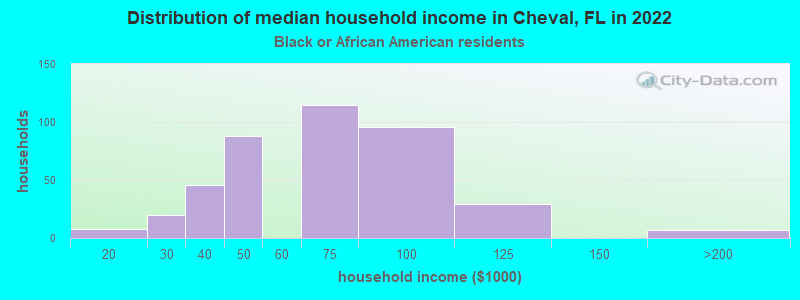
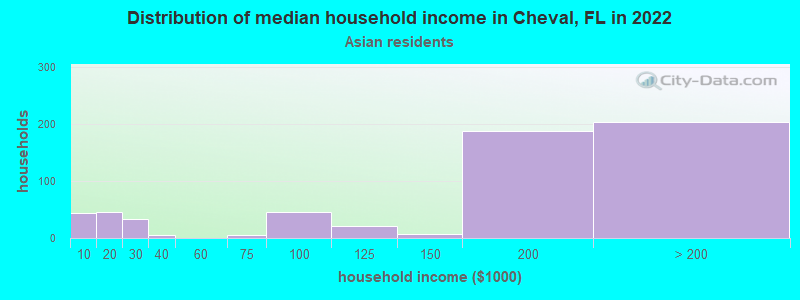
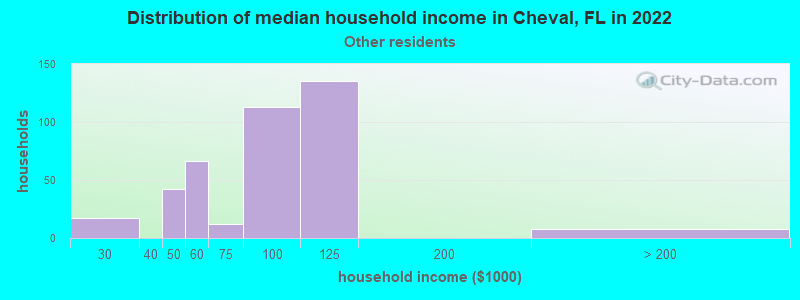
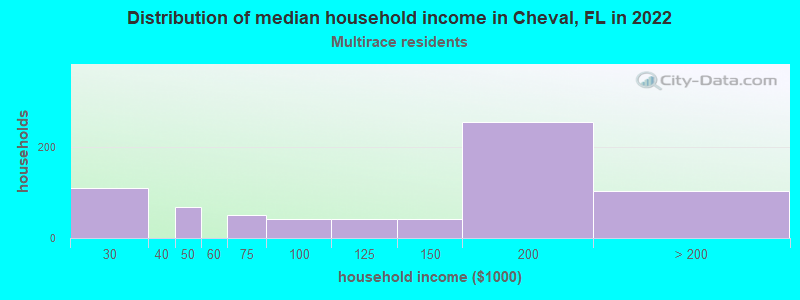
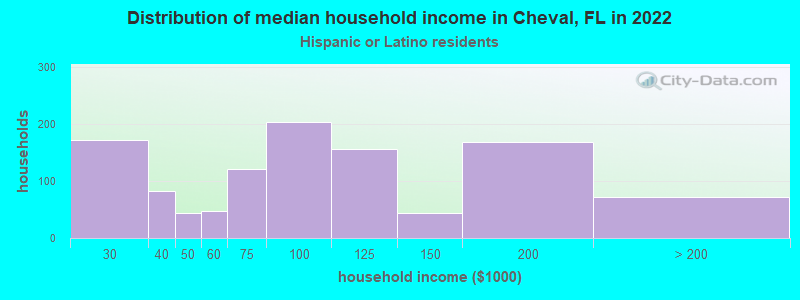
Income and house value in Cheval Median household income in 2022 $103,562 White non-Hispanic householders$71,787 Black householders$173,249 Asian householders$84,060 Some other race householders$136,988 Two or more races householders$80,622 Hispanic or Latino race householdersMedian 2022 house value $602,328 White Non-Hispanic householders$446,993 Black or African American householders $402,235 Asian householders$434,706 Some other race householders$569,857 Two or more races householders$491,750 Hispanic or Latino householders
Median age by race in Cheval
47.6 Median age for White residents43.3 50.8 33.1 Median age for Black or African American residents23.1 35.7 -670,487,105.3 Median age for American Indian / Alaska Native residents-676,245,210.1 -655,399,060.4 42.5 Median age for Asian residents44.9 38.4 23.5 Median age for Native Hawaiian / Pacific Islander residents-776,729,559.0 13.6 32.7 Median age for Other race residents48.0 31.9 26.8 Median age for Two or more races residents20.7 35.0 46.4 Median age for White alone residents44.4 48.4 33.9 Median age for Hispanic or Latino residents34.0 34.0
Owner/renter occupied households by race in Cheval
House owners and renters - White residents 1,807 61.1% Owner occupied1,151 38.9% Renter occupiedHouse owners and renters - Black or African American residents 97 24.2% Owner occupied303 75.8% Renter occupiedHouse owners and renters - Asian residents 496 86.2% Owner occupied79 13.8% Renter occupiedHouse owners and renters - Native Hawaiian / Pacific Islander residents 96 100.0% Renter occupiedHouse owners and renters - Other race residents 82 22.1% Owner occupied289 77.9% Renter occupiedHouse owners and renters - Two or more races residents 513 70.0% Owner occupied220 30.0% Renter occupiedHouse owners and renters - White alone residents 1,802 59.9% Owner occupied1,207 40.1% Renter occupiedHouse owners and renters - Hispanic or Latino residents 533 48.4% Owner occupied569 51.6% Renter occupied
Language usage in Cheval
English speakers - Total 69.4% of residents of Cheval speak English at home.
17.8% of residents speak Spanish at home 1,463 64.3% Speak English very well811 35.7% Speak English less than very well12.8% of residents speak other language at home 1,455 88.7% Speak English very well185 11.3% Speak English less than very well
English speakers - Born in the United States 89.2% of residents of Cheval speak English at home.
8.3% of residents speak Spanish at home 402 94.8% Speak English very well22 5.2% Speak English less than very well2.7% of residents speak other language at home 60 43.8% Speak English very well77 56.2% Speak English less than very well
English speakers - Native, born elsewhere 10.2% of residents of Cheval speak English at home.
84.9% of residents speak Spanish at home 242 55.0% Speak English very well198 45.0% Speak English less than very well2.5% of residents speak other language at home 13 100.0% Speak English very well
English speakers - Foreign-born 17.9% of residents of Cheval speak English at home.
31.5% of residents speak Spanish at home 270 36.6% Speak English very well468 63.4% Speak English less than very well48.8% of residents speak other language at home 1,050 91.7% Speak English very well95 8.3% Speak English less than very well
White (Caucasian) - Speak only English Native:
98.4% (6,393)Foreign-born:
39.2% (105)
White (Caucasian) - Speak another language Native:
4.0% (259)Foreign-born:
65.9% (177)
Black or African American - Speak only English Native:
100.0% (759)Foreign-born:
51.9% (98)
Asian - Speak only English Native:
34.0% (172)Foreign-born:
10.6% (104)
Asian - Speak another language Native:
69.1% (349)Foreign-born:
89.2% (872)
Other race - Speak only English Native:
39.3% (287)Foreign-born:
15.4% (60)
Other race - Speak another language Native:
61.3% (448)Foreign-born:
82.1% (319)
Two or more races - Speak only English Native:
50.9% (865)Foreign-born:
11.4% (49)
Two or more races - Speak another language Native:
49.4% (839)Foreign-born:
86.9% (375)
White alone - Speak only English Native:
95.3% (6,071)Foreign-born:
35.4% (96)
White alone - Speak another language Native:
4.6% (292)Foreign-born:
64.3% (174)
Hispanic or Latino - Speak only English Native:
44.8% (1,062)Foreign-born:
7.0% (55)
Hispanic or Latino - Speak another language Native:
55.6% (1,319)Foreign-born:
92.8% (730)
Foreign-born residents in Cheval 2,252 residents are foreign born (6.8% Asia , 6.0% Latin America , 1.8% Europe ).
This city:
16.6%Florida:
21.1%
Marital status for residents in Cheval Marital status - White (Caucasian) population 15 years and over
Males 32.2% Never married57.2% Now married0.8% Separated2.6% Widowed7.2% DivorcedFemales 26.7% Never married45.9% Now married2.8% Separated10.7% Widowed13.9% DivorcedWomen who gave birth in the past 12 months Now married:
100.0% (32)Unmarried:
0.0% (0)
Women who did not give birth in the past 12 months Now married:
42.4% (509)Unmarried:
57.6% (692)
Marital status - Black or African American population 15 years and over
Males 48.8% Never married34.4% Now married0.0% Separated0.0% Widowed16.9% DivorcedFemales 32.4% Never married46.8% Now married0.0% Separated8.1% Widowed12.7% DivorcedWomen who did not give birth in the past 12 months Now married:
56.5% (98)Unmarried:
43.5% (76)
Marital status - Asian population 15 years and over
Males 3.2% Never married94.0% Now married0.0% Separated2.8% Widowed0.0% DivorcedFemales 13.4% Never married82.6% Now married0.0% Separated2.1% Widowed1.9% DivorcedWomen who gave birth in the past 12 months Now married:
100.0% (32)Unmarried:
0.0% (0)
Women who did not give birth in the past 12 months Now married:
68.5% (188)Unmarried:
31.5% (87)
Marital status - Other race population 15 years and over
Males 38.4% Never married15.2% Now married0.0% Separated31.4% Widowed14.9% DivorcedFemales 63.1% Never married34.0% Now married0.0% Separated2.9% Widowed0.0% DivorcedWomen who did not give birth in the past 12 months Now married:
35.0% (169)Unmarried:
65.0% (313)
Marital status - Two or more races population 15 years and over
Males 57.5% Never married40.0% Now married0.0% Separated0.0% Widowed2.6% DivorcedFemales 32.3% Never married62.5% Now married0.0% Separated3.8% Widowed1.4% DivorcedWomen who did not give birth in the past 12 months Now married:
54.9% (300)Unmarried:
45.1% (246)
Marital status - White alone, not Hispanic / Latino population 15 years and over
Males 33.0% Never married56.1% Now married0.9% Separated2.6% Widowed7.5% DivorcedFemales 25.9% Never married47.1% Now married3.3% Separated11.5% Widowed12.2% DivorcedWomen who gave birth in the past 12 months Now married:
100.0% (37)Unmarried:
0.0% (0)
Women who did not give birth in the past 12 months Now married:
42.8% (535)Unmarried:
57.2% (716)
Marital status - Hispanic or Latino population 15 years and over
Males 42.4% Never married39.8% Now married0.0% Separated10.3% Widowed7.4% DivorcedFemales 50.6% Never married37.6% Now married0.0% Separated3.3% Widowed8.4% DivorcedWomen who did not give birth in the past 12 months Now married:
33.0% (336)Unmarried:
67.0% (684)
Ancestries in Cheval
529 7.7% Irish352 5.2% American346 5.1% English320 4.7% Italian318 4.7% German188 2.8% Nigerian120 1.8% Polish114 1.7% British82 1.2% Eastern European77 1.1% Greek76 1.1% Northern European66 1.0% European63 0.9% Russian59 0.9% Scottish47 0.7% Guyanese38 0.6% Iranian26 0.4% Swedish21 0.3% British West Indian20 0.3% Slovak18 0.3% French17 0.2% Palestinian17 0.2% Dutch12 0.2% Canadian12 0.2% Pennsylvania German10 0.1% Czech8 0.1% French Canadian8 0.1% Hungarian8 0.1% Jamaican5 0.07% African1 0.01% Egyptian
Geographical mobility in Cheval Same house 1 year ago 6,263 91.6% White (Caucasian)1,005 95.6% Black or African American1,575 95.5% Asian262 100.0% Native Hawaiian / Pacific Islander1,102 96.4% Other race2,360 95.4% Two or more races6,343 92.0% White alone, not Hispanic / Latino3,133 93.7% Hispanic or LatinoMoved within same county 322 4.7% White / Caucasian64 6.1% Black or African American69 4.2% Asian46 4.0% Other race82 3.3% Two or more races312 4.5% White alone, not Hispanic / Latino118 3.5% Hispanic or LatinoMoved within same state 170 2.5% White / Caucasian25 1.0% Two or more races139 2.0% White alone, not Hispanic / Latino90 2.7% Hispanic or LatinoMoved from different state 122 1.8% White / Caucasian25 1.5% Asian131 1.9% White alone, not Hispanic / Latino
Children Nativity (place of birth) in Cheval
Children under 6 years - Living with two parents Both parents native 780 100.0% NativeBoth parents foreign-born 180 100.0% NativeOne native, one foreign-born parent 43 100.0% NativeChildren under 6 years - Living with one parent Native parent 39 100.0% NativeChildren 6 to 17 years - Living with two parents Both parents native 928 100.0% NativeBoth parents foreign-born 305 79.8% Native77 20.2% Foreign-bornOne native, one foreign-born parent 270 100.0% NativeChildren 6 to 17 years - Living with one parent Native parent 414 100.0% NativeForeign-born parent 111 55.2% Native90 44.8% Foreign-born
Grandparents responsible for own grandchildren in Cheval
Grandparents (30 to 59 years) White / Caucasian 25 100.0% Responsible for grandchildrenBlack or African American 26 100.0% Responsible for grandchildrenOther race 30 100.0% Responsible for grandchildrenWhite alone, not Hispanic / Latino 30 100.0% Responsible for grandchildrenHispanic or Latino 62 100.0% Responsible for grandchildrenGrandparents (60 years and over) White / Caucasian 8 6.9% Responsible for grandchildren114 93.1% Not responsible for grandchildrenWhite alone, not Hispanic / Latino 148 100.0% Not responsible for grandchildrenHispanic or Latino 4 9.9% Responsible for grandchildren34 90.1% Not responsible for grandchildren