Races in Chesapeake, Virginia (VA) Detailed Stats
Data:
Races - White alone (%)
Races - White alone (% change since 2000)
Races - Black alone (%)
Races - Black alone (% change since 2000)
Races - American Indian alone (%)
Races - American Indian alone (% change since 2000)
Races - Asian alone (%)
Races - Asian alone (% change since 2000)
Races - Hispanic (%)
Races - Hispanic (% change since 2000)
Races - Native Hawaiian and Other Pacific Islander alone (%)
Races - Native Hawaiian and Other Pacific Islander alone (% change since 2000)
Races - Two or more races(%)
Races - Two or more races(% change since 2000)
Races - Other race alone (%)
Races - Other race alone (% change since 2000)
Racial diversity
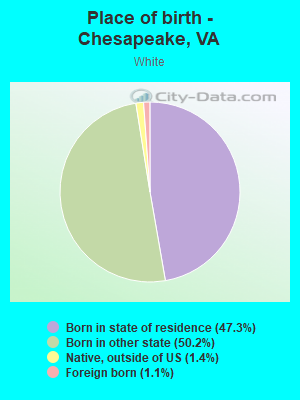
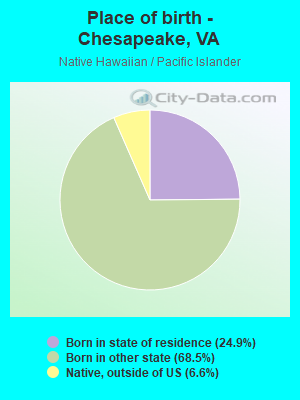
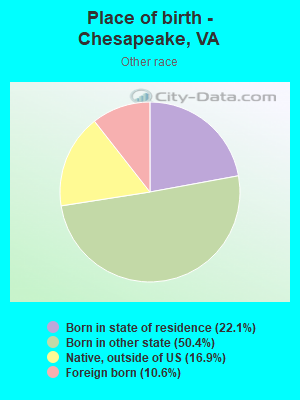
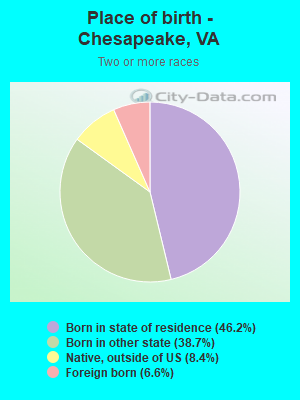
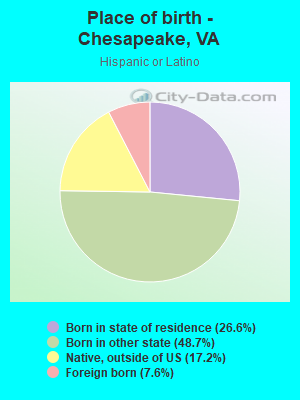
Place of birth - Born in state of residence (%)
Place of birth - Born in state of residence (%) - White
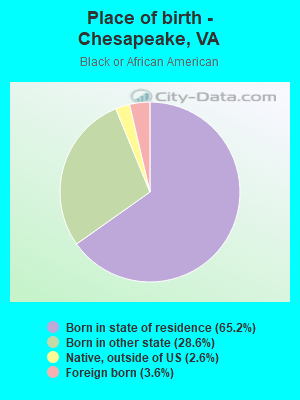
Place of birth - Born in state of residence (%) - Black or African American
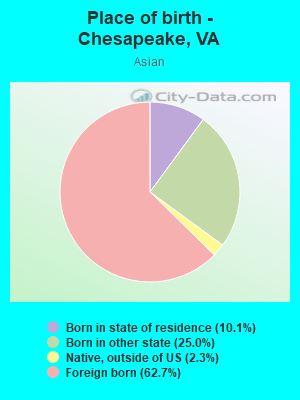
Place of birth - Born in state of residence (%) - Asian
Place of birth - Born in state of residence (%) - Hispanic or Latino
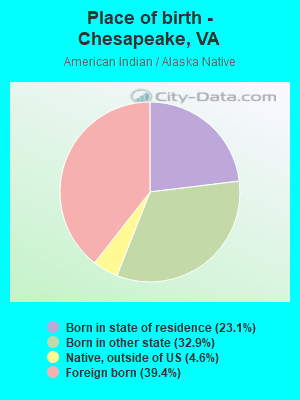
Place of birth - Born in state of residence (%) - American Indian and Alaska Native
Place of birth - Born in state of residence (%) - Multirace
Place of birth - Born in state of residence (%) - Other Race
Place of birth - Born in other state (%)
Place of birth - Born in other state (%) - White
Place of birth - Born in other state (%) - Black or African American
Place of birth - Born in other state (%) - Asian
Place of birth - Born in other state (%) - Hispanic or Latino
Place of birth - Born in other state (%) - American Indian and Alaska Native
Place of birth - Born in other state (%) - Multirace
Place of birth - Born in other state (%) - Other Race
Place of birth - Native, outside of US (%)
Place of birth - Native, outside of US (%) - White
Place of birth - Native, outside of US (%) - Black or African American
Place of birth - Native, outside of US (%) - Asian
Place of birth - Native, outside of US (%) - Hispanic or Latino
Place of birth - Native, outside of US (%) - American Indian and Alaska Native
Place of birth - Native, outside of US (%) - Multirace
Place of birth - Native, outside of US (%) - Other Race
Place of birth - Foreign born (%)
Place of birth - Foreign born (%) - White
Place of birth - Foreign born (%) - Black or African American
Place of birth - Foreign born (%) - Asian
Place of birth - Foreign born (%) - Hispanic or Latino
Place of birth - Foreign born (%) - American Indian and Alaska Native
Place of birth - Foreign born (%) - Multirace
Place of birth - Foreign born (%) - Other Race
Residents speaking English at home (%)
Residents speaking English at home - Born in the United States (%)
Residents speaking English at home - Native, born elsewhere (%)
Residents speaking English at home - Foreign born (%)
Residents speaking Spanish at home (%)
Residents speaking Spanish at home - Born in the United States (%)
Residents speaking Spanish at home - Native, born elsewhere (%)
Residents speaking Spanish at home - Foreign born (%)
Residents speaking other language at home (%)
Residents speaking other language at home - Born in the United States (%)
Residents speaking other language at home - Native, born elsewhere (%)
Residents speaking other language at home - Foreign born (%)
Marital status - Never married (%)
Marital status - Now married (%)
Marital status - Separated (%)
Marital status - Widowed (%)
Marital status - Divorced (%)
Ancestries Reported - Arab (%)
Ancestries Reported - Czech (%)
Ancestries Reported - Danish (%)
Ancestries Reported - Dutch (%)
Ancestries Reported - English (%)
Ancestries Reported - French (%)
Ancestries Reported - French Canadian (%)
Ancestries Reported - German (%)
Ancestries Reported - Greek (%)
Ancestries Reported - Hungarian (%)
Ancestries Reported - Irish (%)
Ancestries Reported - Italian (%)
Ancestries Reported - Lithuanian (%)
Ancestries Reported - Norwegian (%)
Ancestries Reported - Polish (%)
Ancestries Reported - Portuguese (%)
Ancestries Reported - Russian (%)
Ancestries Reported - Scotch-Irish (%)
Ancestries Reported - Scottish (%)
Ancestries Reported - Slovak (%)
Ancestries Reported - Subsaharan African (%)
Ancestries Reported - Swedish (%)
Ancestries Reported - Swiss (%)
Ancestries Reported - Ukrainian (%)
Ancestries Reported - United States (%)
Ancestries Reported - Welsh (%)
Ancestries Reported - West Indian (%)
Ancestries Reported - Other (%)
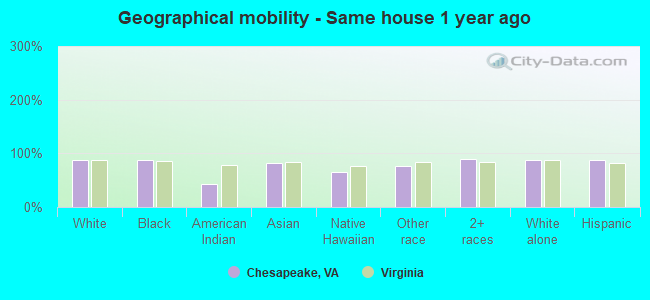
Geographical mobility - Same house 1 year ago (%)
Geographical mobility - Same house 1 year ago (%) - White
Geographical mobility - Same house 1 year ago (%) - Black or African American
Geographical mobility - Same house 1 year ago (%) - Asian
Geographical mobility - Same house 1 year ago (%) - Hispanic or Latino
Geographical mobility - Same house 1 year ago (%) - American Indian and Alaska Native
Geographical mobility - Same house 1 year ago (%) - Multirace
Geographical mobility - Same house 1 year ago (%) - Other Race
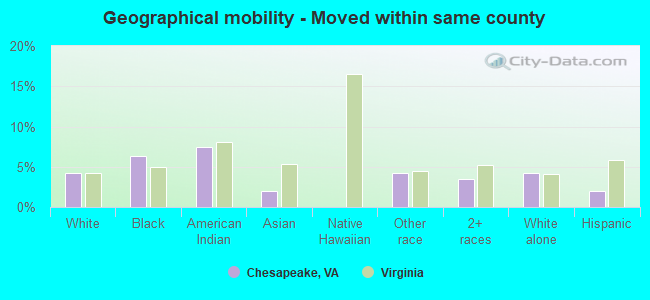
Geographical mobility - Moved within same county (%)
Geographical mobility - Moved within same county (%) - White
Geographical mobility - Moved within same county (%) - Black or African American
Geographical mobility - Moved within same county (%) - Asian
Geographical mobility - Moved within same county (%) - Hispanic or Latino
Geographical mobility - Moved within same county (%) - American Indian and Alaska Native
Geographical mobility - Moved within same county (%) - Multirace
Geographical mobility - Moved within same county (%) - Other Race
Geographical mobility - Moved from different county within same state (%)
Geographical mobility - Moved from different county within same state (%) - White
Geographical mobility - Moved from different county within same state (%) - Black or African American
Geographical mobility - Moved from different county within same state (%) - Asian
Geographical mobility - Moved from different county within same state (%) - Hispanic or Latino
Geographical mobility - Moved from different county within same state (%) - American Indian and Alaska Native
Geographical mobility - Moved from different county within same state (%) - Multirace
Geographical mobility - Moved from different county within same state (%) - Other Race
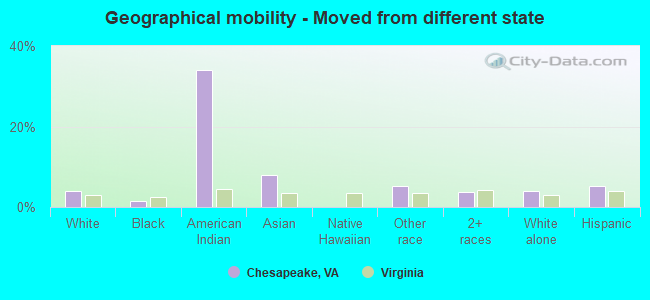
Geographical mobility - Moved from different state (%)
Geographical mobility - Moved from different state (%) - White
Geographical mobility - Moved from different state (%) - Black or African American
Geographical mobility - Moved from different state (%) - Asian
Geographical mobility - Moved from different state (%) - Hispanic or Latino
Geographical mobility - Moved from different state (%) - American Indian and Alaska Native
Geographical mobility - Moved from different state (%) - Multirace
Geographical mobility - Moved from different state (%) - Other Race
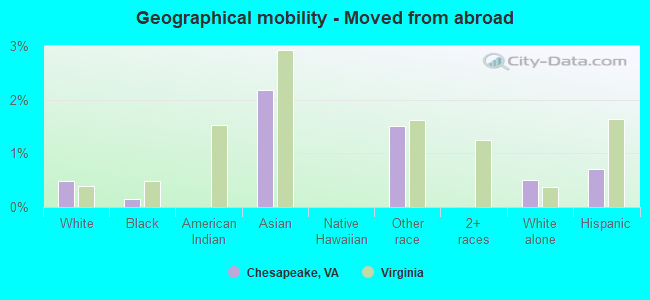
Geographical mobility - Moved from abroad (%)
Geographical mobility - Moved from abroad (%) - White
Geographical mobility - Moved from abroad (%) - Black or African American
Geographical mobility - Moved from abroad (%) - Asian
Geographical mobility - Moved from abroad (%) - Hispanic or Latino
Geographical mobility - Moved from abroad (%) - American Indian and Alaska Native
Geographical mobility - Moved from abroad (%) - Multirace
Geographical mobility - Moved from abroad (%) - Other Race
Place of birth for the foreign-born population - Ireland (%)
Place of birth for the foreign-born population - Denmark (%)
Place of birth for the foreign-born population - Norway (%)
Place of birth for the foreign-born population - Sweden (%)
Place of birth for the foreign-born population - United Kingdom (%)
Place of birth for the foreign-born population - England (%)
Place of birth for the foreign-born population - Scotland (%)
Place of birth for the foreign-born population - Other Northern Europe (%)
Place of birth for the foreign-born population - Austria (%)
Place of birth for the foreign-born population - Belgium (%)
Place of birth for the foreign-born population - France (%)
Place of birth for the foreign-born population - Germany (%)
Place of birth for the foreign-born population - Netherlands (%)
Place of birth for the foreign-born population - Switzerland (%)
Place of birth for the foreign-born population - Other Western Europe (%)
Place of birth for the foreign-born population - Greece (%)
Place of birth for the foreign-born population - Italy (%)
Place of birth for the foreign-born population - Portugal (%)
Place of birth for the foreign-born population - Spain (%)
Place of birth for the foreign-born population - Other Southern Europe (%)
Place of birth for the foreign-born population - Albania (%)
Place of birth for the foreign-born population - Belarus (%)
Place of birth for the foreign-born population - Bosnia and Herzegovina (%)
Place of birth for the foreign-born population - Bulgaria (%)
Place of birth for the foreign-born population - Croatia (%)
Place of birth for the foreign-born population - Czechoslovakia (%)
Place of birth for the foreign-born population - Hungary (%)
Place of birth for the foreign-born population - Latvia (%)
Place of birth for the foreign-born population - Lithuania (%)
Place of birth for the foreign-born population - North Macedonia (Macedonia) (%)
Place of birth for the foreign-born population - Moldova (%)
Place of birth for the foreign-born population - Poland (%)
Place of birth for the foreign-born population - Romania (%)
Place of birth for the foreign-born population - Russia (%)
Place of birth for the foreign-born population - Serbia (%)
Place of birth for the foreign-born population - Ukraine (%)
Place of birth for the foreign-born population - Other Eastern Europe (%)
Place of birth for the foreign-born population - China (%)
Place of birth for the foreign-born population - Hong Kong (%)
Place of birth for the foreign-born population - Taiwan (%)
Place of birth for the foreign-born population - Japan (%)
Place of birth for the foreign-born population - Korea (%)
Place of birth for the foreign-born population - Other Eastern Asia (%)
Place of birth for the foreign-born population - Afghanistan (%)
Place of birth for the foreign-born population - Bangladesh (%)
Place of birth for the foreign-born population - India (%)
Place of birth for the foreign-born population - Iran (%)
Place of birth for the foreign-born population - Kazakhstan (%)
Place of birth for the foreign-born population - Nepal (%)
Place of birth for the foreign-born population - Pakistan (%)
Place of birth for the foreign-born population - Sri Lanka (%)
Place of birth for the foreign-born population - Uzbekistan (%)
Place of birth for the foreign-born population - Other South Central Asia (%)
Place of birth for the foreign-born population - Burma (%)
Place of birth for the foreign-born population - Cambodia (%)
Place of birth for the foreign-born population - Indonesia (%)
Place of birth for the foreign-born population - Laos (%)
Place of birth for the foreign-born population - Malaysia (%)
Place of birth for the foreign-born population - Philippines (%)
Place of birth for the foreign-born population - Singapore (%)
Place of birth for the foreign-born population - Thailand (%)
Place of birth for the foreign-born population - Vietnam (%)
Place of birth for the foreign-born population - Other South Eastern Asia (%)
Place of birth for the foreign-born population - Armenia (%)
Place of birth for the foreign-born population - Iraq (%)
Place of birth for the foreign-born population - Israel (%)
Place of birth for the foreign-born population - Jordan (%)
Place of birth for the foreign-born population - Kuwait (%)
Place of birth for the foreign-born population - Lebanon (%)
Place of birth for the foreign-born population - Saudi Arabia (%)
Place of birth for the foreign-born population - Syria (%)
Place of birth for the foreign-born population - Turkey (%)
Place of birth for the foreign-born population - Yemen (%)
Place of birth for the foreign-born population - Other Western Asia (%)
Place of birth for the foreign-born population - Eritrea (%)
Place of birth for the foreign-born population - Ethiopia (%)
Place of birth for the foreign-born population - Kenya (%)
Place of birth for the foreign-born population - Somalia (%)
Place of birth for the foreign-born population - Uganda (%)
Place of birth for the foreign-born population - Zimbabwe (%)
Place of birth for the foreign-born population - Other Eastern Africa (%)
Place of birth for the foreign-born population - Cameroon (%)
Place of birth for the foreign-born population - Congo (%)
Place of birth for the foreign-born population - Democratic Republic of Congo (Zaire) (%)
Place of birth for the foreign-born population - Other Middle Africa (%)
Place of birth for the foreign-born population - Egypt (%)
Place of birth for the foreign-born population - Morocco (%)
Place of birth for the foreign-born population - Sudan (%)
Place of birth for the foreign-born population - Other Northern Africa (%)
Place of birth for the foreign-born population - South Africa (%)
Place of birth for the foreign-born population - Other Southern Africa (%)
Place of birth for the foreign-born population - Cabo Verde (%)
Place of birth for the foreign-born population - Ghana (%)
Place of birth for the foreign-born population - Liberia (%)
Place of birth for the foreign-born population - Nigeria (%)
Place of birth for the foreign-born population - Senegal (%)
Place of birth for the foreign-born population - Sierra Leone (%)
Place of birth for the foreign-born population - Other Western Africa (%)
Place of birth for the foreign-born population - Australia (%)
Place of birth for the foreign-born population - New Zealand (%)
Place of birth for the foreign-born population - Fiji (%)
Place of birth for the foreign-born population - Micronesia (%)
Place of birth for the foreign-born population - Bahamas (%)
Place of birth for the foreign-born population - Barbados (%)
Place of birth for the foreign-born population - Cuba (%)
Place of birth for the foreign-born population - Dominica (%)
Place of birth for the foreign-born population - Dominican Republic (%)
Place of birth for the foreign-born population - Grenada (%)
Place of birth for the foreign-born population - Haiti (%)
Place of birth for the foreign-born population - Jamaica (%)
Place of birth for the foreign-born population - St. Vincent and the Grenadines (%)
Place of birth for the foreign-born population - Trinidad and Tobago (%)
Place of birth for the foreign-born population - West Indies (%)
Place of birth for the foreign-born population - Other Caribbean (%)
Place of birth for the foreign-born population - Belize (%)
Place of birth for the foreign-born population - Costa Rica (%)
Place of birth for the foreign-born population - El Salvador (%)
Place of birth for the foreign-born population - Guatemala (%)
Place of birth for the foreign-born population - Honduras (%)
Place of birth for the foreign-born population - Mexico (%)
Place of birth for the foreign-born population - Nicaragua (%)
Place of birth for the foreign-born population - Panama (%)
Place of birth for the foreign-born population - Other Central America (%)
Place of birth for the foreign-born population - Argentina (%)
Place of birth for the foreign-born population - Bolivia (%)
Place of birth for the foreign-born population - Brazil (%)
Place of birth for the foreign-born population - Chile (%)
Place of birth for the foreign-born population - Colombia (%)
Place of birth for the foreign-born population - Ecuador (%)
Place of birth for the foreign-born population - Guyana (%)
Place of birth for the foreign-born population - Peru (%)
Place of birth for the foreign-born population - Uruguay (%)
Place of birth for the foreign-born population - Venezuela (%)
Place of birth for the foreign-born population - Other South America (%)
Place of birth for the foreign-born population - Canada (%)
Place of birth for the foreign-born population - Other Northern America (%)
Place of birth for the foreign-born population - Other (%)
Latest news about races in Chesapeake, VA collected exclusively by city-data.com from local newspapers, TV, and radio stations
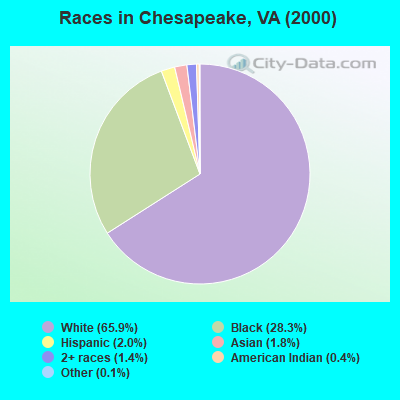
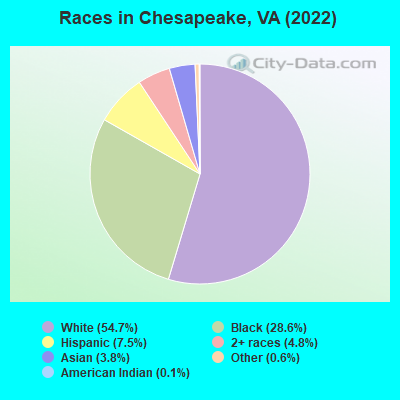
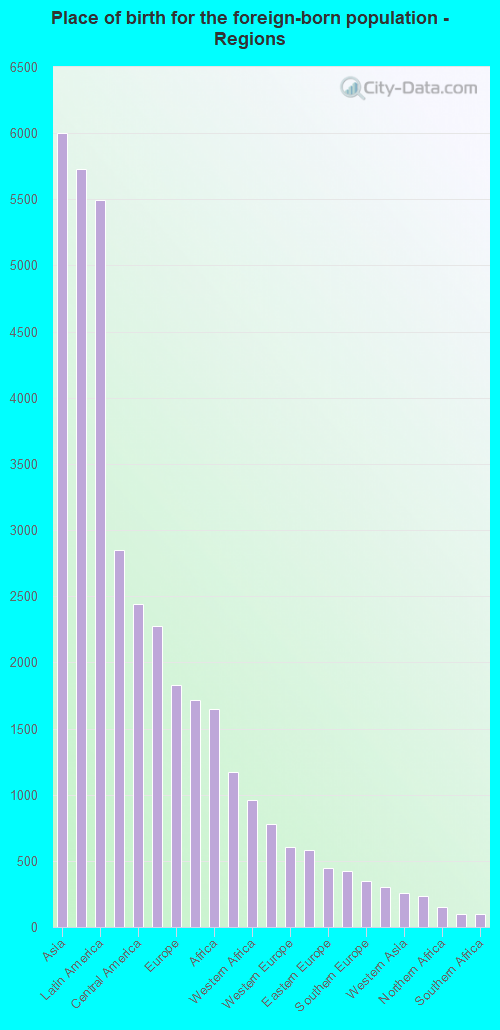
According to 2022 data, the most numerous races in Chesapeake, VA are White alone (138,033 residents), Black alone (72,167 residents), and Hispanic (18,831 residents). 92.8% of Chesapeake residents speak English at home. 6.0% of Chesapeake, VA residents are foreign-born (2.4% born in Asia, 2.2% born in Latin America, 0.7% born in Europe, 0.7% born in Africa), which is 99.1% less than the foreign-born rate of 12.0% across the entire state of Virginia.
Race distribution in Chesapeake
2000 2022
131,200 65.9% White alone 56,442 28.3% Black alone 4,076 2.0% Hispanic 3,638 1.8% Asian alone 2,763 1.4% Two or more races 722 0.4% American Indian alone 251 0.1% Other race alone 92 0.05% Native Hawaiian and Other
138,033 54.7% White alone 72,167 28.6% Black alone 18,831 7.5% Hispanic 12,180 4.8% Two or more races 9,521 3.8% Asian alone 1,398 0.6% Other race alone 358 0.1% American Indian alone
2000 2022
4,965,637 70.2% White alone 1,376,378 19.4% Black alone 329,540 4.7% Hispanic 259,277 3.7% Asian alone 114,022 1.6% Two or more races 18,596 0.3% American Indian alone 11,685 0.2% Other race alone 3,380 0.05% Native Hawaiian and Other
5,095,130 58.7% White alone 1,594,785 18.4% Black alone 905,750 10.4% Hispanic 602,881 6.9% Asian alone 406,047 4.7% Two or more races 60,419 0.7% Other race alone 11,738 0.1% American Indian alone 6,869 0.08% Native Hawaiian and Other
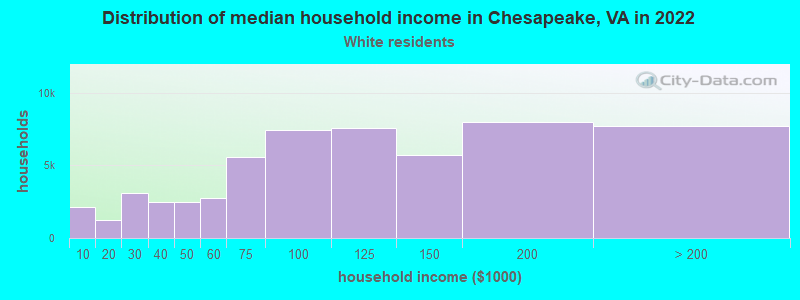
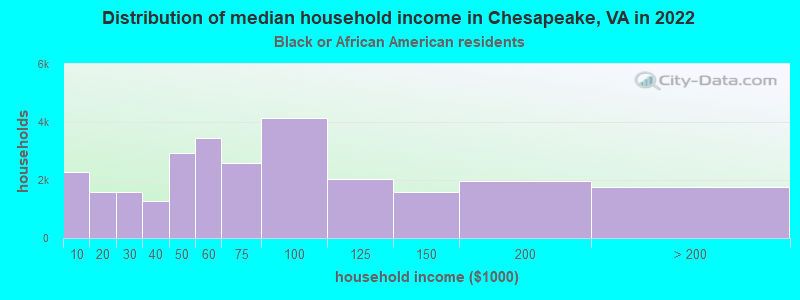
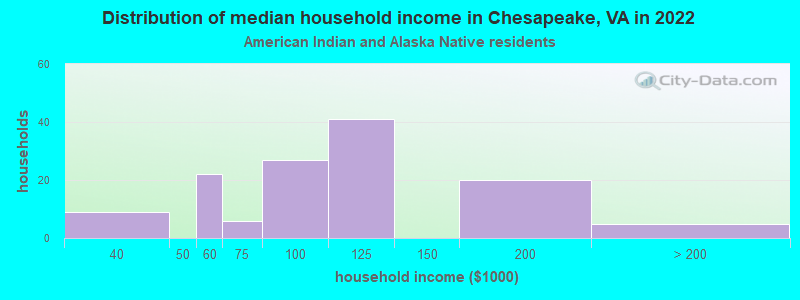
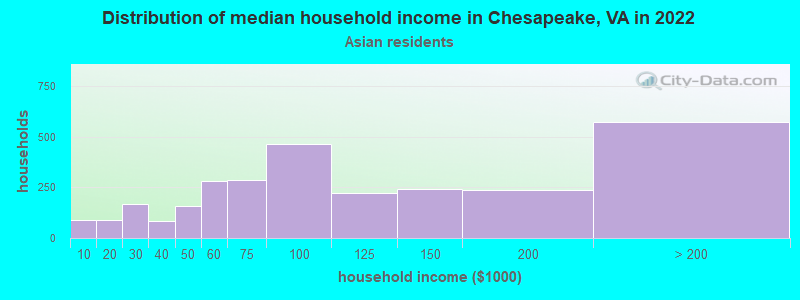
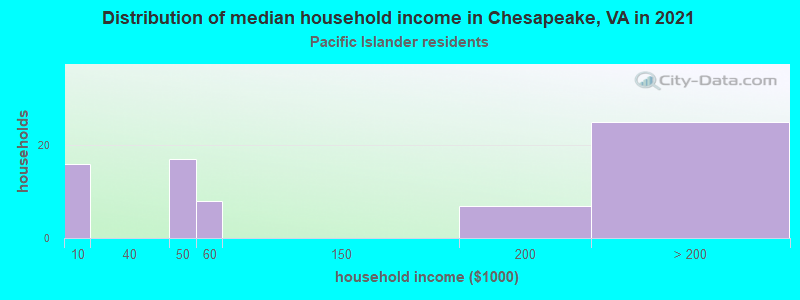
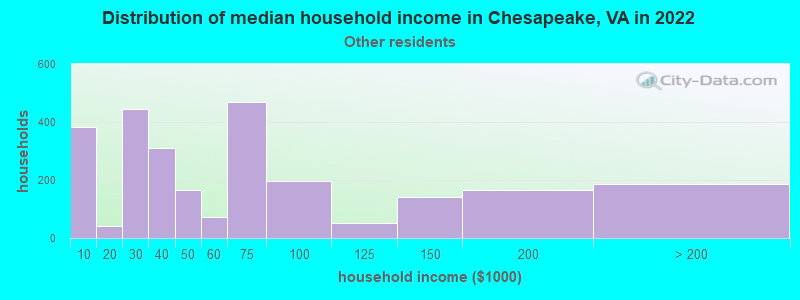
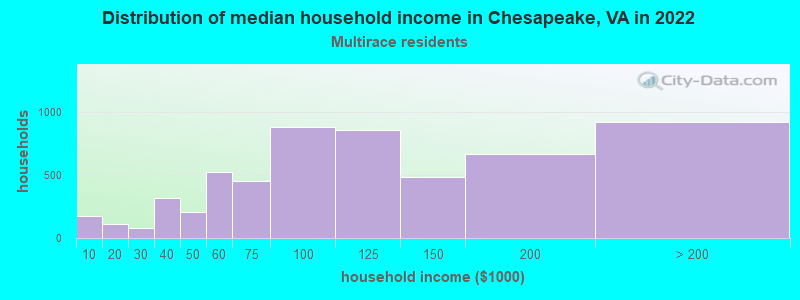
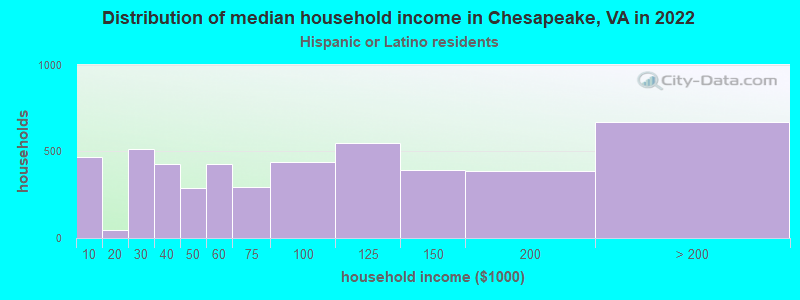
Income and house value in Chesapeake Median household income in 2022 $103,607 White non-Hispanic householders$61,354 Black householders$81,210 American Indian and Alaska Native householders$78,885 Asian householders$49,639 Some other race householders$106,478 Two or more races householders$53,381 Hispanic or Latino race householdersMedian 2022 house value $394,418 White Non-Hispanic householders$289,932 Black or African American householders$338,814 American Indian or Alaska Native householders $485,461 Asian householders$343,703 Native Hawaiian and other Pacific Islander householders$383,725 Some other race householders$365,088 Two or more races householders$378,837 Hispanic or Latino householders
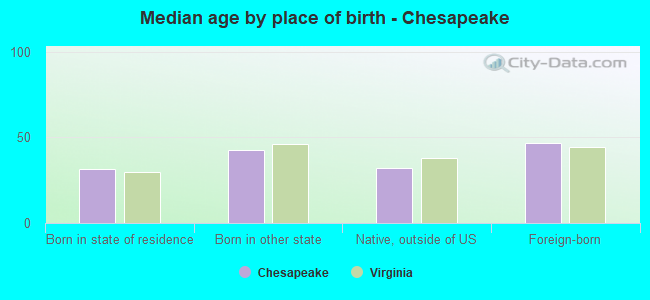
Median age by race in Chesapeake
40.5 Median age for White residents39.1 41.6 36.8 Median age for Black or African American residents35.3 37.9 44.7 Median age for American Indian / Alaska Native residents39.2 62.0 41.4 Median age for Asian residents39.5 44.2 -666,666,666.0 Median age for Native Hawaiian / Pacific Islander residents-666,666,666.0 -666,666,666.0 35.0 Median age for Other race residents34.4 38.7 24.4 Median age for Two or more races residents24.3 24.4 40.9 Median age for White alone residents39.2 41.9 28.5 Median age for Hispanic or Latino residents30.8 26.4
Owner/renter occupied households by race in Chesapeake
House owners and renters - White residents 46,883 83.6% Owner occupied9,213 16.4% Renter occupiedHouse owners and renters - Black or African American residents 15,760 58.1% Owner occupied11,369 41.9% Renter occupiedHouse owners and renters - American Indian / Alaska Native residents 88 77.9% Owner occupied25 22.1% Renter occupiedHouse owners and renters - Asian residents 2,749 72.1% Owner occupied1,062 27.9% Renter occupiedHouse owners and renters - Native Hawaiian / Pacific Islander residents 55 87.7% Owner occupied8 12.3% Renter occupiedHouse owners and renters - Other race residents 859 38.8% Owner occupied1,356 61.2% Renter occupiedHouse owners and renters - Two or more races residents 3,394 60.0% Owner occupied2,258 40.0% Renter occupiedHouse owners and renters - White alone residents 46,347 83.8% Owner occupied8,941 16.2% Renter occupiedHouse owners and renters - Hispanic or Latino residents 2,813 46.5% Owner occupied3,240 53.5% Renter occupied
Language usage in Chesapeake
English speakers - Total 92.8% of residents of Chesapeake speak English at home.
4.0% of residents speak Spanish at home 7,746 81.8% Speak English very well1,720 18.2% Speak English less than very well3.2% of residents speak other language at home 3,811 49.4% Speak English very well3,898 50.6% Speak English less than very well
English speakers - Born in the United States 94.5% of residents of Chesapeake speak English at home.
4.5% of residents speak Spanish at home 4,271 90.7% Speak English very well438 9.3% Speak English less than very well1.0% of residents speak other language at home 944 95.2% Speak English very well48 4.8% Speak English less than very well
English speakers - Native, born elsewhere 71.9% of residents of Chesapeake speak English at home.
22.9% of residents speak Spanish at home 1,355 88.0% Speak English very well185 12.0% Speak English less than very well5.2% of residents speak other language at home 349 100.0% Speak English very well
English speakers - Foreign-born 37.9% of residents of Chesapeake speak English at home.
13.1% of residents speak Spanish at home 920 55.9% Speak English very well725 44.1% Speak English less than very well49.0% of residents speak other language at home 2,294 37.3% Speak English very well3,850 62.7% Speak English less than very well
White (Caucasian) - Speak only English Native:
98.2% (129,549)Foreign-born:
75.9% (1,214)
White (Caucasian) - Speak another language Native:
1.8% (2,432)Foreign-born:
24.1% (385)
Black or African American - Speak only English Native:
98.9% (65,812)Foreign-born:
64.6% (1,725)
Black or African American - Speak another language Native:
1.1% (735)Foreign-born:
35.4% (944)
American Indian / Alaska Native - Speak another language Native:
18.0% (50)Foreign-born:
100.0% (180)
Asian - Speak only English Native:
75.2% (2,500)Foreign-born:
21.3% (1,314)
Asian - Speak another language Native:
24.8% (826)Foreign-born:
78.7% (4,867)
Other race - Speak only English Native:
72.9% (3,739)Foreign-born:
8.3% (178)
Other race - Speak another language Native:
31.0% (1,589)Foreign-born:
91.6% (1,967)
Two or more races - Speak only English Native:
79.0% (13,978)Foreign-born:
33.7% (494)
Two or more races - Speak another language Native:
21.0% (3,709)Foreign-born:
66.3% (971)
White alone - Speak only English Native:
99.0% (128,029)Foreign-born:
75.9% (1,214)
White alone - Speak another language Native:
1.0% (1,290)Foreign-born:
24.1% (385)
Hispanic or Latino - Speak another language Native:
42.9% (6,694)Foreign-born:
100.0% (1,428)
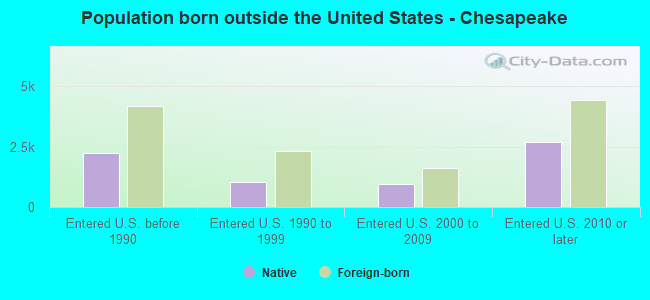
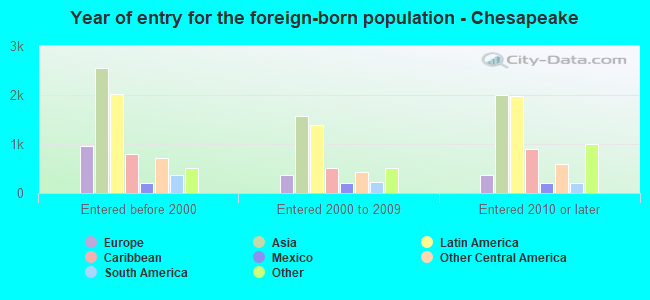
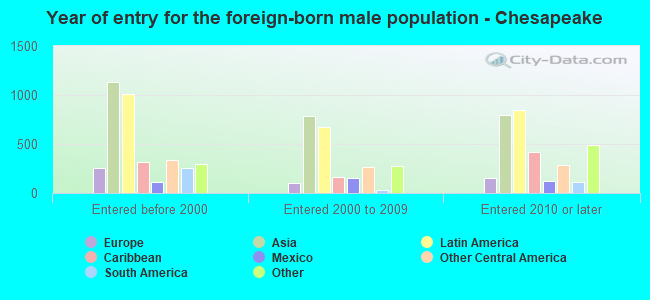
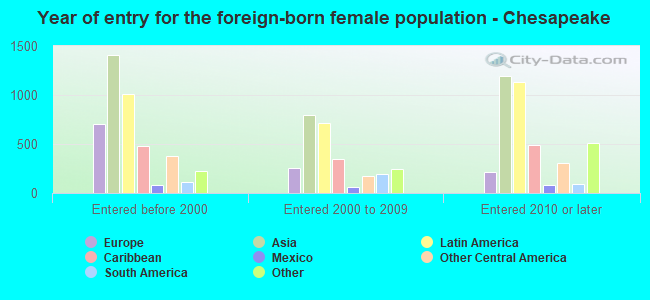
Foreign-born residents in Chesapeake 15,216 residents are foreign born (2.4% Asia , 2.2% Latin America , 0.7% Europe , 0.7% Africa ).
This city:
6.0%Virginia:
12.6%
Marital status for residents in Chesapeake Marital status - White (Caucasian) population 15 years and over
Males 26.7% Never married61.8% Now married0.8% Separated2.5% Widowed8.2% DivorcedFemales 19.1% Never married58.7% Now married1.0% Separated8.6% Widowed12.6% DivorcedWomen who gave birth in the past 12 months Now married:
94.1% (3,356)Unmarried:
5.9% (209)
Women who did not give birth in the past 12 months Now married:
54.6% (15,218)Unmarried:
45.4% (12,649)
Marital status - Black or African American population 15 years and over
Males 42.7% Never married41.5% Now married2.8% Separated1.8% Widowed11.2% DivorcedFemales 43.1% Never married35.2% Now married3.0% Separated7.7% Widowed11.0% DivorcedWomen who gave birth in the past 12 months Now married:
8.1% (69)Unmarried:
91.9% (784)
Women who did not give birth in the past 12 months Now married:
31.2% (5,822)Unmarried:
68.8% (12,843)
Marital status - American Indian / Alaska Native population 15 years and over
Males 16.2% Never married73.5% Now married0.0% Separated0.0% Widowed10.3% DivorcedFemales 3.3% Never married55.0% Now married0.0% Separated27.3% Widowed14.4% DivorcedWomen who gave birth in the past 12 months Now married:
100.0% (23)Unmarried:
0.0% (0)
Women who did not give birth in the past 12 months Now married:
87.9% (54)Unmarried:
12.1% (7)
Marital status - Asian population 15 years and over
Males 39.3% Never married53.8% Now married0.0% Separated2.6% Widowed4.4% DivorcedFemales 19.1% Never married66.3% Now married0.0% Separated7.5% Widowed7.1% DivorcedWomen who gave birth in the past 12 months Now married:
100.0% (191)Unmarried:
0.0% (0)
Women who did not give birth in the past 12 months Now married:
65.8% (1,638)Unmarried:
34.2% (851)
Marital status - Native Hawaiian / Pacific Islander population 15 years and over
Males 21.1% Never married18.3% Now married0.0% Separated0.0% Widowed60.6% DivorcedFemales 0.0% Never married51.7% Now married0.0% Separated48.3% Widowed0.0% DivorcedWomen who gave birth in the past 12 months Now married:
100.0% (8)Unmarried:
0.0% (0)
Women who did not give birth in the past 12 months Now married:
100.0% (24)Unmarried:
0.0% (0)
Marital status - Other race population 15 years and over
Males 39.7% Never married52.2% Now married0.0% Separated0.9% Widowed7.2% DivorcedFemales 34.1% Never married51.4% Now married3.8% Separated5.0% Widowed5.6% DivorcedWomen who gave birth in the past 12 months Now married:
56.7% (67)Unmarried:
43.3% (51)
Women who did not give birth in the past 12 months Now married:
53.0% (1,353)Unmarried:
47.0% (1,199)
Marital status - Two or more races population 15 years and over
Males 44.1% Never married47.2% Now married0.0% Separated0.3% Widowed8.3% DivorcedFemales 35.8% Never married50.6% Now married7.0% Separated1.1% Widowed5.5% DivorcedWomen who gave birth in the past 12 months Now married:
56.1% (323)Unmarried:
43.9% (253)
Women who did not give birth in the past 12 months Now married:
57.1% (2,618)Unmarried:
42.9% (1,965)
Marital status - White alone, not Hispanic / Latino population 15 years and over
Males 26.5% Never married62.2% Now married0.8% Separated2.5% Widowed7.9% DivorcedFemales 19.1% Never married58.4% Now married1.0% Separated8.7% Widowed12.8% DivorcedWomen who gave birth in the past 12 months Now married:
94.0% (3,302)Unmarried:
6.0% (209)
Women who did not give birth in the past 12 months Now married:
53.8% (14,603)Unmarried:
46.2% (12,520)
Marital status - Hispanic or Latino population 15 years and over
Males 39.8% Never married54.5% Now married0.3% Separated0.2% Widowed5.2% DivorcedFemales 34.5% Never married54.0% Now married3.8% Separated4.0% Widowed3.7% DivorcedWomen who gave birth in the past 12 months Now married:
25.8% (88)Unmarried:
74.2% (253)
Women who did not give birth in the past 12 months Now married:
55.9% (2,604)Unmarried:
44.1% (2,052)
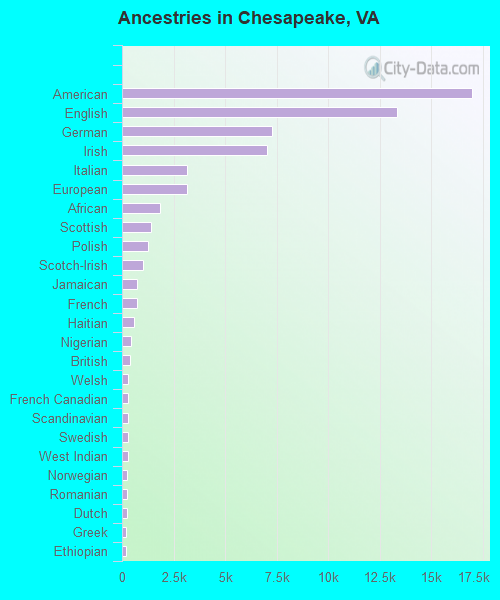
Ancestries in Chesapeake
16,947 13.2% American13,347 10.4% English7,282 5.7% German7,017 5.4% Irish3,143 2.4% Italian3,140 2.4% European1,829 1.4% African1,416 1.1% Scottish1,243 1.0% Polish1,001 0.8% Scotch-Irish727 0.6% Jamaican720 0.6% French563 0.4% Haitian424 0.3% Nigerian398 0.3% British296 0.2% Welsh292 0.2% French Canadian291 0.2% Scandinavian273 0.2% Swedish267 0.2% West Indian265 0.2% Norwegian250 0.2% Romanian247 0.2% Dutch216 0.2% Greek186 0.1% Ethiopian160 0.1% South African151 0.1% Kenyan142 0.1% Russian137 0.1% Lithuanian132 0.1% Portuguese130 0.1% Northern European125 0.10% Eastern European124 0.10% Trinidadian and Tobagonian118 0.09% Afghan112 0.09% Turkish107 0.08% Danish105 0.08% Canadian96 0.07% Hungarian94 0.07% Barbadian87 0.07% Ghanaian85 0.07% Swiss85 0.07% Slovak80 0.06% Egyptian77 0.06% Lebanese76 0.06% Cape Verdean75 0.06% Ukrainian69 0.05% Czech63 0.05% Brazilian57 0.04% Iraqi54 0.04% Albanian53 0.04% Guyanese43 0.03% Austrian41 0.03% Czechoslovakian37 0.03% Zimbabwean36 0.03% Bermudan30 0.02% Armenian23 0.02% Iranian22 0.02% Cajun21 0.02% Moroccan19 0.01% Croatian18 0.01% Finnish12 0.01% Slavic9 0.01% Yugoslavian
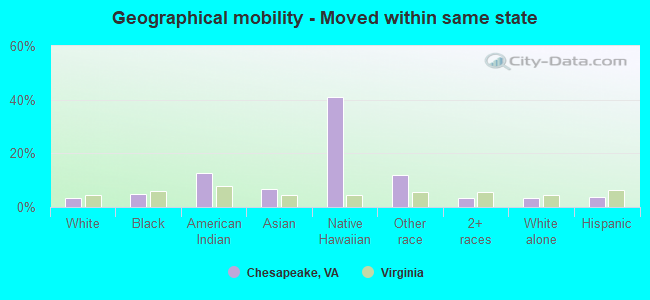
Geographical mobility in Chesapeake Same house 1 year ago 121,746 87.9% White (Caucasian)63,318 87.2% Black or African American191 43.0% American Indian / Alaska Native7,685 81.2% Asian121 66.2% Native Hawaiian / Pacific Islander5,956 77.0% Other race18,881 89.6% Two or more races119,067 87.8% White alone, not Hispanic / Latino16,551 88.5% Hispanic or LatinoMoved within same county 5,808 4.2% White / Caucasian4,592 6.3% Black or African American33 7.4% American Indian / Alaska Native187 2.0% Asian330 4.3% Other race723 3.4% Two or more races5,808 4.3% White alone, not Hispanic / Latino364 1.9% Hispanic or LatinoMoved within same state 4,884 3.5% White / Caucasian3,480 4.8% Black or African American57 12.7% American Indian / Alaska Native636 6.7% Asian75 41.0% Native Hawaiian / Pacific Islander910 11.8% Other race697 3.3% Two or more races4,773 3.5% White alone, not Hispanic / Latino683 3.7% Hispanic or LatinoMoved from different state 5,418 3.9% White / Caucasian1,104 1.5% Black or African American152 34.1% American Indian / Alaska Native762 8.1% Asian405 5.2% Other race780 3.7% Two or more races5,322 3.9% White alone, not Hispanic / Latino972 5.2% Hispanic or LatinoMoved from abroad 681 0.5% White105 0.1% Black or African American207 2.2% Asian117 1.5% Other race681 0.5% White alone, not Hispanic / Latino134 0.7% Hispanic or Latino
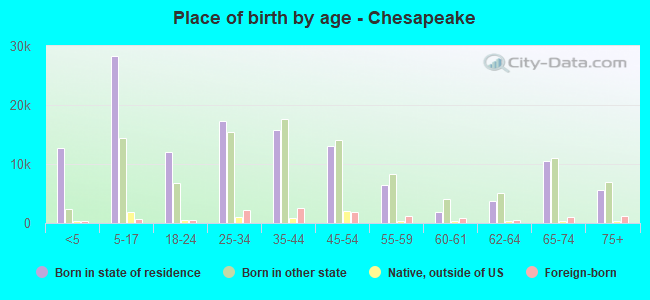
Children Nativity (place of birth) in Chesapeake
Children under 6 years - Living with two parents Both parents native 12,379 100.0% NativeBoth parents foreign-born 381 100.0% NativeOne native, one foreign-born parent 919 100.0% NativeChildren under 6 years - Living with one parent Native parent 5,485 100.0% NativeForeign-born parent 155 100.0% NativeChildren 6 to 17 years - Living with two parents Both parents native 22,131 99.3% Native158 0.7% Foreign-bornBoth parents foreign-born 1,064 72.8% Native397 27.2% Foreign-bornOne native, one foreign-born parent 2,040 100.0% NativeChildren 6 to 17 years - Living with one parent Native parent 13,206 100.0% NativeForeign-born parent 745 50.0% Native745 50.0% Foreign-born
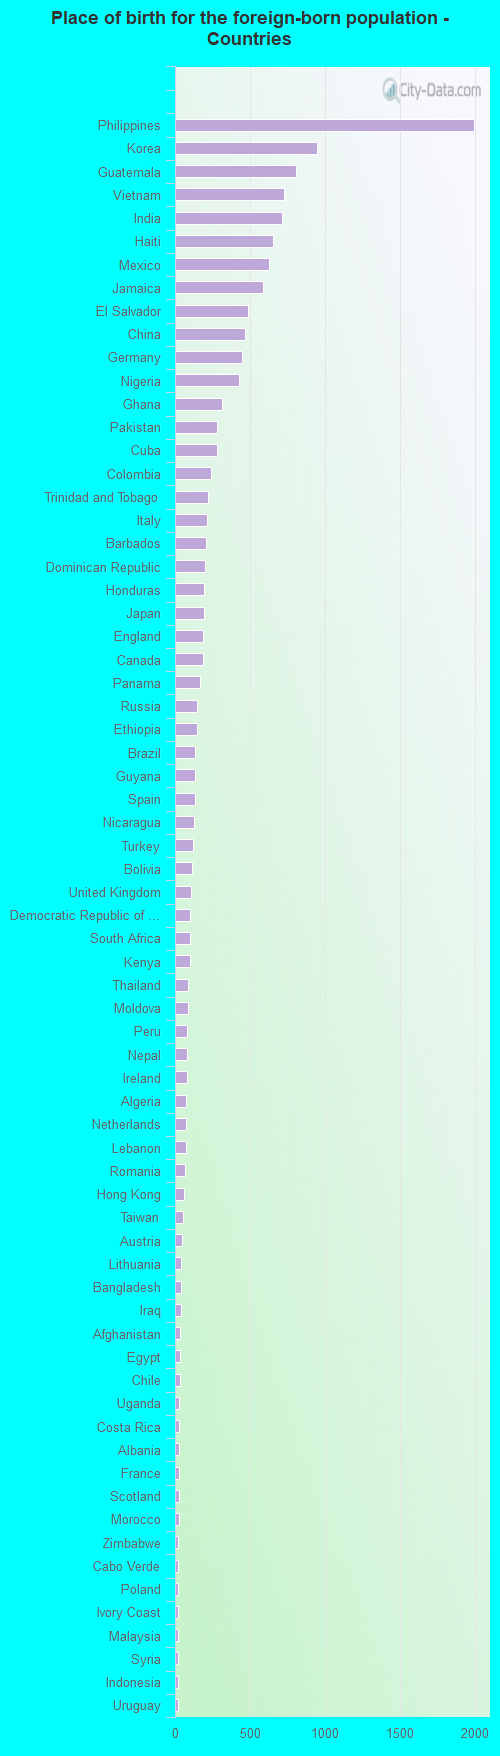
Place of birth for residents in Chesapeake 6,000 Asia5,730 Americas5,492 Latin America2,848 South Eastern Asia2,439 Central America2,272 Caribbean1,830 Europe1,718 Eastern Asia1,644 Africa1,174 South Central Asia960 Western Africa780 South America606 Western Europe582 China449 Eastern Europe426 Northern Europe347 Southern Europe304 Eastern Africa259 Western Asia237 Northern America149 Northern Africa102 Middle Africa99 Southern Africa10 Oceania10 Australia and New Zealand Subregion1,995 Philippines944 Korea804 Guatemala728 Vietnam714 India653 Haiti630 Mexico584 Jamaica485 El Salvador465 China450 Germany430 Nigeria313 Ghana280 Pakistan279 Cuba240 Colombia222 Trinidad and Tobago213 Italy210 Barbados199 Dominican Republic194 Honduras191 Japan190 England186 Canada168 Panama149 Russia144 Ethiopia136 Brazil134 Guyana133 Spain125 Nicaragua120 Turkey111 Bolivia110 United Kingdom102 Democratic Republic of Congo (Zaire)99 South Africa98 Kenya86 Thailand85 Moldova83 Peru82 Nepal81 Ireland75 Algeria74 Netherlands72 Lebanon66 Romania61 Hong Kong54 Taiwan47 Austria43 Lithuania41 Bangladesh39 Iraq34 Afghanistan34 Egypt33 Chile30 Uganda29 Costa Rica26 Albania26 France26 Scotland25 Morocco23 Zimbabwe22 Cabo Verde21 Poland19 Ivory Coast19 Malaysia19 Syria19 Indonesia19 Uruguay18 West Indies18 Hungary18 Ecuador18 Denmark17 Iran17 Czechoslovakia14 Bahamas14 Bosnia and Herzegovina10 Australia8 Kuwait8 Switzerland7 Ukraine3 Kazakhstan3 Venezuela
Grandparents responsible for own grandchildren in Chesapeake
Grandparents (30 to 59 years) White / Caucasian 647 54.7% Responsible for grandchildren535 45.3% Not responsible for grandchildrenBlack or African American 560 40.7% Responsible for grandchildren816 59.3% Not responsible for grandchildrenAsian 35 55.7% Responsible for grandchildren27 44.3% Not responsible for grandchildrenTwo or more races 194 90.7% Responsible for grandchildren20 9.3% Not responsible for grandchildrenWhite alone, not Hispanic / Latino 647 59.8% Responsible for grandchildren435 40.2% Not responsible for grandchildrenHispanic or Latino 210 93.9% Responsible for grandchildren14 6.1% Not responsible for grandchildrenGrandparents (60 years and over) White / Caucasian 406 30.9% Responsible for grandchildren908 69.1% Not responsible for grandchildrenBlack or African American 394 21.1% Responsible for grandchildren1,474 78.9% Not responsible for grandchildrenAsian 37 11.8% Responsible for grandchildren276 88.2% Not responsible for grandchildrenTwo or more races 28 40.8% Responsible for grandchildren41 59.2% Not responsible for grandchildrenWhite alone, not Hispanic / Latino 406 30.9% Responsible for grandchildren908 69.1% Not responsible for grandchildrenHispanic or Latino 35 100.0% Not responsible for grandchildren