Races in Cheney, Washington (WA) Detailed Stats
Data:
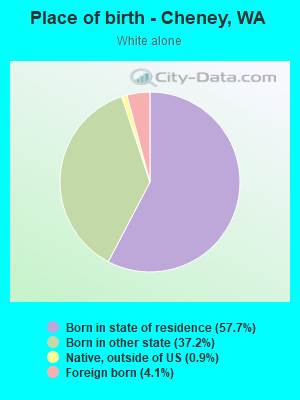
Races - White alone (%)
Races - White alone (% change since 2000)
Races - Black alone (%)
Races - Black alone (% change since 2000)
Races - American Indian alone (%)
Races - American Indian alone (% change since 2000)
Races - Asian alone (%)
Races - Asian alone (% change since 2000)
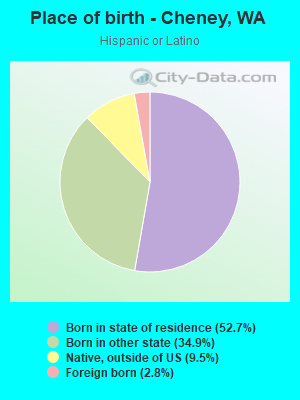
Races - Hispanic (%)
Races - Hispanic (% change since 2000)
Races - Native Hawaiian and Other Pacific Islander alone (%)
Races - Native Hawaiian and Other Pacific Islander alone (% change since 2000)
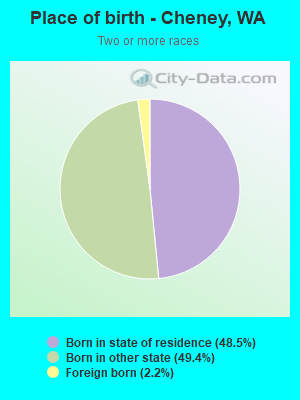
Races - Two or more races(%)
Races - Two or more races(% change since 2000)
Races - Other race alone (%)
Races - Other race alone (% change since 2000)
Racial diversity
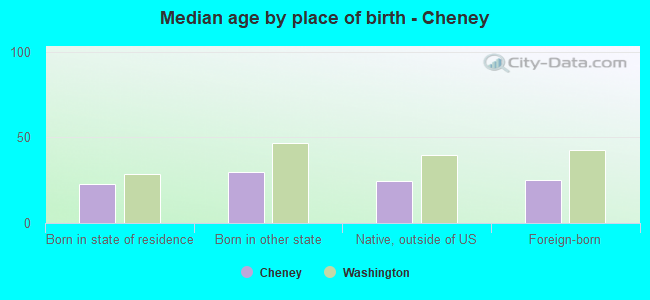
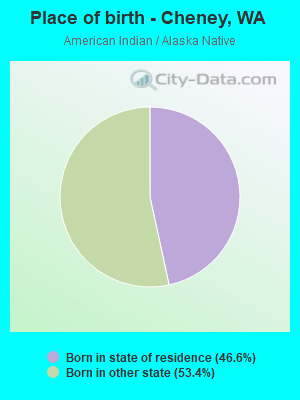
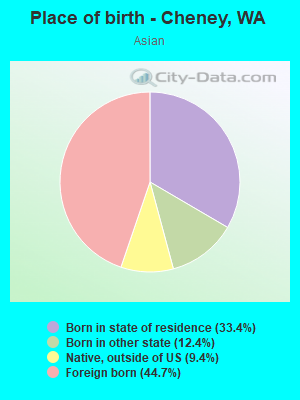
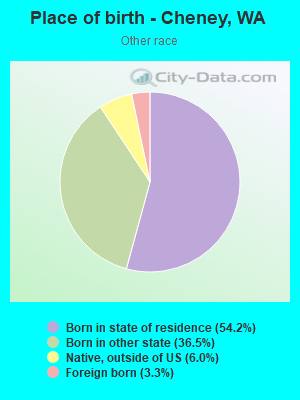
Place of birth - Born in state of residence (%)
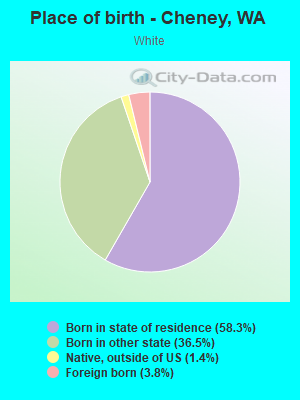
Place of birth - Born in state of residence (%) - White
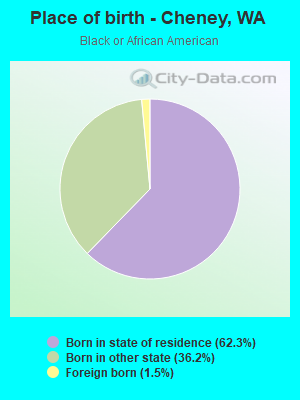
Place of birth - Born in state of residence (%) - Black or African American
Place of birth - Born in state of residence (%) - Asian
Place of birth - Born in state of residence (%) - Hispanic or Latino
Place of birth - Born in state of residence (%) - American Indian and Alaska Native
Place of birth - Born in state of residence (%) - Multirace
Place of birth - Born in state of residence (%) - Other Race
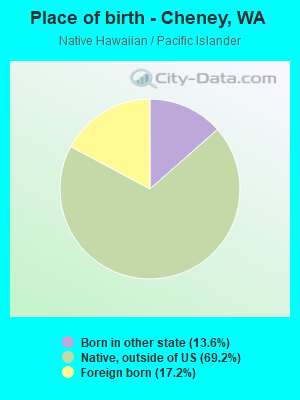
Place of birth - Born in other state (%)
Place of birth - Born in other state (%) - White
Place of birth - Born in other state (%) - Black or African American
Place of birth - Born in other state (%) - Asian
Place of birth - Born in other state (%) - Hispanic or Latino
Place of birth - Born in other state (%) - American Indian and Alaska Native
Place of birth - Born in other state (%) - Multirace
Place of birth - Born in other state (%) - Other Race
Place of birth - Native, outside of US (%)
Place of birth - Native, outside of US (%) - White
Place of birth - Native, outside of US (%) - Black or African American
Place of birth - Native, outside of US (%) - Asian
Place of birth - Native, outside of US (%) - Hispanic or Latino
Place of birth - Native, outside of US (%) - American Indian and Alaska Native
Place of birth - Native, outside of US (%) - Multirace
Place of birth - Native, outside of US (%) - Other Race
Place of birth - Foreign born (%)
Place of birth - Foreign born (%) - White
Place of birth - Foreign born (%) - Black or African American
Place of birth - Foreign born (%) - Asian
Place of birth - Foreign born (%) - Hispanic or Latino
Place of birth - Foreign born (%) - American Indian and Alaska Native
Place of birth - Foreign born (%) - Multirace
Place of birth - Foreign born (%) - Other Race
Residents speaking English at home (%)
Residents speaking English at home - Born in the United States (%)
Residents speaking English at home - Native, born elsewhere (%)
Residents speaking English at home - Foreign born (%)
Residents speaking Spanish at home (%)
Residents speaking Spanish at home - Born in the United States (%)
Residents speaking Spanish at home - Native, born elsewhere (%)
Residents speaking Spanish at home - Foreign born (%)
Residents speaking other language at home (%)
Residents speaking other language at home - Born in the United States (%)
Residents speaking other language at home - Native, born elsewhere (%)
Residents speaking other language at home - Foreign born (%)
Marital status - Never married (%)
Marital status - Now married (%)
Marital status - Separated (%)
Marital status - Widowed (%)
Marital status - Divorced (%)
Ancestries Reported - Arab (%)
Ancestries Reported - Czech (%)
Ancestries Reported - Danish (%)
Ancestries Reported - Dutch (%)
Ancestries Reported - English (%)
Ancestries Reported - French (%)
Ancestries Reported - French Canadian (%)
Ancestries Reported - German (%)
Ancestries Reported - Greek (%)
Ancestries Reported - Hungarian (%)
Ancestries Reported - Irish (%)
Ancestries Reported - Italian (%)
Ancestries Reported - Lithuanian (%)
Ancestries Reported - Norwegian (%)
Ancestries Reported - Polish (%)
Ancestries Reported - Portuguese (%)
Ancestries Reported - Russian (%)
Ancestries Reported - Scotch-Irish (%)
Ancestries Reported - Scottish (%)
Ancestries Reported - Slovak (%)
Ancestries Reported - Subsaharan African (%)
Ancestries Reported - Swedish (%)
Ancestries Reported - Swiss (%)
Ancestries Reported - Ukrainian (%)
Ancestries Reported - United States (%)
Ancestries Reported - Welsh (%)
Ancestries Reported - West Indian (%)
Ancestries Reported - Other (%)
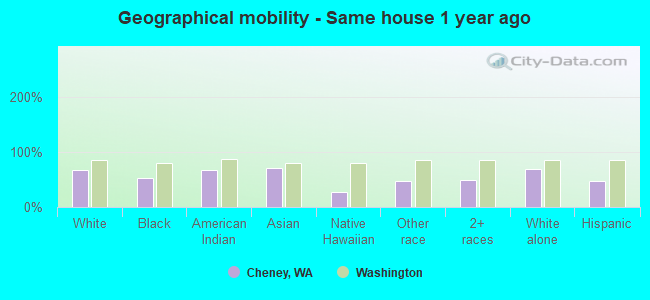
Geographical mobility - Same house 1 year ago (%)
Geographical mobility - Same house 1 year ago (%) - White
Geographical mobility - Same house 1 year ago (%) - Black or African American
Geographical mobility - Same house 1 year ago (%) - Asian
Geographical mobility - Same house 1 year ago (%) - Hispanic or Latino
Geographical mobility - Same house 1 year ago (%) - American Indian and Alaska Native
Geographical mobility - Same house 1 year ago (%) - Multirace
Geographical mobility - Same house 1 year ago (%) - Other Race
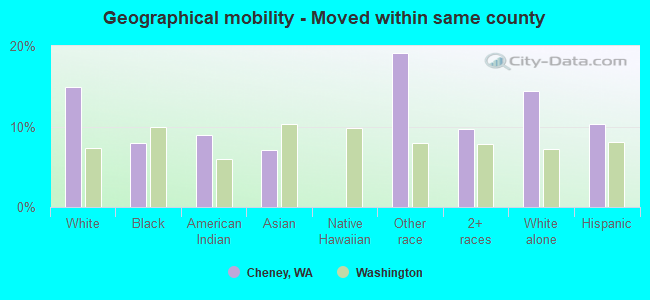
Geographical mobility - Moved within same county (%)
Geographical mobility - Moved within same county (%) - White
Geographical mobility - Moved within same county (%) - Black or African American
Geographical mobility - Moved within same county (%) - Asian
Geographical mobility - Moved within same county (%) - Hispanic or Latino
Geographical mobility - Moved within same county (%) - American Indian and Alaska Native
Geographical mobility - Moved within same county (%) - Multirace
Geographical mobility - Moved within same county (%) - Other Race
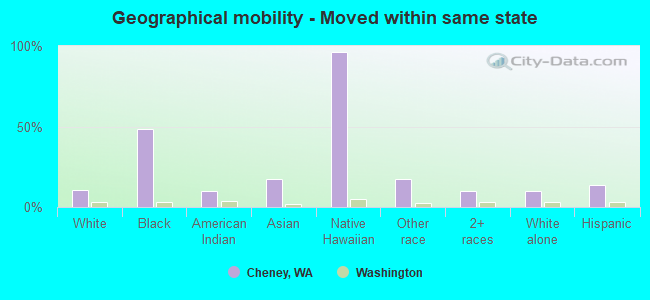
Geographical mobility - Moved from different county within same state (%)
Geographical mobility - Moved from different county within same state (%) - White
Geographical mobility - Moved from different county within same state (%) - Black or African American
Geographical mobility - Moved from different county within same state (%) - Asian
Geographical mobility - Moved from different county within same state (%) - Hispanic or Latino
Geographical mobility - Moved from different county within same state (%) - American Indian and Alaska Native
Geographical mobility - Moved from different county within same state (%) - Multirace
Geographical mobility - Moved from different county within same state (%) - Other Race
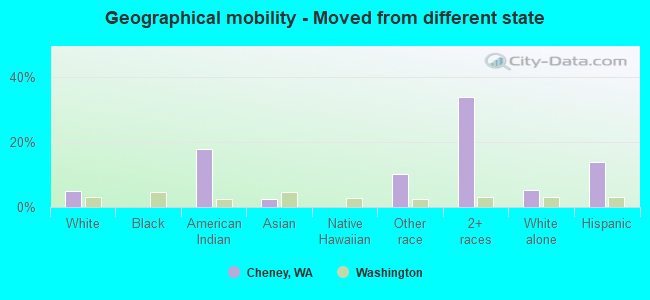
Geographical mobility - Moved from different state (%)
Geographical mobility - Moved from different state (%) - White
Geographical mobility - Moved from different state (%) - Black or African American
Geographical mobility - Moved from different state (%) - Asian
Geographical mobility - Moved from different state (%) - Hispanic or Latino
Geographical mobility - Moved from different state (%) - American Indian and Alaska Native
Geographical mobility - Moved from different state (%) - Multirace
Geographical mobility - Moved from different state (%) - Other Race
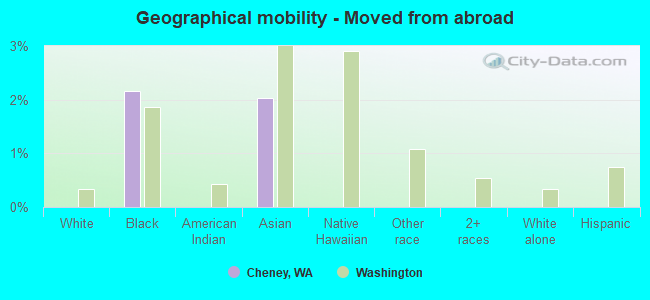
Geographical mobility - Moved from abroad (%)
Geographical mobility - Moved from abroad (%) - White
Geographical mobility - Moved from abroad (%) - Black or African American
Geographical mobility - Moved from abroad (%) - Asian
Geographical mobility - Moved from abroad (%) - Hispanic or Latino
Geographical mobility - Moved from abroad (%) - American Indian and Alaska Native
Geographical mobility - Moved from abroad (%) - Multirace
Geographical mobility - Moved from abroad (%) - Other Race
Place of birth for the foreign-born population - Ireland (%)
Place of birth for the foreign-born population - Denmark (%)
Place of birth for the foreign-born population - Norway (%)
Place of birth for the foreign-born population - Sweden (%)
Place of birth for the foreign-born population - United Kingdom (%)
Place of birth for the foreign-born population - England (%)
Place of birth for the foreign-born population - Scotland (%)
Place of birth for the foreign-born population - Other Northern Europe (%)
Place of birth for the foreign-born population - Austria (%)
Place of birth for the foreign-born population - Belgium (%)
Place of birth for the foreign-born population - France (%)
Place of birth for the foreign-born population - Germany (%)
Place of birth for the foreign-born population - Netherlands (%)
Place of birth for the foreign-born population - Switzerland (%)
Place of birth for the foreign-born population - Other Western Europe (%)
Place of birth for the foreign-born population - Greece (%)
Place of birth for the foreign-born population - Italy (%)
Place of birth for the foreign-born population - Portugal (%)
Place of birth for the foreign-born population - Spain (%)
Place of birth for the foreign-born population - Other Southern Europe (%)
Place of birth for the foreign-born population - Albania (%)
Place of birth for the foreign-born population - Belarus (%)
Place of birth for the foreign-born population - Bosnia and Herzegovina (%)
Place of birth for the foreign-born population - Bulgaria (%)
Place of birth for the foreign-born population - Croatia (%)
Place of birth for the foreign-born population - Czechoslovakia (%)
Place of birth for the foreign-born population - Hungary (%)
Place of birth for the foreign-born population - Latvia (%)
Place of birth for the foreign-born population - Lithuania (%)
Place of birth for the foreign-born population - North Macedonia (Macedonia) (%)
Place of birth for the foreign-born population - Moldova (%)
Place of birth for the foreign-born population - Poland (%)
Place of birth for the foreign-born population - Romania (%)
Place of birth for the foreign-born population - Russia (%)
Place of birth for the foreign-born population - Serbia (%)
Place of birth for the foreign-born population - Ukraine (%)
Place of birth for the foreign-born population - Other Eastern Europe (%)
Place of birth for the foreign-born population - China (%)
Place of birth for the foreign-born population - Hong Kong (%)
Place of birth for the foreign-born population - Taiwan (%)
Place of birth for the foreign-born population - Japan (%)
Place of birth for the foreign-born population - Korea (%)
Place of birth for the foreign-born population - Other Eastern Asia (%)
Place of birth for the foreign-born population - Afghanistan (%)
Place of birth for the foreign-born population - Bangladesh (%)
Place of birth for the foreign-born population - India (%)
Place of birth for the foreign-born population - Iran (%)
Place of birth for the foreign-born population - Kazakhstan (%)
Place of birth for the foreign-born population - Nepal (%)
Place of birth for the foreign-born population - Pakistan (%)
Place of birth for the foreign-born population - Sri Lanka (%)
Place of birth for the foreign-born population - Uzbekistan (%)
Place of birth for the foreign-born population - Other South Central Asia (%)
Place of birth for the foreign-born population - Burma (%)
Place of birth for the foreign-born population - Cambodia (%)
Place of birth for the foreign-born population - Indonesia (%)
Place of birth for the foreign-born population - Laos (%)
Place of birth for the foreign-born population - Malaysia (%)
Place of birth for the foreign-born population - Philippines (%)
Place of birth for the foreign-born population - Singapore (%)
Place of birth for the foreign-born population - Thailand (%)
Place of birth for the foreign-born population - Vietnam (%)
Place of birth for the foreign-born population - Other South Eastern Asia (%)
Place of birth for the foreign-born population - Armenia (%)
Place of birth for the foreign-born population - Iraq (%)
Place of birth for the foreign-born population - Israel (%)
Place of birth for the foreign-born population - Jordan (%)
Place of birth for the foreign-born population - Kuwait (%)
Place of birth for the foreign-born population - Lebanon (%)
Place of birth for the foreign-born population - Saudi Arabia (%)
Place of birth for the foreign-born population - Syria (%)
Place of birth for the foreign-born population - Turkey (%)
Place of birth for the foreign-born population - Yemen (%)
Place of birth for the foreign-born population - Other Western Asia (%)
Place of birth for the foreign-born population - Eritrea (%)
Place of birth for the foreign-born population - Ethiopia (%)
Place of birth for the foreign-born population - Kenya (%)
Place of birth for the foreign-born population - Somalia (%)
Place of birth for the foreign-born population - Uganda (%)
Place of birth for the foreign-born population - Zimbabwe (%)
Place of birth for the foreign-born population - Other Eastern Africa (%)
Place of birth for the foreign-born population - Cameroon (%)
Place of birth for the foreign-born population - Congo (%)
Place of birth for the foreign-born population - Democratic Republic of Congo (Zaire) (%)
Place of birth for the foreign-born population - Other Middle Africa (%)
Place of birth for the foreign-born population - Egypt (%)
Place of birth for the foreign-born population - Morocco (%)
Place of birth for the foreign-born population - Sudan (%)
Place of birth for the foreign-born population - Other Northern Africa (%)
Place of birth for the foreign-born population - South Africa (%)
Place of birth for the foreign-born population - Other Southern Africa (%)
Place of birth for the foreign-born population - Cabo Verde (%)
Place of birth for the foreign-born population - Ghana (%)
Place of birth for the foreign-born population - Liberia (%)
Place of birth for the foreign-born population - Nigeria (%)
Place of birth for the foreign-born population - Senegal (%)
Place of birth for the foreign-born population - Sierra Leone (%)
Place of birth for the foreign-born population - Other Western Africa (%)
Place of birth for the foreign-born population - Australia (%)
Place of birth for the foreign-born population - New Zealand (%)
Place of birth for the foreign-born population - Fiji (%)
Place of birth for the foreign-born population - Micronesia (%)
Place of birth for the foreign-born population - Bahamas (%)
Place of birth for the foreign-born population - Barbados (%)
Place of birth for the foreign-born population - Cuba (%)
Place of birth for the foreign-born population - Dominica (%)
Place of birth for the foreign-born population - Dominican Republic (%)
Place of birth for the foreign-born population - Grenada (%)
Place of birth for the foreign-born population - Haiti (%)
Place of birth for the foreign-born population - Jamaica (%)
Place of birth for the foreign-born population - St. Vincent and the Grenadines (%)
Place of birth for the foreign-born population - Trinidad and Tobago (%)
Place of birth for the foreign-born population - West Indies (%)
Place of birth for the foreign-born population - Other Caribbean (%)
Place of birth for the foreign-born population - Belize (%)
Place of birth for the foreign-born population - Costa Rica (%)
Place of birth for the foreign-born population - El Salvador (%)
Place of birth for the foreign-born population - Guatemala (%)
Place of birth for the foreign-born population - Honduras (%)
Place of birth for the foreign-born population - Mexico (%)
Place of birth for the foreign-born population - Nicaragua (%)
Place of birth for the foreign-born population - Panama (%)
Place of birth for the foreign-born population - Other Central America (%)
Place of birth for the foreign-born population - Argentina (%)
Place of birth for the foreign-born population - Bolivia (%)
Place of birth for the foreign-born population - Brazil (%)
Place of birth for the foreign-born population - Chile (%)
Place of birth for the foreign-born population - Colombia (%)
Place of birth for the foreign-born population - Ecuador (%)
Place of birth for the foreign-born population - Guyana (%)
Place of birth for the foreign-born population - Peru (%)
Place of birth for the foreign-born population - Uruguay (%)
Place of birth for the foreign-born population - Venezuela (%)
Place of birth for the foreign-born population - Other South America (%)
Place of birth for the foreign-born population - Canada (%)
Place of birth for the foreign-born population - Other Northern America (%)
Place of birth for the foreign-born population - Other (%)
Latest news about races in Cheney, WA collected exclusively by city-data.com from local newspapers, TV, and radio stations
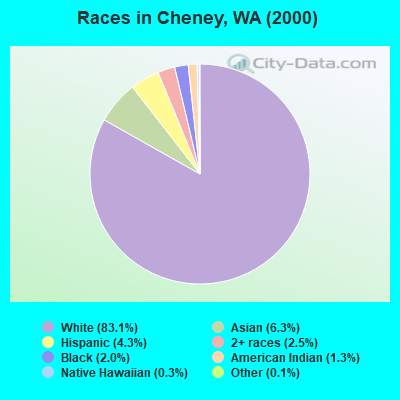
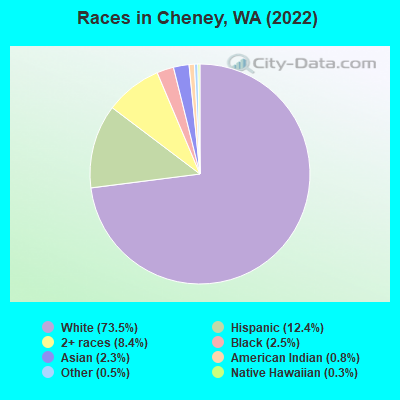
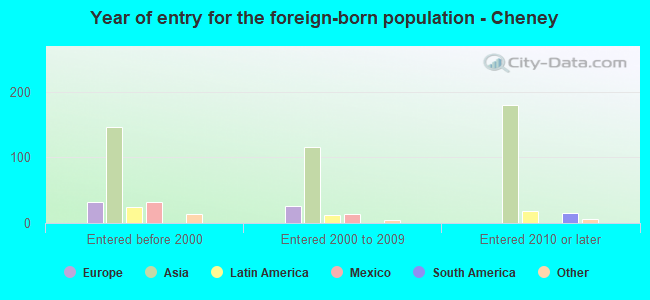
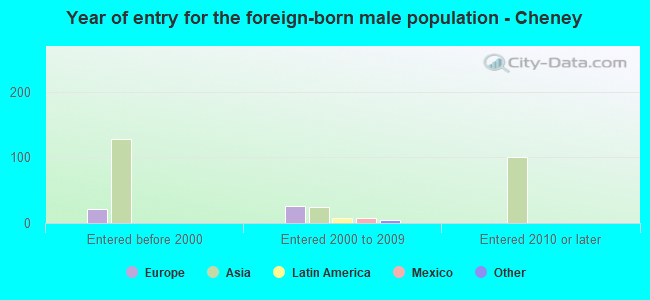
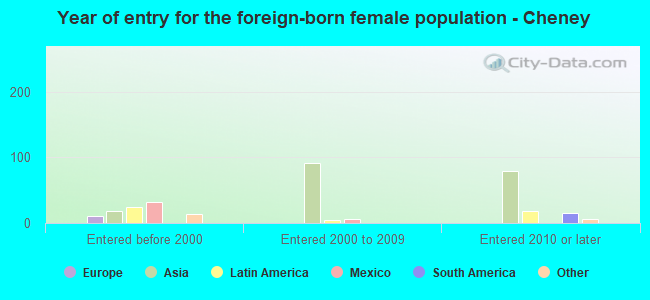
According to 2022 data, the most numerous races in Cheney, WA are White alone (9,630 residents), Hispanic (1,630 residents), and Asian alone (304 residents). 89.8% of Cheney residents speak English at home. 4.7% of Cheney, WA residents are foreign-born (3.1% born in Asia, 0.6% born in Latin America, 0.5% born in Europe), which is 219.2% less than the foreign-born rate of 15.0% across the entire state of Washington.
Race distribution in Cheney
2000 2022
4,652,490 78.9% White alone 441,509 7.5% Hispanic 319,401 5.4% Asian alone 184,631 3.1% Black alone 175,926 3.0% Two or more races 85,396 1.4% American Indian alone 22,779 0.4% Native Hawaiian and Other 11,989 0.2% Other race alone
4,941,456 63.5% White alone 1,093,313 14.0% Hispanic 755,832 9.7% Asian alone 523,448 6.7% Two or more races 299,537 3.8% Black alone 69,024 0.9% American Indian alone 52,231 0.7% Native Hawaiian and Other 50,945 0.7% Other race alone
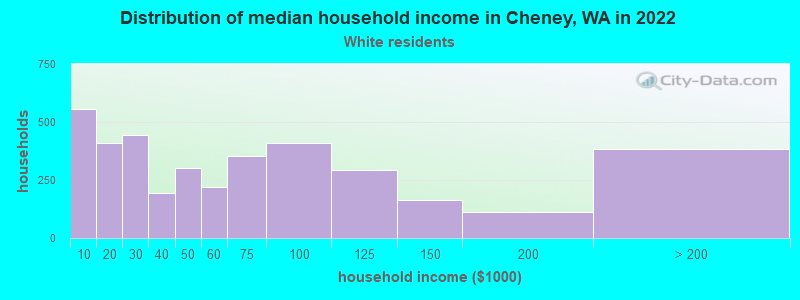
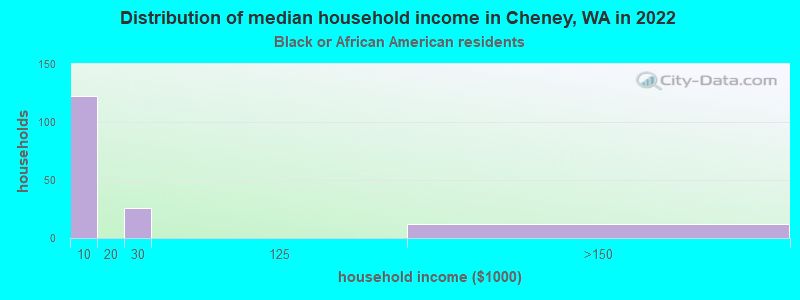
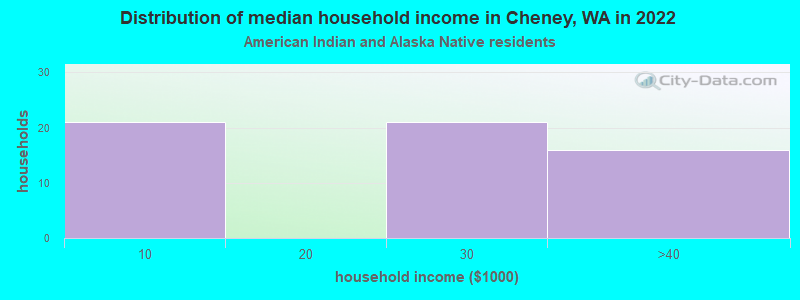
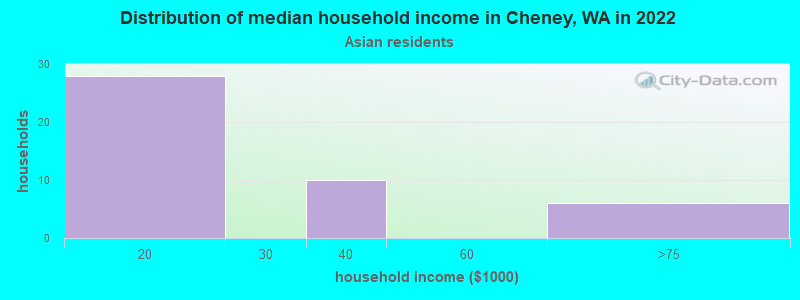
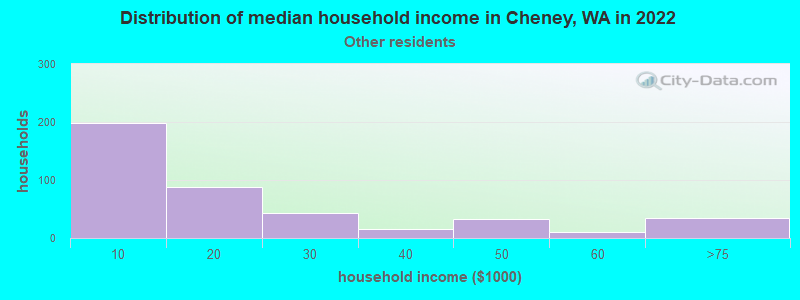
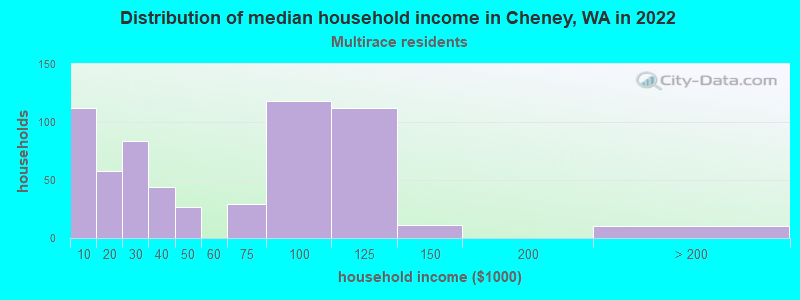
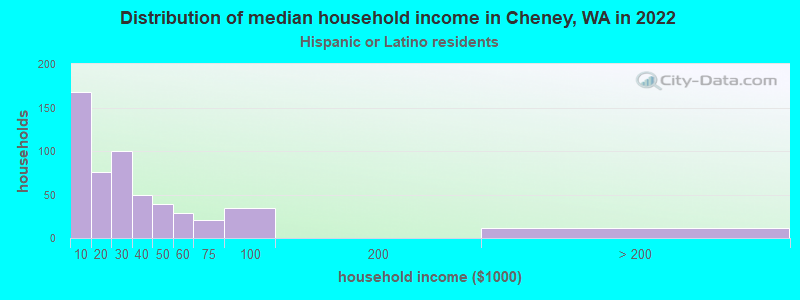
Income and house value in Cheney Median household income in 2022 $50,572 White non-Hispanic householders$8,656 Black householders$27,194 American Indian and Alaska Native householders$54,657 Two or more races householders$20,956 Hispanic or Latino race householdersMedian 2022 house value $373,840 White Non-Hispanic householders$506,430 American Indian or Alaska Native householders $444,662 Asian householders$293,315 Hispanic or Latino householders
Median age by race in Cheney
24.7 Median age for White residents25.4 24.1 24.3 Median age for Black or African American residents27.9 22.8 19.7 Median age for American Indian / Alaska Native residents11.2 18.5 21.8 Median age for Asian residents21.4 22.0 18.8 Median age for Native Hawaiian / Pacific Islander residents-518,787,878.3 18.0 25.3 Median age for Other race residents26.0 23.0 21.4 Median age for Two or more races residents24.7 20.6 25.2 Median age for White alone residents25.8 24.3 22.5 Median age for Hispanic or Latino residents22.8 22.0
Owner/renter occupied households by race in Cheney
House owners and renters - White residents 1,580 41.4% Owner occupied2,234 58.6% Renter occupiedHouse owners and renters - Black or African American residents 9 6.7% Owner occupied127 93.3% Renter occupiedHouse owners and renters - American Indian / Alaska Native residents 68 100.0% Renter occupiedHouse owners and renters - Asian residents 30 56.3% Owner occupied23 43.7% Renter occupiedHouse owners and renters - Native Hawaiian / Pacific Islander residents 8 100.0% Owner occupiedHouse owners and renters - Other race residents 28 8.0% Owner occupied320 92.0% Renter occupiedHouse owners and renters - Two or more races residents 182 29.8% Owner occupied428 70.2% Renter occupiedHouse owners and renters - White alone residents 1,579 43.4% Owner occupied2,060 56.6% Renter occupiedHouse owners and renters - Hispanic or Latino residents 31 5.2% Owner occupied559 94.8% Renter occupied
Language usage in Cheney
English speakers - Total 89.8% of residents of Cheney speak English at home.
4.1% of residents speak Spanish at home 428 83.4% Speak English very well85 16.6% Speak English less than very well5.8% of residents speak other language at home 449 62.3% Speak English very well272 37.7% Speak English less than very well
English speakers - Born in the United States 94.1% of residents of Cheney speak English at home.
1.8% of residents speak Spanish at home 44 51.8% Speak English very well41 48.2% Speak English less than very well3.2% of residents speak other language at home 118 75.2% Speak English very well39 24.8% Speak English less than very well
English speakers - Native, born elsewhere 95.6% of residents of Cheney speak English at home.
2.6% of residents speak other language at home 7 100.0% Speak English very well
English speakers - Foreign-born 21.4% of residents of Cheney speak English at home.
8.7% of residents speak Spanish at home 51 100.0% Speak English very well69.2% of residents speak other language at home 219 54.2% Speak English very well185 45.8% Speak English less than very well
White (Caucasian) - Speak only English Native:
96.8% (8,808)Foreign-born:
27.9% (106)
White (Caucasian) - Speak another language Native:
3.2% (290)Foreign-born:
70.7% (268)
Black or African American - Speak another language Native:
7.5% (27)Foreign-born:
97.1% (7)
Asian - Speak only English Native:
58.6% (92)Foreign-born:
20.3% (27)
Asian - Speak another language Native:
35.3% (56)Foreign-born:
79.3% (103)
Other race - Speak another language Native:
40.3% (371)Foreign-born:
81.4% (25)
Two or more races - Speak another language Native:
6.9% (95)Foreign-born:
96.9% (32)
White alone - Speak only English Native:
97.9% (8,584)Foreign-born:
27.2% (109)
White alone - Speak another language Native:
2.1% (186)Foreign-born:
71.4% (285)
Hispanic or Latino - Speak another language Native:
31.4% (477)Foreign-born:
92.1% (44)
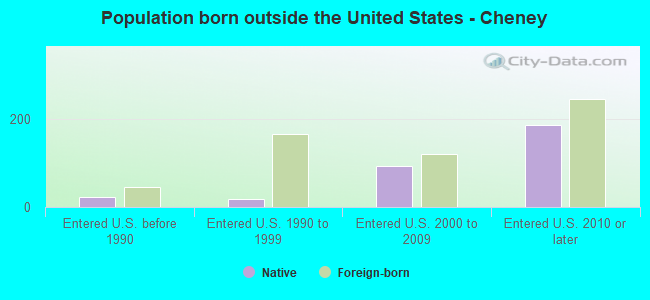
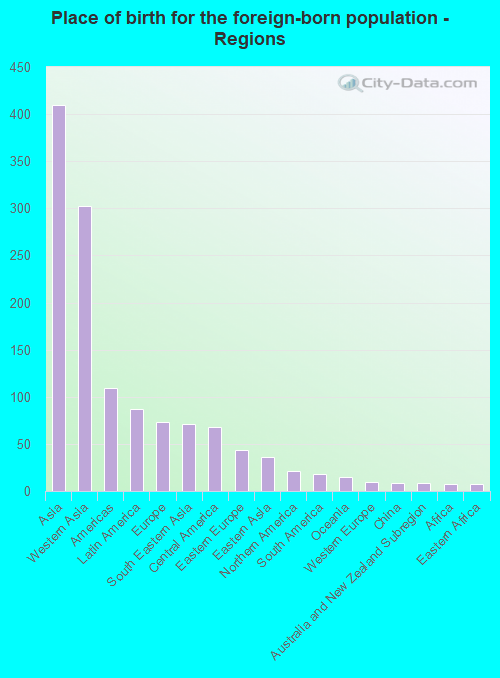
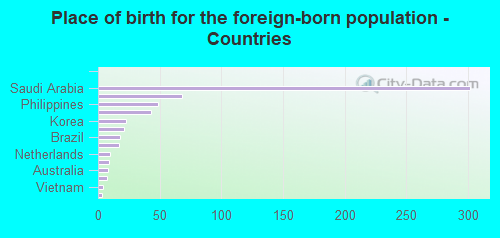
Foreign-born residents in Cheney 616 residents are foreign born (3.1% Asia , 0.6% Latin America , 0.5% Europe ).
This city:
4.7%Washington:
14.9%
Marital status for residents in Cheney Marital status - White (Caucasian) population 15 years and over
Males 56.7% Never married37.2% Now married0.0% Separated0.4% Widowed5.6% DivorcedFemales 52.6% Never married31.0% Now married0.9% Separated3.4% Widowed12.1% DivorcedWomen who gave birth in the past 12 months Now married:
12.8% (16)Unmarried:
87.2% (109)
Women who did not give birth in the past 12 months Now married:
27.0% (933)Unmarried:
73.0% (2,526)
Marital status - Black or African American population 15 years and over
Males 94.4% Never married5.6% Now married0.0% Separated0.0% Widowed0.0% DivorcedFemales 84.1% Never married0.0% Now married0.0% Separated0.0% Widowed15.9% DivorcedWomen who did not give birth in the past 12 months Now married:
0.0% (0)Unmarried:
100.0% (169)
Marital status - American Indian / Alaska Native population 15 years and over
Males 92.9% Never married7.1% Now married0.0% Separated0.0% Widowed0.0% DivorcedFemales 70.9% Never married29.1% Now married0.0% Separated0.0% Widowed0.0% DivorcedWomen who gave birth in the past 12 months Now married:
100.0% (27)Unmarried:
0.0% (0)
Women who did not give birth in the past 12 months Now married:
0.0% (0)Unmarried:
100.0% (66)
Marital status - Asian population 15 years and over
Males 93.4% Never married6.6% Now married0.0% Separated0.0% Widowed0.0% DivorcedFemales 53.3% Never married44.4% Now married0.0% Separated2.2% Widowed0.0% DivorcedWomen who did not give birth in the past 12 months Now married:
16.3% (15)Unmarried:
83.7% (75)
Marital status - Other race population 15 years and over
Males 77.7% Never married14.5% Now married0.0% Separated0.0% Widowed7.9% DivorcedFemales 78.9% Never married0.0% Now married7.8% Separated5.6% Widowed7.6% DivorcedWomen who gave birth in the past 12 months Now married:
0.0% (0)Unmarried:
100.0% (28)
Women who did not give birth in the past 12 months Now married:
10.9% (46)Unmarried:
89.1% (374)
Marital status - Two or more races population 15 years and over
Males 76.5% Never married23.5% Now married0.0% Separated0.0% Widowed0.0% DivorcedFemales 71.5% Never married14.0% Now married0.0% Separated4.3% Widowed10.2% DivorcedWomen who did not give birth in the past 12 months Now married:
11.2% (68)Unmarried:
88.8% (538)
Marital status - White alone, not Hispanic / Latino population 15 years and over
Males 55.5% Never married38.4% Now married0.0% Separated0.4% Widowed5.7% DivorcedFemales 51.2% Never married32.1% Now married0.6% Separated3.5% Widowed12.5% DivorcedWomen who gave birth in the past 12 months Now married:
14.8% (16)Unmarried:
85.2% (92)
Women who did not give birth in the past 12 months Now married:
27.6% (913)Unmarried:
72.4% (2,391)
Marital status - Hispanic or Latino population 15 years and over
Males 82.8% Never married15.9% Now married0.0% Separated0.0% Widowed1.3% DivorcedFemales 80.7% Never married4.0% Now married7.0% Separated3.5% Widowed4.8% DivorcedWomen who gave birth in the past 12 months Now married:
0.0% (0)Unmarried:
100.0% (19)
Women who did not give birth in the past 12 months Now married:
13.3% (96)Unmarried:
86.7% (630)
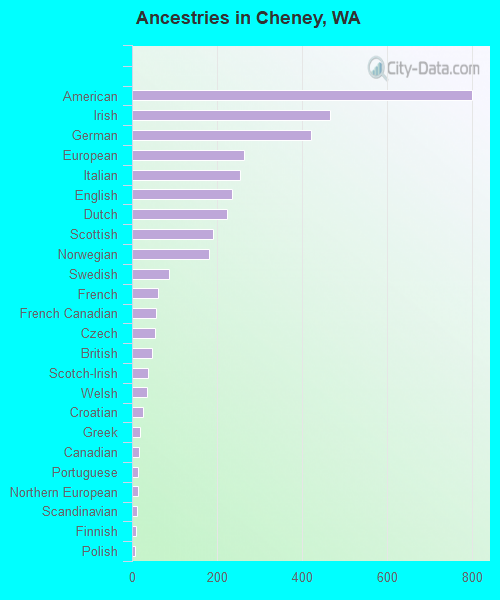
Ancestries in Cheney
801 14.7% American467 8.5% Irish422 7.7% German264 4.8% European255 4.7% Italian235 4.3% English223 4.1% Dutch192 3.5% Scottish182 3.3% Norwegian88 1.6% Swedish61 1.1% French56 1.0% French Canadian55 1.0% Czech48 0.9% British38 0.7% Scotch-Irish36 0.7% Welsh26 0.5% Croatian20 0.4% Greek16 0.3% Canadian15 0.3% Portuguese14 0.3% Northern European11 0.2% Scandinavian9 0.2% Finnish8 0.1% Polish7 0.1% Danish5 0.09% Russian5 0.09% Kenyan
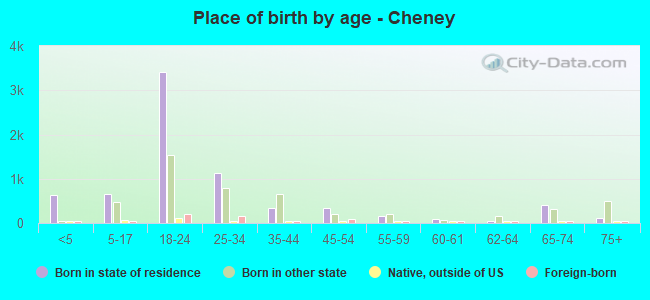
Children Nativity (place of birth) in Cheney
Children under 6 years - Living with two parents Both parents native 233 100.0% NativeBoth parents foreign-born 28 100.0% NativeChildren under 6 years - Living with one parent Native parent 393 100.0% NativeChildren 6 to 17 years - Living with two parents Both parents native 738 100.0% NativeOne native, one foreign-born parent 47 100.0% NativeChildren 6 to 17 years - Living with one parent Native parent 246 100.0% NativeForeign-born parent 79 53.6% Native68 46.4% Foreign-born
Grandparents responsible for own grandchildren in Cheney
Grandparents (30 to 59 years) White / Caucasian 4 12.2% Responsible for grandchildren32 87.8% Not responsible for grandchildrenWhite alone, not Hispanic / Latino 4 14.1% Responsible for grandchildren27 85.9% Not responsible for grandchildren
Grandparents (60 years and over) White / Caucasian 111 100.0% Not responsible for grandchildrenWhite alone, not Hispanic / Latino 110 100.0% Not responsible for grandchildren