Races in Chaska, Minnesota (MN) Detailed Stats
Data:
Races - White alone (%)
Races - White alone (% change since 2000)
Races - Black alone (%)
Races - Black alone (% change since 2000)
Races - American Indian alone (%)
Races - American Indian alone (% change since 2000)
Races - Asian alone (%)
Races - Asian alone (% change since 2000)
Races - Hispanic (%)
Races - Hispanic (% change since 2000)
Races - Native Hawaiian and Other Pacific Islander alone (%)
Races - Native Hawaiian and Other Pacific Islander alone (% change since 2000)
Races - Two or more races(%)
Races - Two or more races(% change since 2000)
Races - Other race alone (%)
Races - Other race alone (% change since 2000)
Racial diversity
Place of birth - Born in state of residence (%)
Place of birth - Born in state of residence (%) - White
Place of birth - Born in state of residence (%) - Black or African American
Place of birth - Born in state of residence (%) - Asian
Place of birth - Born in state of residence (%) - Hispanic or Latino
Place of birth - Born in state of residence (%) - American Indian and Alaska Native
Place of birth - Born in state of residence (%) - Multirace
Place of birth - Born in state of residence (%) - Other Race
Place of birth - Born in other state (%)
Place of birth - Born in other state (%) - White
Place of birth - Born in other state (%) - Black or African American
Place of birth - Born in other state (%) - Asian
Place of birth - Born in other state (%) - Hispanic or Latino
Place of birth - Born in other state (%) - American Indian and Alaska Native
Place of birth - Born in other state (%) - Multirace
Place of birth - Born in other state (%) - Other Race
Place of birth - Native, outside of US (%)
Place of birth - Native, outside of US (%) - White
Place of birth - Native, outside of US (%) - Black or African American
Place of birth - Native, outside of US (%) - Asian
Place of birth - Native, outside of US (%) - Hispanic or Latino
Place of birth - Native, outside of US (%) - American Indian and Alaska Native
Place of birth - Native, outside of US (%) - Multirace
Place of birth - Native, outside of US (%) - Other Race
Place of birth - Foreign born (%)
Place of birth - Foreign born (%) - White
Place of birth - Foreign born (%) - Black or African American
Place of birth - Foreign born (%) - Asian
Place of birth - Foreign born (%) - Hispanic or Latino
Place of birth - Foreign born (%) - American Indian and Alaska Native
Place of birth - Foreign born (%) - Multirace
Place of birth - Foreign born (%) - Other Race
Residents speaking English at home (%)
Residents speaking English at home - Born in the United States (%)
Residents speaking English at home - Native, born elsewhere (%)
Residents speaking English at home - Foreign born (%)
Residents speaking Spanish at home (%)
Residents speaking Spanish at home - Born in the United States (%)
Residents speaking Spanish at home - Native, born elsewhere (%)
Residents speaking Spanish at home - Foreign born (%)
Residents speaking other language at home (%)
Residents speaking other language at home - Born in the United States (%)
Residents speaking other language at home - Native, born elsewhere (%)
Residents speaking other language at home - Foreign born (%)
Marital status - Never married (%)
Marital status - Now married (%)
Marital status - Separated (%)
Marital status - Widowed (%)
Marital status - Divorced (%)
Ancestries Reported - Arab (%)
Ancestries Reported - Czech (%)
Ancestries Reported - Danish (%)
Ancestries Reported - Dutch (%)
Ancestries Reported - English (%)
Ancestries Reported - French (%)
Ancestries Reported - French Canadian (%)
Ancestries Reported - German (%)
Ancestries Reported - Greek (%)
Ancestries Reported - Hungarian (%)
Ancestries Reported - Irish (%)
Ancestries Reported - Italian (%)
Ancestries Reported - Lithuanian (%)
Ancestries Reported - Norwegian (%)
Ancestries Reported - Polish (%)
Ancestries Reported - Portuguese (%)
Ancestries Reported - Russian (%)
Ancestries Reported - Scotch-Irish (%)
Ancestries Reported - Scottish (%)
Ancestries Reported - Slovak (%)
Ancestries Reported - Subsaharan African (%)
Ancestries Reported - Swedish (%)
Ancestries Reported - Swiss (%)
Ancestries Reported - Ukrainian (%)
Ancestries Reported - United States (%)
Ancestries Reported - Welsh (%)
Ancestries Reported - West Indian (%)
Ancestries Reported - Other (%)
Geographical mobility - Same house 1 year ago (%)
Geographical mobility - Same house 1 year ago (%) - White
Geographical mobility - Same house 1 year ago (%) - Black or African American
Geographical mobility - Same house 1 year ago (%) - Asian
Geographical mobility - Same house 1 year ago (%) - Hispanic or Latino
Geographical mobility - Same house 1 year ago (%) - American Indian and Alaska Native
Geographical mobility - Same house 1 year ago (%) - Multirace
Geographical mobility - Same house 1 year ago (%) - Other Race
Geographical mobility - Moved within same county (%)
Geographical mobility - Moved within same county (%) - White
Geographical mobility - Moved within same county (%) - Black or African American
Geographical mobility - Moved within same county (%) - Asian
Geographical mobility - Moved within same county (%) - Hispanic or Latino
Geographical mobility - Moved within same county (%) - American Indian and Alaska Native
Geographical mobility - Moved within same county (%) - Multirace
Geographical mobility - Moved within same county (%) - Other Race
Geographical mobility - Moved from different county within same state (%)
Geographical mobility - Moved from different county within same state (%) - White
Geographical mobility - Moved from different county within same state (%) - Black or African American
Geographical mobility - Moved from different county within same state (%) - Asian
Geographical mobility - Moved from different county within same state (%) - Hispanic or Latino
Geographical mobility - Moved from different county within same state (%) - American Indian and Alaska Native
Geographical mobility - Moved from different county within same state (%) - Multirace
Geographical mobility - Moved from different county within same state (%) - Other Race
Geographical mobility - Moved from different state (%)
Geographical mobility - Moved from different state (%) - White
Geographical mobility - Moved from different state (%) - Black or African American
Geographical mobility - Moved from different state (%) - Asian
Geographical mobility - Moved from different state (%) - Hispanic or Latino
Geographical mobility - Moved from different state (%) - American Indian and Alaska Native
Geographical mobility - Moved from different state (%) - Multirace
Geographical mobility - Moved from different state (%) - Other Race
Geographical mobility - Moved from abroad (%)
Geographical mobility - Moved from abroad (%) - White
Geographical mobility - Moved from abroad (%) - Black or African American
Geographical mobility - Moved from abroad (%) - Asian
Geographical mobility - Moved from abroad (%) - Hispanic or Latino
Geographical mobility - Moved from abroad (%) - American Indian and Alaska Native
Geographical mobility - Moved from abroad (%) - Multirace
Geographical mobility - Moved from abroad (%) - Other Race
Place of birth for the foreign-born population - Ireland (%)
Place of birth for the foreign-born population - Denmark (%)
Place of birth for the foreign-born population - Norway (%)
Place of birth for the foreign-born population - Sweden (%)
Place of birth for the foreign-born population - United Kingdom (%)
Place of birth for the foreign-born population - England (%)
Place of birth for the foreign-born population - Scotland (%)
Place of birth for the foreign-born population - Other Northern Europe (%)
Place of birth for the foreign-born population - Austria (%)
Place of birth for the foreign-born population - Belgium (%)
Place of birth for the foreign-born population - France (%)
Place of birth for the foreign-born population - Germany (%)
Place of birth for the foreign-born population - Netherlands (%)
Place of birth for the foreign-born population - Switzerland (%)
Place of birth for the foreign-born population - Other Western Europe (%)
Place of birth for the foreign-born population - Greece (%)
Place of birth for the foreign-born population - Italy (%)
Place of birth for the foreign-born population - Portugal (%)
Place of birth for the foreign-born population - Spain (%)
Place of birth for the foreign-born population - Other Southern Europe (%)
Place of birth for the foreign-born population - Albania (%)
Place of birth for the foreign-born population - Belarus (%)
Place of birth for the foreign-born population - Bosnia and Herzegovina (%)
Place of birth for the foreign-born population - Bulgaria (%)
Place of birth for the foreign-born population - Croatia (%)
Place of birth for the foreign-born population - Czechoslovakia (%)
Place of birth for the foreign-born population - Hungary (%)
Place of birth for the foreign-born population - Latvia (%)
Place of birth for the foreign-born population - Lithuania (%)
Place of birth for the foreign-born population - North Macedonia (Macedonia) (%)
Place of birth for the foreign-born population - Moldova (%)
Place of birth for the foreign-born population - Poland (%)
Place of birth for the foreign-born population - Romania (%)
Place of birth for the foreign-born population - Russia (%)
Place of birth for the foreign-born population - Serbia (%)
Place of birth for the foreign-born population - Ukraine (%)
Place of birth for the foreign-born population - Other Eastern Europe (%)
Place of birth for the foreign-born population - China (%)
Place of birth for the foreign-born population - Hong Kong (%)
Place of birth for the foreign-born population - Taiwan (%)
Place of birth for the foreign-born population - Japan (%)
Place of birth for the foreign-born population - Korea (%)
Place of birth for the foreign-born population - Other Eastern Asia (%)
Place of birth for the foreign-born population - Afghanistan (%)
Place of birth for the foreign-born population - Bangladesh (%)
Place of birth for the foreign-born population - India (%)
Place of birth for the foreign-born population - Iran (%)
Place of birth for the foreign-born population - Kazakhstan (%)
Place of birth for the foreign-born population - Nepal (%)
Place of birth for the foreign-born population - Pakistan (%)
Place of birth for the foreign-born population - Sri Lanka (%)
Place of birth for the foreign-born population - Uzbekistan (%)
Place of birth for the foreign-born population - Other South Central Asia (%)
Place of birth for the foreign-born population - Burma (%)
Place of birth for the foreign-born population - Cambodia (%)
Place of birth for the foreign-born population - Indonesia (%)
Place of birth for the foreign-born population - Laos (%)
Place of birth for the foreign-born population - Malaysia (%)
Place of birth for the foreign-born population - Philippines (%)
Place of birth for the foreign-born population - Singapore (%)
Place of birth for the foreign-born population - Thailand (%)
Place of birth for the foreign-born population - Vietnam (%)
Place of birth for the foreign-born population - Other South Eastern Asia (%)
Place of birth for the foreign-born population - Armenia (%)
Place of birth for the foreign-born population - Iraq (%)
Place of birth for the foreign-born population - Israel (%)
Place of birth for the foreign-born population - Jordan (%)
Place of birth for the foreign-born population - Kuwait (%)
Place of birth for the foreign-born population - Lebanon (%)
Place of birth for the foreign-born population - Saudi Arabia (%)
Place of birth for the foreign-born population - Syria (%)
Place of birth for the foreign-born population - Turkey (%)
Place of birth for the foreign-born population - Yemen (%)
Place of birth for the foreign-born population - Other Western Asia (%)
Place of birth for the foreign-born population - Eritrea (%)
Place of birth for the foreign-born population - Ethiopia (%)
Place of birth for the foreign-born population - Kenya (%)
Place of birth for the foreign-born population - Somalia (%)
Place of birth for the foreign-born population - Uganda (%)
Place of birth for the foreign-born population - Zimbabwe (%)
Place of birth for the foreign-born population - Other Eastern Africa (%)
Place of birth for the foreign-born population - Cameroon (%)
Place of birth for the foreign-born population - Congo (%)
Place of birth for the foreign-born population - Democratic Republic of Congo (Zaire) (%)
Place of birth for the foreign-born population - Other Middle Africa (%)
Place of birth for the foreign-born population - Egypt (%)
Place of birth for the foreign-born population - Morocco (%)
Place of birth for the foreign-born population - Sudan (%)
Place of birth for the foreign-born population - Other Northern Africa (%)
Place of birth for the foreign-born population - South Africa (%)
Place of birth for the foreign-born population - Other Southern Africa (%)
Place of birth for the foreign-born population - Cabo Verde (%)
Place of birth for the foreign-born population - Ghana (%)
Place of birth for the foreign-born population - Liberia (%)
Place of birth for the foreign-born population - Nigeria (%)
Place of birth for the foreign-born population - Senegal (%)
Place of birth for the foreign-born population - Sierra Leone (%)
Place of birth for the foreign-born population - Other Western Africa (%)
Place of birth for the foreign-born population - Australia (%)
Place of birth for the foreign-born population - New Zealand (%)
Place of birth for the foreign-born population - Fiji (%)
Place of birth for the foreign-born population - Micronesia (%)
Place of birth for the foreign-born population - Bahamas (%)
Place of birth for the foreign-born population - Barbados (%)
Place of birth for the foreign-born population - Cuba (%)
Place of birth for the foreign-born population - Dominica (%)
Place of birth for the foreign-born population - Dominican Republic (%)
Place of birth for the foreign-born population - Grenada (%)
Place of birth for the foreign-born population - Haiti (%)
Place of birth for the foreign-born population - Jamaica (%)
Place of birth for the foreign-born population - St. Vincent and the Grenadines (%)
Place of birth for the foreign-born population - Trinidad and Tobago (%)
Place of birth for the foreign-born population - West Indies (%)
Place of birth for the foreign-born population - Other Caribbean (%)
Place of birth for the foreign-born population - Belize (%)
Place of birth for the foreign-born population - Costa Rica (%)
Place of birth for the foreign-born population - El Salvador (%)
Place of birth for the foreign-born population - Guatemala (%)
Place of birth for the foreign-born population - Honduras (%)
Place of birth for the foreign-born population - Mexico (%)
Place of birth for the foreign-born population - Nicaragua (%)
Place of birth for the foreign-born population - Panama (%)
Place of birth for the foreign-born population - Other Central America (%)
Place of birth for the foreign-born population - Argentina (%)
Place of birth for the foreign-born population - Bolivia (%)
Place of birth for the foreign-born population - Brazil (%)
Place of birth for the foreign-born population - Chile (%)
Place of birth for the foreign-born population - Colombia (%)
Place of birth for the foreign-born population - Ecuador (%)
Place of birth for the foreign-born population - Guyana (%)
Place of birth for the foreign-born population - Peru (%)
Place of birth for the foreign-born population - Uruguay (%)
Place of birth for the foreign-born population - Venezuela (%)
Place of birth for the foreign-born population - Other South America (%)
Place of birth for the foreign-born population - Canada (%)
Place of birth for the foreign-born population - Other Northern America (%)
Place of birth for the foreign-born population - Other (%)
Latest news about races in Chaska, MN collected exclusively by city-data.com from local newspapers, TV, and radio stations
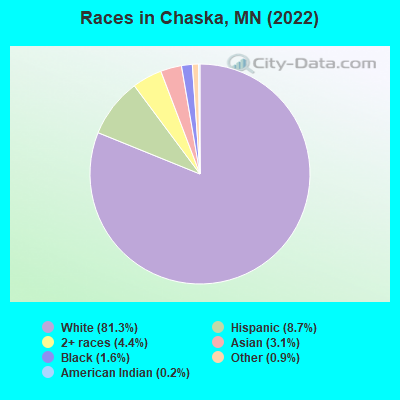
According to 2022 data, the most numerous races in Chaska, MN are White alone (23,168 residents), Black alone (451 residents), and Hispanic (2,487 residents). 90.2% of Chaska residents speak English at home. 6.9% of Chaska, MN residents are foreign-born (2.4% born in Asia, 2.3% born in Latin America, 1.4% born in Europe), which is 16.7% less than the foreign-born rate of 8.0% across the entire state of Minnesota.
Race distribution in Chaska
2000 2022
4,337,143 88.2% White alone 168,813 3.4% Black alone 143,382 2.9% Hispanic 141,083 2.9% Asian alone 70,304 1.4% Two or more races 52,009 1.1% American Indian alone 5,031 0.1% Other race alone 1,714 0.03% Native Hawaiian and Other
4,356,347 76.2% White alone 395,179 6.9% Black alone 333,830 5.8% Hispanic 294,800 5.2% Asian alone 259,649 4.5% Two or more races 42,125 0.7% American Indian alone 32,976 0.6% Other race alone 2,278 0.04% Native Hawaiian and Other
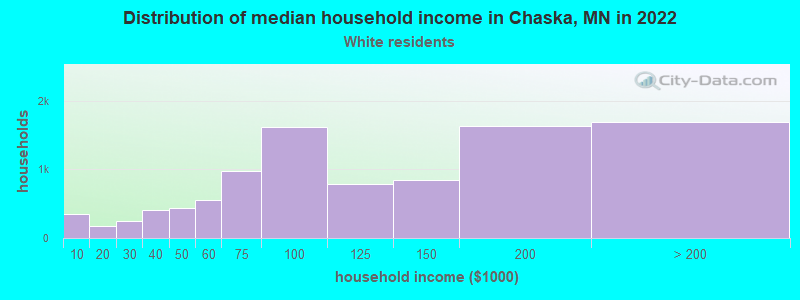
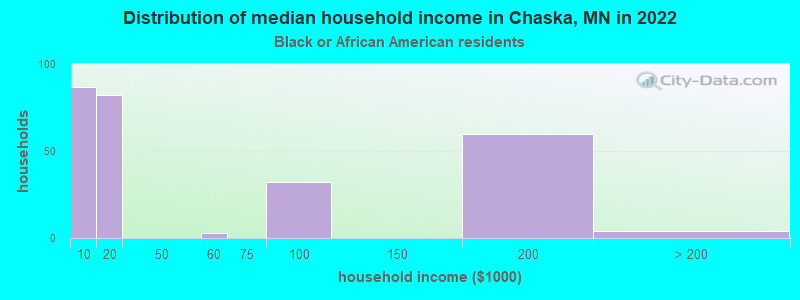
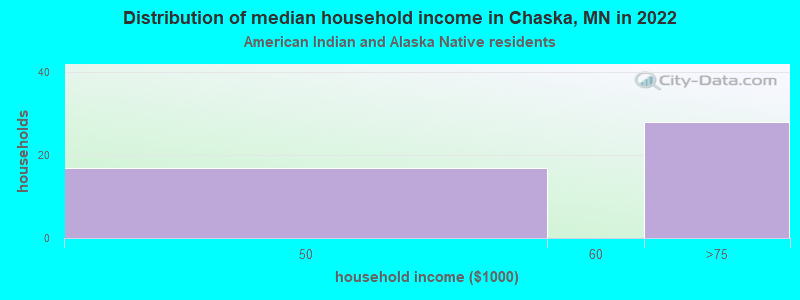
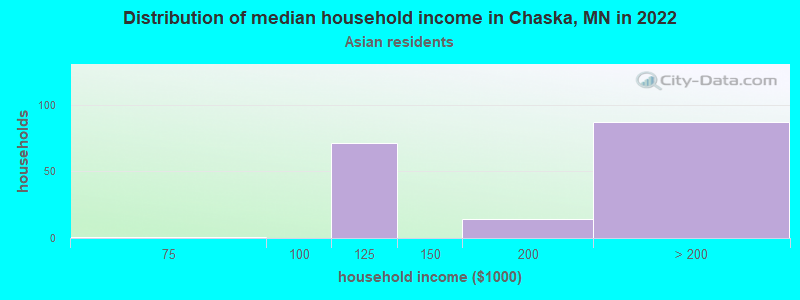
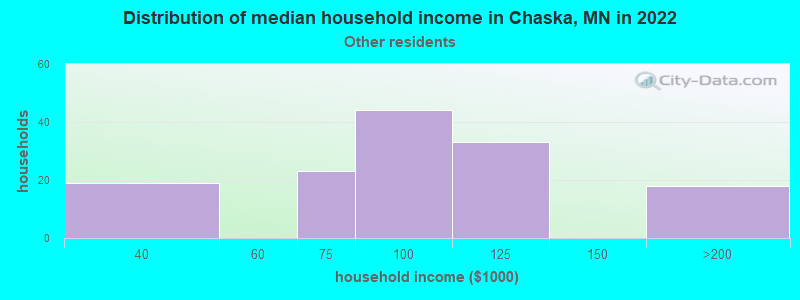
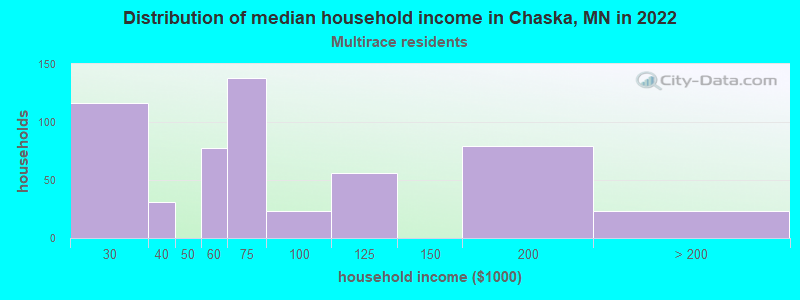
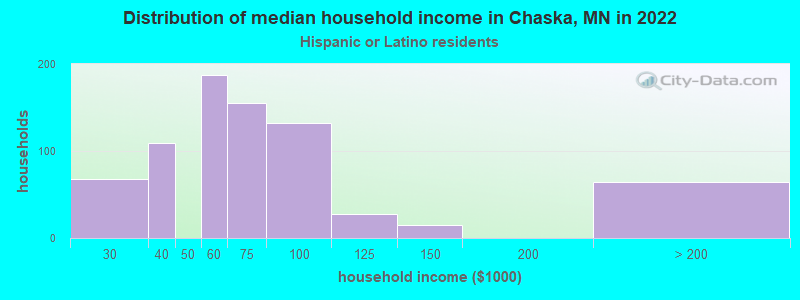
Income and house value in Chaska Median household income in 2022 $105,387 White non-Hispanic householders$162,122 Asian householders$79,588 Some other race householders$83,444 Two or more races householders$109,096 Hispanic or Latino race householdersMedian 2022 house value $399,018 White Non-Hispanic householders$378,733 Black or African American householders$235,007 American Indian or Alaska Native householders $490,795 Asian householders$168,958 Some other race householders$242,429 Hispanic or Latino householders
Median age by race in Chaska
39.6 Median age for White residents39.8 39.9 68.1 Median age for Black or African American residents83.5 63.5 32.9 Median age for American Indian / Alaska Native residents-502,666,666.2 37.6 30.6 Median age for Asian residents30.0 30.2 -744,336,568.8 Median age for Native Hawaiian / Pacific Islander residents-666,666,666.0 -666,666,666.0 20.4 Median age for Other race residents20.0 39.1 17.9 Median age for Two or more races residents24.8 17.7 39.9 Median age for White alone residents40.3 40.2 23.0 Median age for Hispanic or Latino residents19.6 24.0
Owner/renter occupied households by race in Chaska
House owners and renters - White residents 7,029 72.3% Owner occupied2,691 27.7% Renter occupiedHouse owners and renters - Black or African American residents 109 44.5% Owner occupied137 55.5% Renter occupiedHouse owners and renters - American Indian / Alaska Native residents 12 30.2% Owner occupied29 69.8% Renter occupiedHouse owners and renters - Asian residents 173 91.5% Owner occupied16 8.5% Renter occupiedHouse owners and renters - Other race residents 37 39.3% Owner occupied58 60.7% Renter occupiedHouse owners and renters - Two or more races residents 240 31.8% Owner occupied513 68.2% Renter occupiedHouse owners and renters - White alone residents 6,748 72.0% Owner occupied2,630 28.0% Renter occupiedHouse owners and renters - Hispanic or Latino residents 344 41.9% Owner occupied478 58.1% Renter occupied
Language usage in Chaska
English speakers - Total 90.2% of residents of Chaska speak English at home.
4.2% of residents speak Spanish at home 740 66.2% Speak English very well377 33.8% Speak English less than very well5.1% of residents speak other language at home 803 59.3% Speak English very well550 40.7% Speak English less than very well
English speakers - Born in the United States 87.5% of residents of Chaska speak English at home.
7.0% of residents speak Spanish at home 353 82.7% Speak English very well74 17.3% Speak English less than very well8.7% of residents speak other language at home 528 100.0% Speak English very well
English speakers - Native, born elsewhere 98.8% of residents of Chaska speak English at home.
1.9% of residents speak Spanish at home 5 100.0% Speak English very well6.9% of residents speak other language at home 18 100.0% Speak English very well
English speakers - Foreign-born 38.2% of residents of Chaska speak English at home.
17.1% of residents speak Spanish at home 167 59.9% Speak English very well112 40.1% Speak English less than very well41.5% of residents speak other language at home 280 41.4% Speak English very well396 58.6% Speak English less than very well
White (Caucasian) - Speak only English Native:
97.2% (21,127)Foreign-born:
47.0% (320)
White (Caucasian) - Speak another language Native:
2.2% (471)Foreign-born:
53.1% (362)
Black or African American - Speak only English Native:
85.4% (329)Foreign-born:
65.6% (126)
Black or African American - Speak another language Native:
14.2% (55)Foreign-born:
29.6% (57)
Asian - Speak only English Native:
38.3% (113)Foreign-born:
36.4% (143)
Asian - Speak another language Native:
63.7% (188)Foreign-born:
82.3% (323)
Other race - Speak another language Native:
24.1% (161)Foreign-born:
43.7% (95)
Two or more races - Speak only English Native:
78.0% (1,334)Foreign-born:
17.7% (69)
Two or more races - Speak another language Native:
21.5% (368)Foreign-born:
82.3% (322)
White alone - Speak only English Native:
98.0% (20,834)Foreign-born:
59.2% (303)
White alone - Speak another language Native:
1.9% (394)Foreign-born:
37.7% (193)
Hispanic or Latino - Speak only English Native:
57.5% (1,015)Foreign-born:
18.6% (87)
Hispanic or Latino - Speak another language Native:
38.0% (670)Foreign-born:
53.2% (249)
Foreign-born residents in Chaska 1,953 residents are foreign born (2.4% Asia , 2.3% Latin America , 1.4% Europe ).
This city:
6.9%Minnesota:
8.5%
Marital status for residents in Chaska Marital status - White (Caucasian) population 15 years and over
Males 32.6% Never married56.9% Now married0.5% Separated1.8% Widowed8.2% DivorcedFemales 25.0% Never married52.4% Now married1.1% Separated6.4% Widowed15.1% DivorcedWomen who gave birth in the past 12 months Now married:
82.5% (222)Unmarried:
17.5% (47)
Women who did not give birth in the past 12 months Now married:
49.7% (2,729)Unmarried:
50.3% (2,758)
Marital status - Black or African American population 15 years and over
Males 29.3% Never married60.2% Now married0.0% Separated0.0% Widowed10.5% DivorcedFemales 21.7% Never married30.9% Now married0.0% Separated9.2% Widowed38.2% DivorcedWomen who did not give birth in the past 12 months Now married:
28.3% (51)Unmarried:
71.7% (128)
Marital status - American Indian / Alaska Native population 15 years and over
Males 73.5% Never married26.5% Now married0.0% Separated0.0% Widowed0.0% DivorcedFemales 0.0% Never married61.3% Now married0.0% Separated0.0% Widowed38.7% DivorcedWomen who did not give birth in the past 12 months Now married:
100.0% (9)Unmarried:
0.0% (0)
Marital status - Asian population 15 years and over
Males 23.4% Never married68.6% Now married0.4% Separated0.0% Widowed7.7% DivorcedFemales 27.9% Never married52.9% Now married0.0% Separated3.4% Widowed15.8% DivorcedWomen who gave birth in the past 12 months Now married:
100.0% (21)Unmarried:
0.0% (0)
Women who did not give birth in the past 12 months Now married:
61.7% (191)Unmarried:
38.3% (118)
Marital status - Other race population 15 years and over
Males 71.4% Never married28.6% Now married0.0% Separated0.0% Widowed0.0% DivorcedFemales 44.0% Never married45.3% Now married0.0% Separated0.0% Widowed10.8% DivorcedWomen who did not give birth in the past 12 months Now married:
38.0% (102)Unmarried:
62.0% (166)
Marital status - Two or more races population 15 years and over
Males 41.2% Never married21.9% Now married0.0% Separated0.0% Widowed36.9% DivorcedFemales 61.9% Never married29.7% Now married0.0% Separated1.6% Widowed6.8% DivorcedWomen who did not give birth in the past 12 months Now married:
21.7% (135)Unmarried:
78.3% (488)
Marital status - White alone, not Hispanic / Latino population 15 years and over
Males 31.8% Never married57.2% Now married0.5% Separated1.9% Widowed8.5% DivorcedFemales 24.8% Never married53.3% Now married1.1% Separated6.6% Widowed14.2% DivorcedWomen who gave birth in the past 12 months Now married:
78.1% (172)Unmarried:
21.9% (48)
Women who did not give birth in the past 12 months Now married:
51.9% (2,753)Unmarried:
48.1% (2,556)
Marital status - Hispanic or Latino population 15 years and over
Males 52.5% Never married32.6% Now married0.0% Separated0.0% Widowed14.8% DivorcedFemales 44.8% Never married33.9% Now married0.0% Separated0.0% Widowed21.3% DivorcedWomen who gave birth in the past 12 months Now married:
100.0% (59)Unmarried:
0.0% (0)
Women who did not give birth in the past 12 months Now married:
17.0% (115)Unmarried:
83.0% (562)
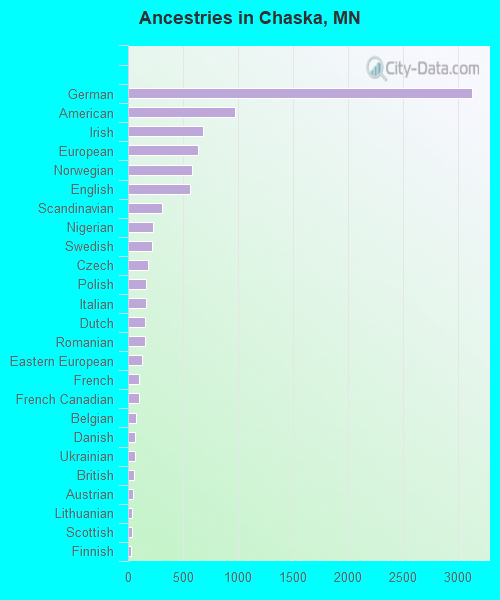
Ancestries in Chaska
3,130 26.0% German972 8.1% American682 5.7% Irish637 5.3% European580 4.8% Norwegian564 4.7% English306 2.5% Scandinavian226 1.9% Nigerian217 1.8% Swedish179 1.5% Czech168 1.4% Polish162 1.3% Italian157 1.3% Dutch153 1.3% Romanian124 1.0% Eastern European102 0.8% French98 0.8% French Canadian73 0.6% Belgian64 0.5% Danish60 0.5% Ukrainian57 0.5% British41 0.3% Austrian36 0.3% Lithuanian33 0.3% Scottish31 0.3% Finnish27 0.2% Bulgarian25 0.2% Scotch-Irish16 0.1% Latvian16 0.1% Croatian16 0.1% Portuguese11 0.09% Russian11 0.09% Czechoslovakian10 0.08% Greek6 0.05% Pennsylvania German6 0.05% Slovene
Geographical mobility in Chaska Same house 1 year ago 20,752 87.7% White (Caucasian)544 93.4% Black or African American43 62.7% American Indian / Alaska Native859 93.5% Asian633 94.1% Other race2,279 95.1% Two or more races20,236 87.9% White alone, not Hispanic / Latino1,850 81.4% Hispanic or LatinoMoved within same county 1,337 5.7% White / Caucasian15 2.6% Black or African American20 29.6% American Indian / Alaska Native47 5.2% Asian9 0.4% Two or more races1,210 5.3% White alone, not Hispanic / Latino232 10.2% Hispanic or LatinoMoved within same state 1,276 5.4% White / Caucasian11 1.9% Black or African American53 7.9% Other race111 4.6% Two or more races1,291 5.6% White alone, not Hispanic / Latino184 8.1% Hispanic or LatinoMoved from different state 206 0.9% White / Caucasian13 2.2% Black or African American14 1.5% Asian7 0.3% Two or more races211 0.9% White alone, not Hispanic / LatinoMoved from abroad 21 0.1% White22 0.1% White alone, not Hispanic / Latino
Children Nativity (place of birth) in Chaska
Children under 6 years - Living with two parents Both parents native 1,613 100.0% NativeBoth parents foreign-born 225 100.0% NativeOne native, one foreign-born parent 36 100.0% NativeChildren under 6 years - Living with one parent Native parent 234 100.0% NativeForeign-born parent 193 100.0% NativeChildren 6 to 17 years - Living with two parents Both parents native 2,947 100.0% NativeBoth parents foreign-born 133 62.5% Native80 37.5% Foreign-bornOne native, one foreign-born parent 213 92.0% Native19 8.0% Foreign-bornChildren 6 to 17 years - Living with one parent Native parent 1,437 100.0% NativeForeign-born parent 29 50.4% Native28 49.6% Foreign-born
Grandparents responsible for own grandchildren in Chaska
Grandparents (30 to 59 years) White / Caucasian 24 45.0% Responsible for grandchildren29 55.0% Not responsible for grandchildrenAsian 65 100.0% Not responsible for grandchildrenWhite alone, not Hispanic / Latino 25 45.0% Responsible for grandchildren30 55.0% Not responsible for grandchildrenGrandparents (60 years and over) White / Caucasian 9 4.3% Responsible for grandchildren196 95.7% Not responsible for grandchildrenAsian 9 100.0% Not responsible for grandchildrenWhite alone, not Hispanic / Latino 9 4.3% Responsible for grandchildren200 95.7% Not responsible for grandchildren