Races in Charlottesville, Virginia (VA) Detailed Stats
Data:
Races - White alone (%)
Races - White alone (% change since 2000)
Races - Black alone (%)
Races - Black alone (% change since 2000)
Races - American Indian alone (%)
Races - American Indian alone (% change since 2000)
Races - Asian alone (%)
Races - Asian alone (% change since 2000)
Races - Hispanic (%)
Races - Hispanic (% change since 2000)
Races - Native Hawaiian and Other Pacific Islander alone (%)
Races - Native Hawaiian and Other Pacific Islander alone (% change since 2000)
Races - Two or more races(%)
Races - Two or more races(% change since 2000)
Races - Other race alone (%)
Races - Other race alone (% change since 2000)
Racial diversity
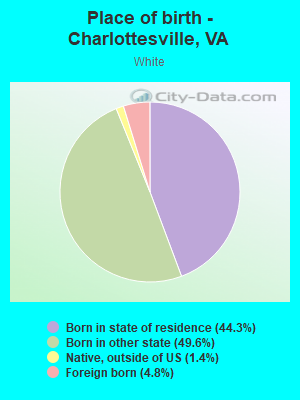
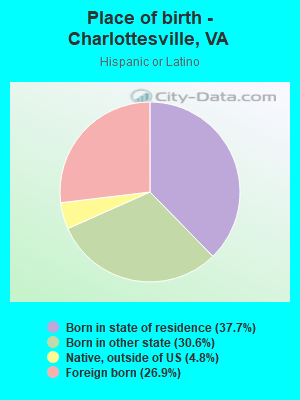
Place of birth - Born in state of residence (%)
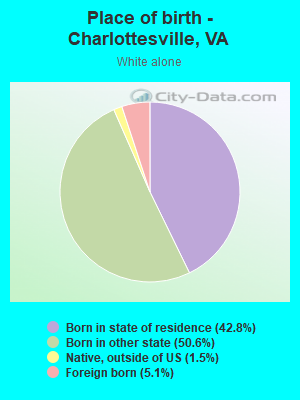
Place of birth - Born in state of residence (%) - White
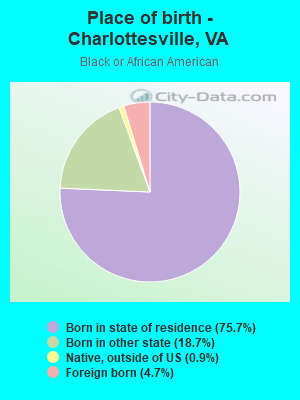
Place of birth - Born in state of residence (%) - Black or African American
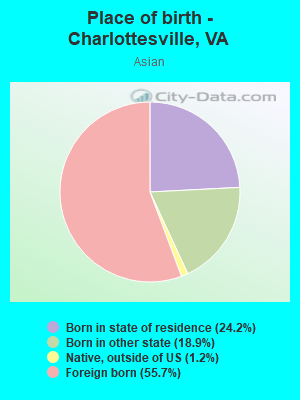
Place of birth - Born in state of residence (%) - Asian
Place of birth - Born in state of residence (%) - Hispanic or Latino
Place of birth - Born in state of residence (%) - American Indian and Alaska Native
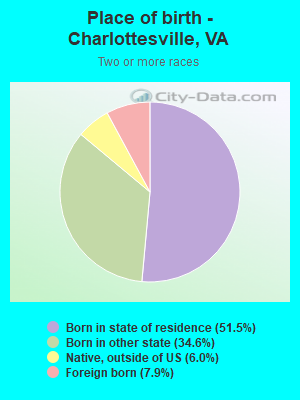
Place of birth - Born in state of residence (%) - Multirace
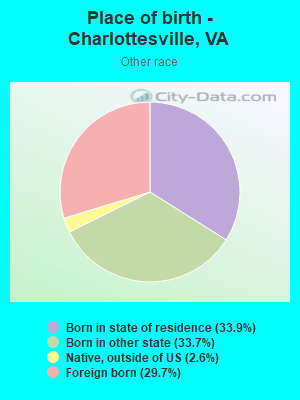
Place of birth - Born in state of residence (%) - Other Race
Place of birth - Born in other state (%)
Place of birth - Born in other state (%) - White
Place of birth - Born in other state (%) - Black or African American
Place of birth - Born in other state (%) - Asian
Place of birth - Born in other state (%) - Hispanic or Latino
Place of birth - Born in other state (%) - American Indian and Alaska Native
Place of birth - Born in other state (%) - Multirace
Place of birth - Born in other state (%) - Other Race
Place of birth - Native, outside of US (%)
Place of birth - Native, outside of US (%) - White
Place of birth - Native, outside of US (%) - Black or African American
Place of birth - Native, outside of US (%) - Asian
Place of birth - Native, outside of US (%) - Hispanic or Latino
Place of birth - Native, outside of US (%) - American Indian and Alaska Native
Place of birth - Native, outside of US (%) - Multirace
Place of birth - Native, outside of US (%) - Other Race
Place of birth - Foreign born (%)
Place of birth - Foreign born (%) - White
Place of birth - Foreign born (%) - Black or African American
Place of birth - Foreign born (%) - Asian
Place of birth - Foreign born (%) - Hispanic or Latino
Place of birth - Foreign born (%) - American Indian and Alaska Native
Place of birth - Foreign born (%) - Multirace
Place of birth - Foreign born (%) - Other Race
Residents speaking English at home (%)
Residents speaking English at home - Born in the United States (%)
Residents speaking English at home - Native, born elsewhere (%)
Residents speaking English at home - Foreign born (%)
Residents speaking Spanish at home (%)
Residents speaking Spanish at home - Born in the United States (%)
Residents speaking Spanish at home - Native, born elsewhere (%)
Residents speaking Spanish at home - Foreign born (%)
Residents speaking other language at home (%)
Residents speaking other language at home - Born in the United States (%)
Residents speaking other language at home - Native, born elsewhere (%)
Residents speaking other language at home - Foreign born (%)
Marital status - Never married (%)
Marital status - Now married (%)
Marital status - Separated (%)
Marital status - Widowed (%)
Marital status - Divorced (%)
Ancestries Reported - Arab (%)
Ancestries Reported - Czech (%)
Ancestries Reported - Danish (%)
Ancestries Reported - Dutch (%)
Ancestries Reported - English (%)
Ancestries Reported - French (%)
Ancestries Reported - French Canadian (%)
Ancestries Reported - German (%)
Ancestries Reported - Greek (%)
Ancestries Reported - Hungarian (%)
Ancestries Reported - Irish (%)
Ancestries Reported - Italian (%)
Ancestries Reported - Lithuanian (%)
Ancestries Reported - Norwegian (%)
Ancestries Reported - Polish (%)
Ancestries Reported - Portuguese (%)
Ancestries Reported - Russian (%)
Ancestries Reported - Scotch-Irish (%)
Ancestries Reported - Scottish (%)
Ancestries Reported - Slovak (%)
Ancestries Reported - Subsaharan African (%)
Ancestries Reported - Swedish (%)
Ancestries Reported - Swiss (%)
Ancestries Reported - Ukrainian (%)
Ancestries Reported - United States (%)
Ancestries Reported - Welsh (%)
Ancestries Reported - West Indian (%)
Ancestries Reported - Other (%)
Geographical mobility - Same house 1 year ago (%)
Geographical mobility - Same house 1 year ago (%) - White
Geographical mobility - Same house 1 year ago (%) - Black or African American
Geographical mobility - Same house 1 year ago (%) - Asian
Geographical mobility - Same house 1 year ago (%) - Hispanic or Latino
Geographical mobility - Same house 1 year ago (%) - American Indian and Alaska Native
Geographical mobility - Same house 1 year ago (%) - Multirace
Geographical mobility - Same house 1 year ago (%) - Other Race
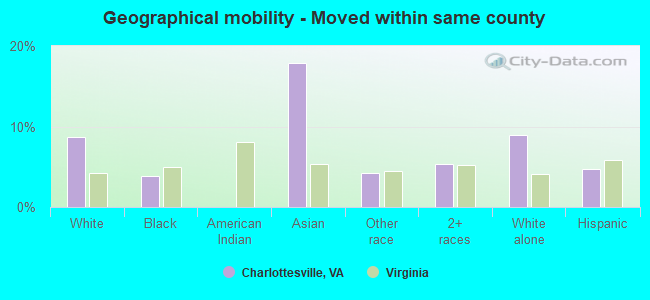
Geographical mobility - Moved within same county (%)
Geographical mobility - Moved within same county (%) - White
Geographical mobility - Moved within same county (%) - Black or African American
Geographical mobility - Moved within same county (%) - Asian
Geographical mobility - Moved within same county (%) - Hispanic or Latino
Geographical mobility - Moved within same county (%) - American Indian and Alaska Native
Geographical mobility - Moved within same county (%) - Multirace
Geographical mobility - Moved within same county (%) - Other Race
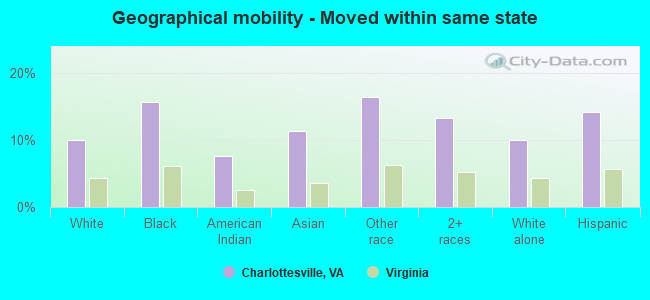
Geographical mobility - Moved from different county within same state (%)
Geographical mobility - Moved from different county within same state (%) - White
Geographical mobility - Moved from different county within same state (%) - Black or African American
Geographical mobility - Moved from different county within same state (%) - Asian
Geographical mobility - Moved from different county within same state (%) - Hispanic or Latino
Geographical mobility - Moved from different county within same state (%) - American Indian and Alaska Native
Geographical mobility - Moved from different county within same state (%) - Multirace
Geographical mobility - Moved from different county within same state (%) - Other Race
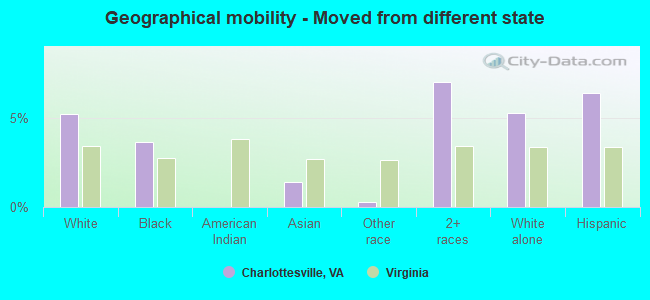
Geographical mobility - Moved from different state (%)
Geographical mobility - Moved from different state (%) - White
Geographical mobility - Moved from different state (%) - Black or African American
Geographical mobility - Moved from different state (%) - Asian
Geographical mobility - Moved from different state (%) - Hispanic or Latino
Geographical mobility - Moved from different state (%) - American Indian and Alaska Native
Geographical mobility - Moved from different state (%) - Multirace
Geographical mobility - Moved from different state (%) - Other Race
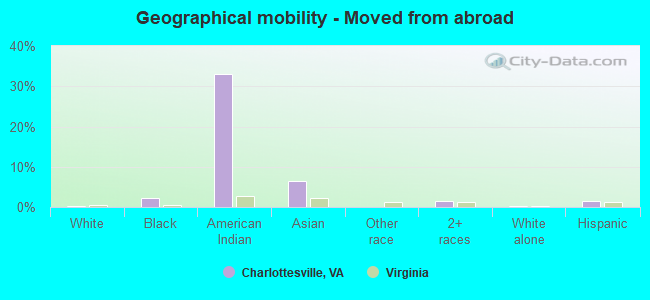
Geographical mobility - Moved from abroad (%)
Geographical mobility - Moved from abroad (%) - White
Geographical mobility - Moved from abroad (%) - Black or African American
Geographical mobility - Moved from abroad (%) - Asian
Geographical mobility - Moved from abroad (%) - Hispanic or Latino
Geographical mobility - Moved from abroad (%) - American Indian and Alaska Native
Geographical mobility - Moved from abroad (%) - Multirace
Geographical mobility - Moved from abroad (%) - Other Race
Place of birth for the foreign-born population - Ireland (%)
Place of birth for the foreign-born population - Denmark (%)
Place of birth for the foreign-born population - Norway (%)
Place of birth for the foreign-born population - Sweden (%)
Place of birth for the foreign-born population - United Kingdom (%)
Place of birth for the foreign-born population - England (%)
Place of birth for the foreign-born population - Scotland (%)
Place of birth for the foreign-born population - Other Northern Europe (%)
Place of birth for the foreign-born population - Austria (%)
Place of birth for the foreign-born population - Belgium (%)
Place of birth for the foreign-born population - France (%)
Place of birth for the foreign-born population - Germany (%)
Place of birth for the foreign-born population - Netherlands (%)
Place of birth for the foreign-born population - Switzerland (%)
Place of birth for the foreign-born population - Other Western Europe (%)
Place of birth for the foreign-born population - Greece (%)
Place of birth for the foreign-born population - Italy (%)
Place of birth for the foreign-born population - Portugal (%)
Place of birth for the foreign-born population - Spain (%)
Place of birth for the foreign-born population - Other Southern Europe (%)
Place of birth for the foreign-born population - Albania (%)
Place of birth for the foreign-born population - Belarus (%)
Place of birth for the foreign-born population - Bosnia and Herzegovina (%)
Place of birth for the foreign-born population - Bulgaria (%)
Place of birth for the foreign-born population - Croatia (%)
Place of birth for the foreign-born population - Czechoslovakia (%)
Place of birth for the foreign-born population - Hungary (%)
Place of birth for the foreign-born population - Latvia (%)
Place of birth for the foreign-born population - Lithuania (%)
Place of birth for the foreign-born population - North Macedonia (Macedonia) (%)
Place of birth for the foreign-born population - Moldova (%)
Place of birth for the foreign-born population - Poland (%)
Place of birth for the foreign-born population - Romania (%)
Place of birth for the foreign-born population - Russia (%)
Place of birth for the foreign-born population - Serbia (%)
Place of birth for the foreign-born population - Ukraine (%)
Place of birth for the foreign-born population - Other Eastern Europe (%)
Place of birth for the foreign-born population - China (%)
Place of birth for the foreign-born population - Hong Kong (%)
Place of birth for the foreign-born population - Taiwan (%)
Place of birth for the foreign-born population - Japan (%)
Place of birth for the foreign-born population - Korea (%)
Place of birth for the foreign-born population - Other Eastern Asia (%)
Place of birth for the foreign-born population - Afghanistan (%)
Place of birth for the foreign-born population - Bangladesh (%)
Place of birth for the foreign-born population - India (%)
Place of birth for the foreign-born population - Iran (%)
Place of birth for the foreign-born population - Kazakhstan (%)
Place of birth for the foreign-born population - Nepal (%)
Place of birth for the foreign-born population - Pakistan (%)
Place of birth for the foreign-born population - Sri Lanka (%)
Place of birth for the foreign-born population - Uzbekistan (%)
Place of birth for the foreign-born population - Other South Central Asia (%)
Place of birth for the foreign-born population - Burma (%)
Place of birth for the foreign-born population - Cambodia (%)
Place of birth for the foreign-born population - Indonesia (%)
Place of birth for the foreign-born population - Laos (%)
Place of birth for the foreign-born population - Malaysia (%)
Place of birth for the foreign-born population - Philippines (%)
Place of birth for the foreign-born population - Singapore (%)
Place of birth for the foreign-born population - Thailand (%)
Place of birth for the foreign-born population - Vietnam (%)
Place of birth for the foreign-born population - Other South Eastern Asia (%)
Place of birth for the foreign-born population - Armenia (%)
Place of birth for the foreign-born population - Iraq (%)
Place of birth for the foreign-born population - Israel (%)
Place of birth for the foreign-born population - Jordan (%)
Place of birth for the foreign-born population - Kuwait (%)
Place of birth for the foreign-born population - Lebanon (%)
Place of birth for the foreign-born population - Saudi Arabia (%)
Place of birth for the foreign-born population - Syria (%)
Place of birth for the foreign-born population - Turkey (%)
Place of birth for the foreign-born population - Yemen (%)
Place of birth for the foreign-born population - Other Western Asia (%)
Place of birth for the foreign-born population - Eritrea (%)
Place of birth for the foreign-born population - Ethiopia (%)
Place of birth for the foreign-born population - Kenya (%)
Place of birth for the foreign-born population - Somalia (%)
Place of birth for the foreign-born population - Uganda (%)
Place of birth for the foreign-born population - Zimbabwe (%)
Place of birth for the foreign-born population - Other Eastern Africa (%)
Place of birth for the foreign-born population - Cameroon (%)
Place of birth for the foreign-born population - Congo (%)
Place of birth for the foreign-born population - Democratic Republic of Congo (Zaire) (%)
Place of birth for the foreign-born population - Other Middle Africa (%)
Place of birth for the foreign-born population - Egypt (%)
Place of birth for the foreign-born population - Morocco (%)
Place of birth for the foreign-born population - Sudan (%)
Place of birth for the foreign-born population - Other Northern Africa (%)
Place of birth for the foreign-born population - South Africa (%)
Place of birth for the foreign-born population - Other Southern Africa (%)
Place of birth for the foreign-born population - Cabo Verde (%)
Place of birth for the foreign-born population - Ghana (%)
Place of birth for the foreign-born population - Liberia (%)
Place of birth for the foreign-born population - Nigeria (%)
Place of birth for the foreign-born population - Senegal (%)
Place of birth for the foreign-born population - Sierra Leone (%)
Place of birth for the foreign-born population - Other Western Africa (%)
Place of birth for the foreign-born population - Australia (%)
Place of birth for the foreign-born population - New Zealand (%)
Place of birth for the foreign-born population - Fiji (%)
Place of birth for the foreign-born population - Micronesia (%)
Place of birth for the foreign-born population - Bahamas (%)
Place of birth for the foreign-born population - Barbados (%)
Place of birth for the foreign-born population - Cuba (%)
Place of birth for the foreign-born population - Dominica (%)
Place of birth for the foreign-born population - Dominican Republic (%)
Place of birth for the foreign-born population - Grenada (%)
Place of birth for the foreign-born population - Haiti (%)
Place of birth for the foreign-born population - Jamaica (%)
Place of birth for the foreign-born population - St. Vincent and the Grenadines (%)
Place of birth for the foreign-born population - Trinidad and Tobago (%)
Place of birth for the foreign-born population - West Indies (%)
Place of birth for the foreign-born population - Other Caribbean (%)
Place of birth for the foreign-born population - Belize (%)
Place of birth for the foreign-born population - Costa Rica (%)
Place of birth for the foreign-born population - El Salvador (%)
Place of birth for the foreign-born population - Guatemala (%)
Place of birth for the foreign-born population - Honduras (%)
Place of birth for the foreign-born population - Mexico (%)
Place of birth for the foreign-born population - Nicaragua (%)
Place of birth for the foreign-born population - Panama (%)
Place of birth for the foreign-born population - Other Central America (%)
Place of birth for the foreign-born population - Argentina (%)
Place of birth for the foreign-born population - Bolivia (%)
Place of birth for the foreign-born population - Brazil (%)
Place of birth for the foreign-born population - Chile (%)
Place of birth for the foreign-born population - Colombia (%)
Place of birth for the foreign-born population - Ecuador (%)
Place of birth for the foreign-born population - Guyana (%)
Place of birth for the foreign-born population - Peru (%)
Place of birth for the foreign-born population - Uruguay (%)
Place of birth for the foreign-born population - Venezuela (%)
Place of birth for the foreign-born population - Other South America (%)
Place of birth for the foreign-born population - Canada (%)
Place of birth for the foreign-born population - Other Northern America (%)
Place of birth for the foreign-born population - Other (%)
Latest news about races in Charlottesville, VA collected exclusively by city-data.com from local newspapers, TV, and radio stations
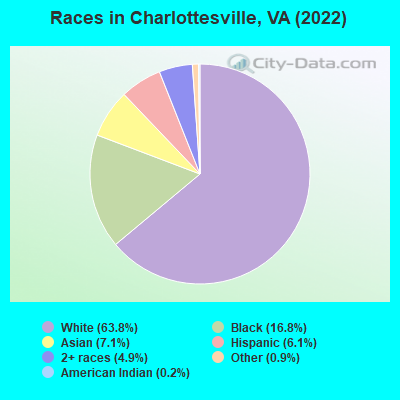
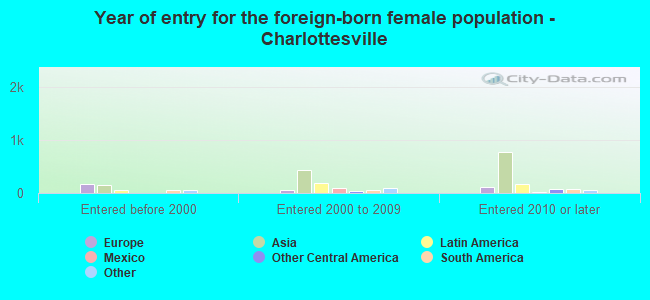
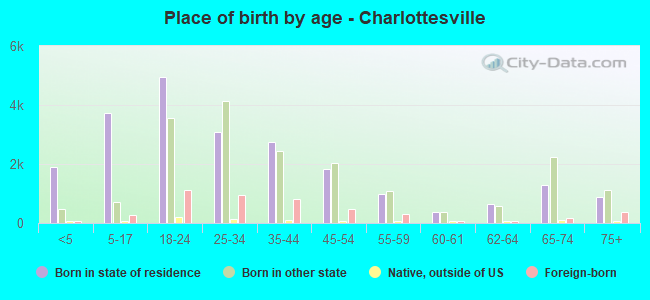
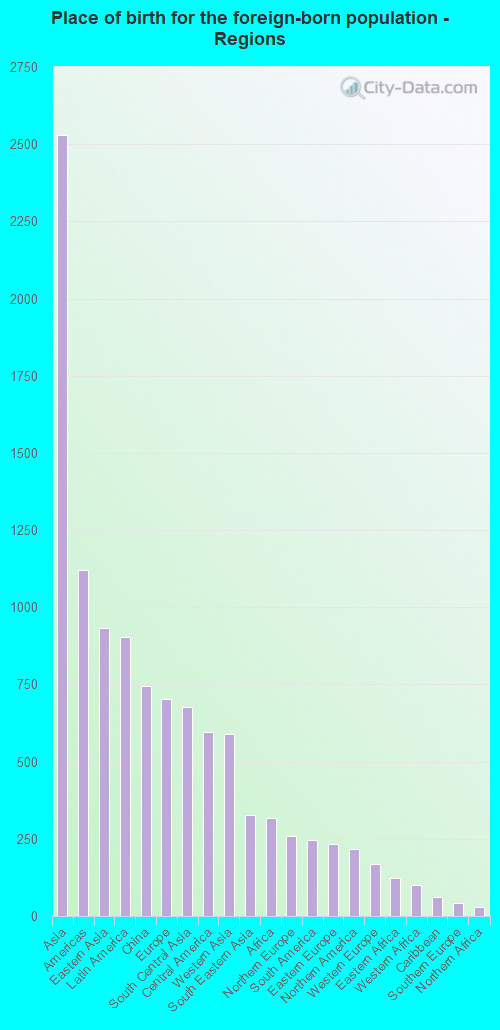
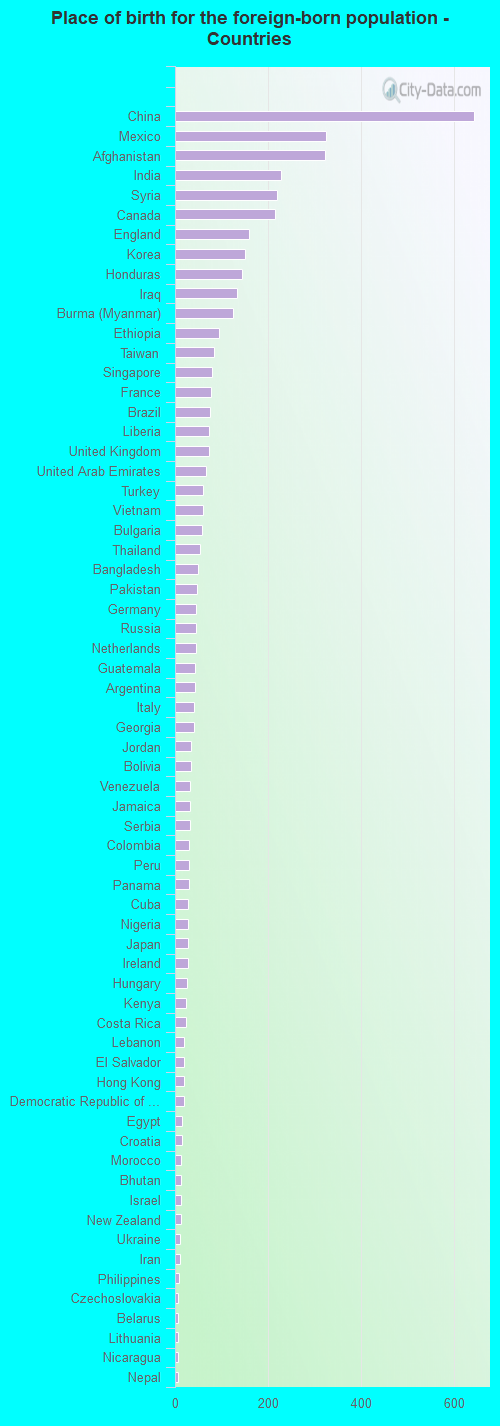
According to 2022 data, the most numerous races in Charlottesville, VA are White alone (29,756 residents), Black alone (7,828 residents), and Hispanic (2,832 residents). 86.0% of Charlottesville residents speak English at home. 10.1% of Charlottesville, VA residents are foreign-born (5.4% born in Asia, 1.9% born in Latin America, 1.5% born in Europe), which is 19.3% less than the foreign-born rate of 12.0% across the entire state of Virginia.
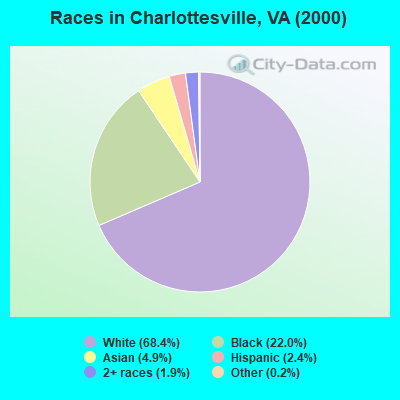
Race distribution in Charlottesville
2000 2022
4,965,637 70.2% White alone 1,376,378 19.4% Black alone 329,540 4.7% Hispanic 259,277 3.7% Asian alone 114,022 1.6% Two or more races 18,596 0.3% American Indian alone 11,685 0.2% Other race alone 3,380 0.05% Native Hawaiian and Other
5,095,130 58.7% White alone 1,594,785 18.4% Black alone 905,750 10.4% Hispanic 602,881 6.9% Asian alone 406,047 4.7% Two or more races 60,419 0.7% Other race alone 11,738 0.1% American Indian alone 6,869 0.08% Native Hawaiian and Other
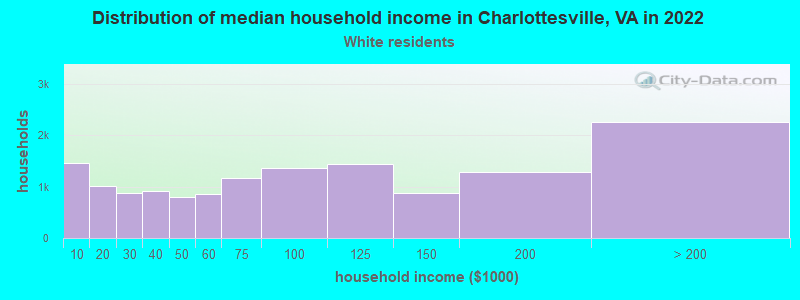
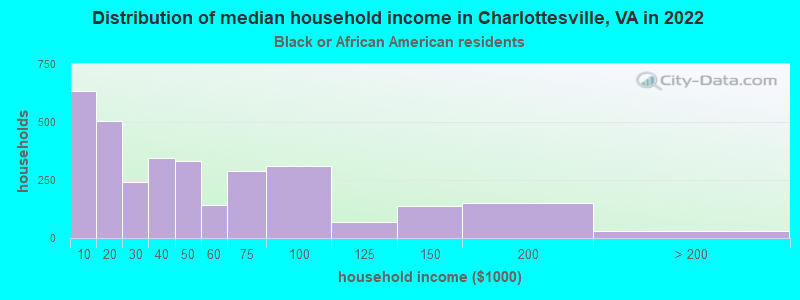
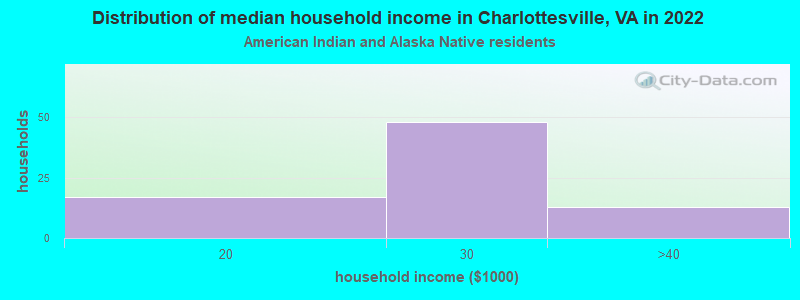
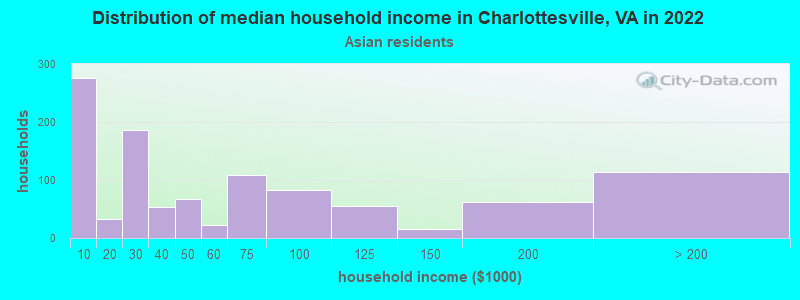
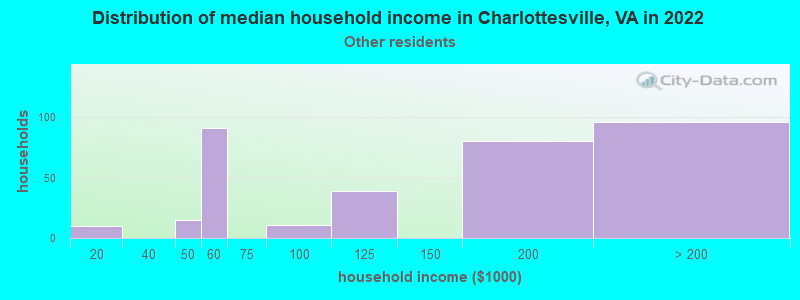
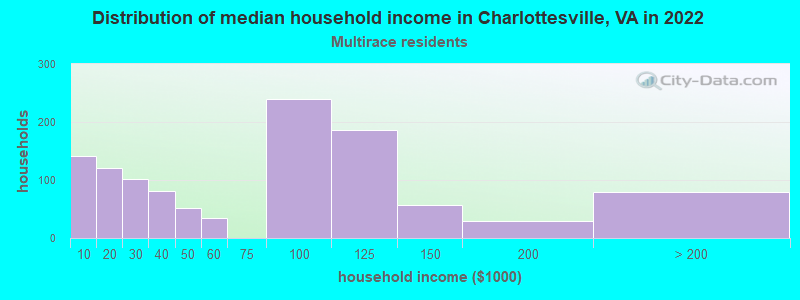
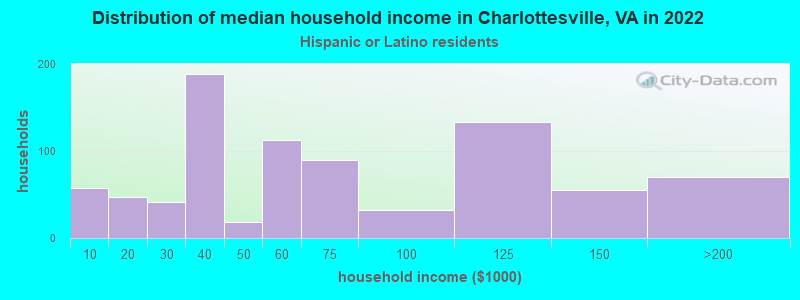
Income and house value in Charlottesville Median household income in 2022 $82,010 White non-Hispanic householders$38,368 Black householders$28,071 American Indian and Alaska Native householders$37,875 Asian householders$80,772 Two or more races householders$57,259 Hispanic or Latino race householdersMedian 2022 house value $476,811 White Non-Hispanic householders$260,972 Black or African American householders $414,571 Asian householders$591,464 Some other race householders$377,809 Two or more races householders$442,961 Hispanic or Latino householders
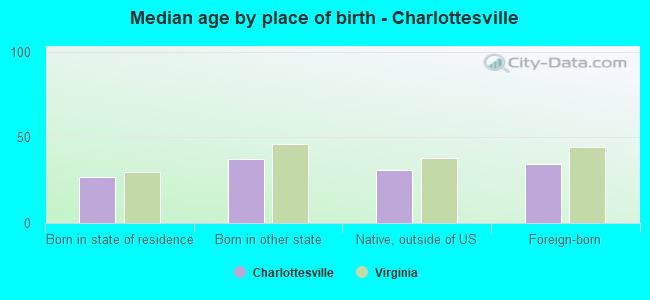
Median age by race in Charlottesville
34.8 Median age for White residents34.7 34.8 34.7 Median age for Black or African American residents32.3 38.4 45.9 Median age for American Indian / Alaska Native residents-682,352,940.5 46.3 23.0 Median age for Asian residents23.6 21.8 -611,955,419.9 Median age for Native Hawaiian / Pacific Islander residents-541,531,822.5 -714,150,046.8 25.9 Median age for Other race residents22.4 26.6 27.7 Median age for Two or more races residents18.9 33.8 34.6 Median age for White alone residents34.5 34.7 24.2 Median age for Hispanic or Latino residents24.1 23.1
Owner/renter occupied households by race in Charlottesville
House owners and renters - White residents 6,686 47.9% Owner occupied7,261 52.1% Renter occupiedHouse owners and renters - Black or African American residents 875 28.4% Owner occupied2,204 71.6% Renter occupiedHouse owners and renters - American Indian / Alaska Native residents 80 100.0% Renter occupiedHouse owners and renters - Asian residents 332 31.1% Owner occupied736 68.9% Renter occupiedHouse owners and renters - Other race residents 100 27.3% Owner occupied267 72.7% Renter occupiedHouse owners and renters - Two or more races residents 520 45.3% Owner occupied628 54.7% Renter occupiedHouse owners and renters - White alone residents 6,640 48.3% Owner occupied7,115 51.7% Renter occupiedHouse owners and renters - Hispanic or Latino residents 270 31.6% Owner occupied582 68.4% Renter occupied
Language usage in Charlottesville
English speakers - Total 86.0% of residents of Charlottesville speak English at home.
3.7% of residents speak Spanish at home 1,174 71.4% Speak English very well470 28.6% Speak English less than very well10.2% of residents speak other language at home 3,326 73.3% Speak English very well1,211 26.7% Speak English less than very well
English speakers - Born in the United States 93.1% of residents of Charlottesville speak English at home.
1.6% of residents speak Spanish at home 274 91.3% Speak English very well26 8.7% Speak English less than very well5.2% of residents speak other language at home 851 88.8% Speak English very well107 11.2% Speak English less than very well
English speakers - Native, born elsewhere 68.1% of residents of Charlottesville speak English at home.
23.0% of residents speak Spanish at home 183 100.0% Speak English very well8.7% of residents speak other language at home 69 100.0% Speak English very well
English speakers - Foreign-born 26.2% of residents of Charlottesville speak English at home.
16.0% of residents speak Spanish at home 338 45.2% Speak English very well409 54.8% Speak English less than very well58.2% of residents speak other language at home 1,658 60.9% Speak English very well1,066 39.1% Speak English less than very well
White (Caucasian) - Speak only English Native:
97.5% (26,822)Foreign-born:
37.1% (535)
White (Caucasian) - Speak another language Native:
2.6% (725)Foreign-born:
64.8% (934)
Black or African American - Speak only English Native:
96.3% (6,896)Foreign-born:
38.7% (144)
Black or African American - Speak another language Native:
3.8% (271)Foreign-born:
59.1% (221)
Asian - Speak only English Native:
34.3% (470)Foreign-born:
21.7% (408)
Asian - Speak another language Native:
68.9% (945)Foreign-born:
78.9% (1,483)
Other race - Speak only English Native:
83.0% (406)Foreign-born:
8.5% (19)
Other race - Speak another language Native:
22.5% (110)Foreign-born:
91.5% (209)
Two or more races - Speak only English Native:
76.7% (2,108)Foreign-born:
24.3% (64)
Two or more races - Speak another language Native:
23.8% (655)Foreign-born:
74.9% (197)
White alone - Speak only English Native:
97.6% (26,476)Foreign-born:
40.0% (552)
White alone - Speak another language Native:
2.4% (649)Foreign-born:
59.4% (821)
Hispanic or Latino - Speak only English Native:
62.7% (1,121)Foreign-born:
4.4% (35)
Hispanic or Latino - Speak another language Native:
37.9% (677)Foreign-born:
95.4% (746)
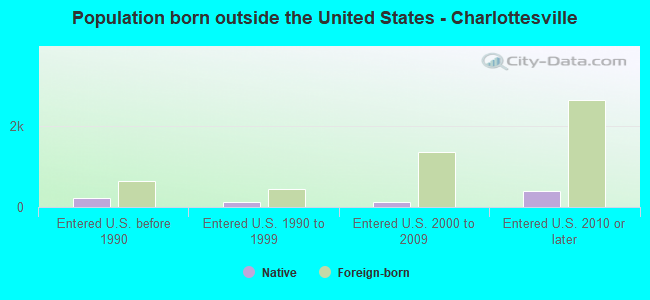
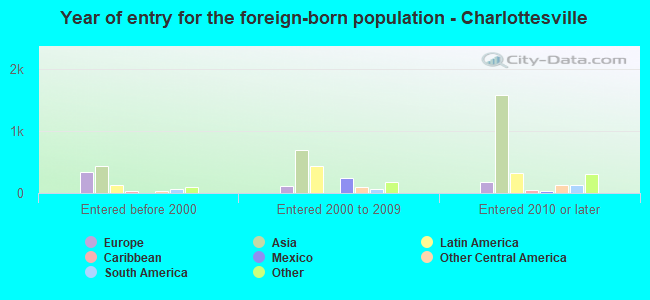
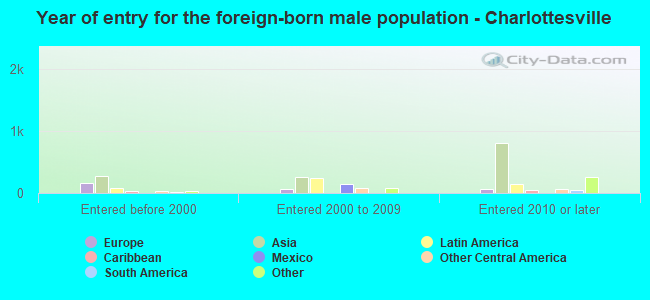
Foreign-born residents in Charlottesville 4,686 residents are foreign born (5.4% Asia , 1.9% Latin America , 1.5% Europe ).
This city:
10.1%Virginia:
12.6%
Marital status for residents in Charlottesville Marital status - White (Caucasian) population 15 years and over
Males 49.6% Never married40.5% Now married1.0% Separated1.3% Widowed7.7% DivorcedFemales 45.1% Never married35.2% Now married1.4% Separated4.7% Widowed13.7% DivorcedWomen who gave birth in the past 12 months Now married:
91.4% (309)Unmarried:
8.6% (29)
Women who did not give birth in the past 12 months Now married:
27.7% (2,384)Unmarried:
72.3% (6,234)
Marital status - Black or African American population 15 years and over
Males 53.7% Never married23.1% Now married1.9% Separated6.4% Widowed14.9% DivorcedFemales 52.5% Never married21.8% Now married2.5% Separated7.7% Widowed15.6% DivorcedWomen who gave birth in the past 12 months Now married:
44.4% (32)Unmarried:
55.6% (40)
Women who did not give birth in the past 12 months Now married:
19.5% (384)Unmarried:
80.5% (1,588)
Marital status - Asian population 15 years and over
Males 70.8% Never married26.1% Now married0.0% Separated0.0% Widowed3.1% DivorcedFemales 69.4% Never married21.9% Now married2.1% Separated5.0% Widowed1.5% DivorcedWomen who did not give birth in the past 12 months Now married:
22.7% (291)Unmarried:
77.3% (992)
Marital status - Other race population 15 years and over
Males 51.2% Never married43.3% Now married0.0% Separated0.0% Widowed5.6% DivorcedFemales 53.9% Never married42.9% Now married0.0% Separated3.2% Widowed0.0% DivorcedWomen who gave birth in the past 12 months Now married:
100.0% (50)Unmarried:
0.0% (0)
Women who did not give birth in the past 12 months Now married:
29.6% (84)Unmarried:
70.4% (200)
Marital status - Two or more races population 15 years and over
Males 56.9% Never married25.1% Now married3.5% Separated0.0% Widowed14.5% DivorcedFemales 55.6% Never married28.1% Now married0.0% Separated1.3% Widowed15.0% DivorcedWomen who gave birth in the past 12 months Now married:
0.0% (0)Unmarried:
100.0% (37)
Women who did not give birth in the past 12 months Now married:
28.5% (391)Unmarried:
71.5% (982)
Marital status - White alone, not Hispanic / Latino population 15 years and over
Males 49.6% Never married40.1% Now married0.9% Separated1.4% Widowed8.0% DivorcedFemales 44.8% Never married35.3% Now married1.2% Separated4.9% Widowed13.9% DivorcedWomen who gave birth in the past 12 months Now married:
90.9% (302)Unmarried:
9.1% (30)
Women who did not give birth in the past 12 months Now married:
27.5% (2,358)Unmarried:
72.5% (6,212)
Marital status - Hispanic or Latino population 15 years and over
Males 46.2% Never married47.6% Now married1.5% Separated0.0% Widowed4.7% DivorcedFemales 60.5% Never married25.7% Now married3.8% Separated0.8% Widowed9.3% DivorcedWomen who gave birth in the past 12 months Now married:
42.6% (21)Unmarried:
57.4% (29)
Women who did not give birth in the past 12 months Now married:
25.3% (195)Unmarried:
74.7% (575)
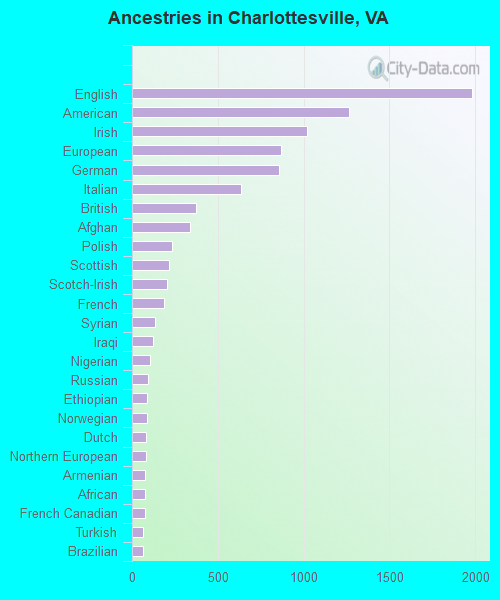
Ancestries in Charlottesville
1,982 8.8% English1,265 5.6% American1,022 4.5% Irish866 3.8% European855 3.8% German636 2.8% Italian373 1.7% British336 1.5% Afghan231 1.0% Polish214 0.9% Scottish204 0.9% Scotch-Irish184 0.8% French136 0.6% Syrian125 0.6% Iraqi103 0.5% Nigerian92 0.4% Russian88 0.4% Ethiopian88 0.4% Norwegian80 0.4% Dutch79 0.4% Northern European78 0.3% Armenian76 0.3% African73 0.3% French Canadian64 0.3% Turkish63 0.3% Brazilian63 0.3% Greek61 0.3% Arab58 0.3% Hungarian57 0.3% Swedish41 0.2% Lebanese40 0.2% Eastern European38 0.2% Finnish38 0.2% Serbian35 0.2% Lithuanian34 0.2% Iranian34 0.2% Liberian31 0.1% Jamaican30 0.1% Pennsylvania German26 0.1% Canadian25 0.1% Swiss22 0.10% Ukrainian19 0.08% Bulgarian13 0.06% Welsh10 0.04% Egyptian10 0.04% Haitian7 0.03% Romanian6 0.03% Scandinavian6 0.03% Czech6 0.03% Slovak4 0.02% Portuguese
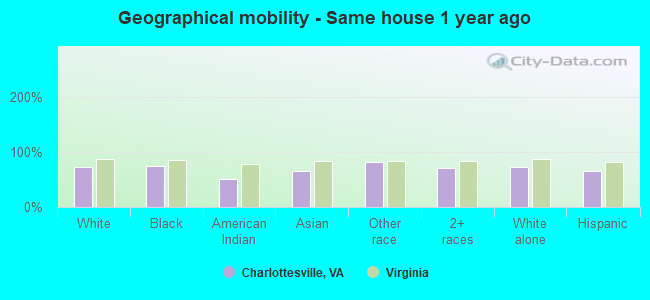
Geographical mobility in Charlottesville Same house 1 year ago 22,161 73.7% White (Caucasian)5,832 74.8% Black or African American39 50.8% American Indian / Alaska Native2,189 65.3% Asian576 81.8% Other race2,526 70.6% Two or more races21,747 73.6% White alone, not Hispanic / Latino1,858 66.3% Hispanic or LatinoMoved within same county 2,631 8.8% White / Caucasian303 3.9% Black or African American598 17.9% Asian29 4.2% Other race189 5.3% Two or more races2,637 8.9% White alone, not Hispanic / Latino133 4.8% Hispanic or LatinoMoved within same state 3,311 11.0% White / Caucasian1,393 17.9% Black or African American17 21.6% American Indian / Alaska Native388 11.6% Asian96 13.6% Other race502 14.0% Two or more races3,209 10.9% White alone, not Hispanic / Latino499 17.8% Hispanic or LatinoMoved from different state 1,556 5.2% White / Caucasian291 3.7% Black or African American51 1.5% Asian3 0.4% Other race317 8.9% Two or more races1,528 5.2% White alone, not Hispanic / Latino269 9.6% Hispanic or LatinoMoved from abroad 91 0.3% White50 0.6% Black or African American23 30.3% American Indian / Alaska Native149 4.4% Asian54 1.5% Two or more races86 0.3% White alone, not Hispanic / Latino60 2.1% Hispanic or Latino
Children Nativity (place of birth) in Charlottesville
Children under 6 years - Living with two parents Both parents native 1,312 100.0% Native0 0.0% Foreign-bornBoth parents foreign-born 210 78.4% Native58 21.6% Foreign-bornOne native, one foreign-born parent 149 100.0% NativeChildren under 6 years - Living with one parent Native parent 756 99.6% Native3 0.4% Foreign-bornForeign-born parent 145 98.6% Native2 1.4% Foreign-bornChildren 6 to 17 years - Living with two parents Both parents native 1,655 98.5% Native26 1.5% Foreign-bornBoth parents foreign-born 152 45.7% Native181 54.3% Foreign-bornOne native, one foreign-born parent 201 100.0% NativeChildren 6 to 17 years - Living with one parent Native parent 1,888 100.0% NativeForeign-born parent 104 51.6% Native98 48.4% Foreign-born
Grandparents responsible for own grandchildren in Charlottesville
Grandparents (30 to 59 years) White / Caucasian 22 100.0% Not responsible for grandchildrenBlack or African American 43 46.8% Responsible for grandchildren49 53.2% Not responsible for grandchildrenAsian 21 100.0% Not responsible for grandchildrenWhite alone, not Hispanic / Latino 25 100.0% Not responsible for grandchildren
Grandparents (60 years and over) White / Caucasian 80 100.0% Not responsible for grandchildrenBlack or African American 69 100.0% Not responsible for grandchildrenAsian 97 100.0% Not responsible for grandchildrenWhite alone, not Hispanic / Latino 85 100.0% Not responsible for grandchildren