Races in Chaparral, New Mexico (NM) Detailed Stats
Data:
Races - White alone (%)
Races - White alone (% change since 2000)
Races - Black alone (%)
Races - Black alone (% change since 2000)
Races - American Indian alone (%)
Races - American Indian alone (% change since 2000)
Races - Asian alone (%)
Races - Asian alone (% change since 2000)
Races - Hispanic (%)
Races - Hispanic (% change since 2000)
Races - Native Hawaiian and Other Pacific Islander alone (%)
Races - Native Hawaiian and Other Pacific Islander alone (% change since 2000)
Races - Two or more races(%)
Races - Two or more races(% change since 2000)
Races - Other race alone (%)
Races - Other race alone (% change since 2000)
Racial diversity
Place of birth - Born in state of residence (%)
Place of birth - Born in state of residence (%) - White
Place of birth - Born in state of residence (%) - Black or African American
Place of birth - Born in state of residence (%) - Asian
Place of birth - Born in state of residence (%) - Hispanic or Latino
Place of birth - Born in state of residence (%) - American Indian and Alaska Native
Place of birth - Born in state of residence (%) - Multirace
Place of birth - Born in state of residence (%) - Other Race
Place of birth - Born in other state (%)
Place of birth - Born in other state (%) - White
Place of birth - Born in other state (%) - Black or African American
Place of birth - Born in other state (%) - Asian
Place of birth - Born in other state (%) - Hispanic or Latino
Place of birth - Born in other state (%) - American Indian and Alaska Native
Place of birth - Born in other state (%) - Multirace
Place of birth - Born in other state (%) - Other Race
Place of birth - Native, outside of US (%)
Place of birth - Native, outside of US (%) - White
Place of birth - Native, outside of US (%) - Black or African American
Place of birth - Native, outside of US (%) - Asian
Place of birth - Native, outside of US (%) - Hispanic or Latino
Place of birth - Native, outside of US (%) - American Indian and Alaska Native
Place of birth - Native, outside of US (%) - Multirace
Place of birth - Native, outside of US (%) - Other Race
Place of birth - Foreign born (%)
Place of birth - Foreign born (%) - White
Place of birth - Foreign born (%) - Black or African American
Place of birth - Foreign born (%) - Asian
Place of birth - Foreign born (%) - Hispanic or Latino
Place of birth - Foreign born (%) - American Indian and Alaska Native
Place of birth - Foreign born (%) - Multirace
Place of birth - Foreign born (%) - Other Race
Residents speaking English at home (%)
Residents speaking English at home - Born in the United States (%)
Residents speaking English at home - Native, born elsewhere (%)
Residents speaking English at home - Foreign born (%)
Residents speaking Spanish at home (%)
Residents speaking Spanish at home - Born in the United States (%)
Residents speaking Spanish at home - Native, born elsewhere (%)
Residents speaking Spanish at home - Foreign born (%)
Residents speaking other language at home (%)
Residents speaking other language at home - Born in the United States (%)
Residents speaking other language at home - Native, born elsewhere (%)
Residents speaking other language at home - Foreign born (%)
Marital status - Never married (%)
Marital status - Now married (%)
Marital status - Separated (%)
Marital status - Widowed (%)
Marital status - Divorced (%)
Ancestries Reported - Arab (%)
Ancestries Reported - Czech (%)
Ancestries Reported - Danish (%)
Ancestries Reported - Dutch (%)
Ancestries Reported - English (%)
Ancestries Reported - French (%)
Ancestries Reported - French Canadian (%)
Ancestries Reported - German (%)
Ancestries Reported - Greek (%)
Ancestries Reported - Hungarian (%)
Ancestries Reported - Irish (%)
Ancestries Reported - Italian (%)
Ancestries Reported - Lithuanian (%)
Ancestries Reported - Norwegian (%)
Ancestries Reported - Polish (%)
Ancestries Reported - Portuguese (%)
Ancestries Reported - Russian (%)
Ancestries Reported - Scotch-Irish (%)
Ancestries Reported - Scottish (%)
Ancestries Reported - Slovak (%)
Ancestries Reported - Subsaharan African (%)
Ancestries Reported - Swedish (%)
Ancestries Reported - Swiss (%)
Ancestries Reported - Ukrainian (%)
Ancestries Reported - United States (%)
Ancestries Reported - Welsh (%)
Ancestries Reported - West Indian (%)
Ancestries Reported - Other (%)
Geographical mobility - Same house 1 year ago (%)
Geographical mobility - Same house 1 year ago (%) - White
Geographical mobility - Same house 1 year ago (%) - Black or African American
Geographical mobility - Same house 1 year ago (%) - Asian
Geographical mobility - Same house 1 year ago (%) - Hispanic or Latino
Geographical mobility - Same house 1 year ago (%) - American Indian and Alaska Native
Geographical mobility - Same house 1 year ago (%) - Multirace
Geographical mobility - Same house 1 year ago (%) - Other Race
Geographical mobility - Moved within same county (%)
Geographical mobility - Moved within same county (%) - White
Geographical mobility - Moved within same county (%) - Black or African American
Geographical mobility - Moved within same county (%) - Asian
Geographical mobility - Moved within same county (%) - Hispanic or Latino
Geographical mobility - Moved within same county (%) - American Indian and Alaska Native
Geographical mobility - Moved within same county (%) - Multirace
Geographical mobility - Moved within same county (%) - Other Race
Geographical mobility - Moved from different county within same state (%)
Geographical mobility - Moved from different county within same state (%) - White
Geographical mobility - Moved from different county within same state (%) - Black or African American
Geographical mobility - Moved from different county within same state (%) - Asian
Geographical mobility - Moved from different county within same state (%) - Hispanic or Latino
Geographical mobility - Moved from different county within same state (%) - American Indian and Alaska Native
Geographical mobility - Moved from different county within same state (%) - Multirace
Geographical mobility - Moved from different county within same state (%) - Other Race
Geographical mobility - Moved from different state (%)
Geographical mobility - Moved from different state (%) - White
Geographical mobility - Moved from different state (%) - Black or African American
Geographical mobility - Moved from different state (%) - Asian
Geographical mobility - Moved from different state (%) - Hispanic or Latino
Geographical mobility - Moved from different state (%) - American Indian and Alaska Native
Geographical mobility - Moved from different state (%) - Multirace
Geographical mobility - Moved from different state (%) - Other Race
Geographical mobility - Moved from abroad (%)
Geographical mobility - Moved from abroad (%) - White
Geographical mobility - Moved from abroad (%) - Black or African American
Geographical mobility - Moved from abroad (%) - Asian
Geographical mobility - Moved from abroad (%) - Hispanic or Latino
Geographical mobility - Moved from abroad (%) - American Indian and Alaska Native
Geographical mobility - Moved from abroad (%) - Multirace
Geographical mobility - Moved from abroad (%) - Other Race
Place of birth for the foreign-born population - Ireland (%)
Place of birth for the foreign-born population - Denmark (%)
Place of birth for the foreign-born population - Norway (%)
Place of birth for the foreign-born population - Sweden (%)
Place of birth for the foreign-born population - United Kingdom (%)
Place of birth for the foreign-born population - England (%)
Place of birth for the foreign-born population - Scotland (%)
Place of birth for the foreign-born population - Other Northern Europe (%)
Place of birth for the foreign-born population - Austria (%)
Place of birth for the foreign-born population - Belgium (%)
Place of birth for the foreign-born population - France (%)
Place of birth for the foreign-born population - Germany (%)
Place of birth for the foreign-born population - Netherlands (%)
Place of birth for the foreign-born population - Switzerland (%)
Place of birth for the foreign-born population - Other Western Europe (%)
Place of birth for the foreign-born population - Greece (%)
Place of birth for the foreign-born population - Italy (%)
Place of birth for the foreign-born population - Portugal (%)
Place of birth for the foreign-born population - Spain (%)
Place of birth for the foreign-born population - Other Southern Europe (%)
Place of birth for the foreign-born population - Albania (%)
Place of birth for the foreign-born population - Belarus (%)
Place of birth for the foreign-born population - Bosnia and Herzegovina (%)
Place of birth for the foreign-born population - Bulgaria (%)
Place of birth for the foreign-born population - Croatia (%)
Place of birth for the foreign-born population - Czechoslovakia (%)
Place of birth for the foreign-born population - Hungary (%)
Place of birth for the foreign-born population - Latvia (%)
Place of birth for the foreign-born population - Lithuania (%)
Place of birth for the foreign-born population - North Macedonia (Macedonia) (%)
Place of birth for the foreign-born population - Moldova (%)
Place of birth for the foreign-born population - Poland (%)
Place of birth for the foreign-born population - Romania (%)
Place of birth for the foreign-born population - Russia (%)
Place of birth for the foreign-born population - Serbia (%)
Place of birth for the foreign-born population - Ukraine (%)
Place of birth for the foreign-born population - Other Eastern Europe (%)
Place of birth for the foreign-born population - China (%)
Place of birth for the foreign-born population - Hong Kong (%)
Place of birth for the foreign-born population - Taiwan (%)
Place of birth for the foreign-born population - Japan (%)
Place of birth for the foreign-born population - Korea (%)
Place of birth for the foreign-born population - Other Eastern Asia (%)
Place of birth for the foreign-born population - Afghanistan (%)
Place of birth for the foreign-born population - Bangladesh (%)
Place of birth for the foreign-born population - India (%)
Place of birth for the foreign-born population - Iran (%)
Place of birth for the foreign-born population - Kazakhstan (%)
Place of birth for the foreign-born population - Nepal (%)
Place of birth for the foreign-born population - Pakistan (%)
Place of birth for the foreign-born population - Sri Lanka (%)
Place of birth for the foreign-born population - Uzbekistan (%)
Place of birth for the foreign-born population - Other South Central Asia (%)
Place of birth for the foreign-born population - Burma (%)
Place of birth for the foreign-born population - Cambodia (%)
Place of birth for the foreign-born population - Indonesia (%)
Place of birth for the foreign-born population - Laos (%)
Place of birth for the foreign-born population - Malaysia (%)
Place of birth for the foreign-born population - Philippines (%)
Place of birth for the foreign-born population - Singapore (%)
Place of birth for the foreign-born population - Thailand (%)
Place of birth for the foreign-born population - Vietnam (%)
Place of birth for the foreign-born population - Other South Eastern Asia (%)
Place of birth for the foreign-born population - Armenia (%)
Place of birth for the foreign-born population - Iraq (%)
Place of birth for the foreign-born population - Israel (%)
Place of birth for the foreign-born population - Jordan (%)
Place of birth for the foreign-born population - Kuwait (%)
Place of birth for the foreign-born population - Lebanon (%)
Place of birth for the foreign-born population - Saudi Arabia (%)
Place of birth for the foreign-born population - Syria (%)
Place of birth for the foreign-born population - Turkey (%)
Place of birth for the foreign-born population - Yemen (%)
Place of birth for the foreign-born population - Other Western Asia (%)
Place of birth for the foreign-born population - Eritrea (%)
Place of birth for the foreign-born population - Ethiopia (%)
Place of birth for the foreign-born population - Kenya (%)
Place of birth for the foreign-born population - Somalia (%)
Place of birth for the foreign-born population - Uganda (%)
Place of birth for the foreign-born population - Zimbabwe (%)
Place of birth for the foreign-born population - Other Eastern Africa (%)
Place of birth for the foreign-born population - Cameroon (%)
Place of birth for the foreign-born population - Congo (%)
Place of birth for the foreign-born population - Democratic Republic of Congo (Zaire) (%)
Place of birth for the foreign-born population - Other Middle Africa (%)
Place of birth for the foreign-born population - Egypt (%)
Place of birth for the foreign-born population - Morocco (%)
Place of birth for the foreign-born population - Sudan (%)
Place of birth for the foreign-born population - Other Northern Africa (%)
Place of birth for the foreign-born population - South Africa (%)
Place of birth for the foreign-born population - Other Southern Africa (%)
Place of birth for the foreign-born population - Cabo Verde (%)
Place of birth for the foreign-born population - Ghana (%)
Place of birth for the foreign-born population - Liberia (%)
Place of birth for the foreign-born population - Nigeria (%)
Place of birth for the foreign-born population - Senegal (%)
Place of birth for the foreign-born population - Sierra Leone (%)
Place of birth for the foreign-born population - Other Western Africa (%)
Place of birth for the foreign-born population - Australia (%)
Place of birth for the foreign-born population - New Zealand (%)
Place of birth for the foreign-born population - Fiji (%)
Place of birth for the foreign-born population - Micronesia (%)
Place of birth for the foreign-born population - Bahamas (%)
Place of birth for the foreign-born population - Barbados (%)
Place of birth for the foreign-born population - Cuba (%)
Place of birth for the foreign-born population - Dominica (%)
Place of birth for the foreign-born population - Dominican Republic (%)
Place of birth for the foreign-born population - Grenada (%)
Place of birth for the foreign-born population - Haiti (%)
Place of birth for the foreign-born population - Jamaica (%)
Place of birth for the foreign-born population - St. Vincent and the Grenadines (%)
Place of birth for the foreign-born population - Trinidad and Tobago (%)
Place of birth for the foreign-born population - West Indies (%)
Place of birth for the foreign-born population - Other Caribbean (%)
Place of birth for the foreign-born population - Belize (%)
Place of birth for the foreign-born population - Costa Rica (%)
Place of birth for the foreign-born population - El Salvador (%)
Place of birth for the foreign-born population - Guatemala (%)
Place of birth for the foreign-born population - Honduras (%)
Place of birth for the foreign-born population - Mexico (%)
Place of birth for the foreign-born population - Nicaragua (%)
Place of birth for the foreign-born population - Panama (%)
Place of birth for the foreign-born population - Other Central America (%)
Place of birth for the foreign-born population - Argentina (%)
Place of birth for the foreign-born population - Bolivia (%)
Place of birth for the foreign-born population - Brazil (%)
Place of birth for the foreign-born population - Chile (%)
Place of birth for the foreign-born population - Colombia (%)
Place of birth for the foreign-born population - Ecuador (%)
Place of birth for the foreign-born population - Guyana (%)
Place of birth for the foreign-born population - Peru (%)
Place of birth for the foreign-born population - Uruguay (%)
Place of birth for the foreign-born population - Venezuela (%)
Place of birth for the foreign-born population - Other South America (%)
Place of birth for the foreign-born population - Canada (%)
Place of birth for the foreign-born population - Other Northern America (%)
Place of birth for the foreign-born population - Other (%)
Latest news about races in Chaparral, NM collected exclusively by city-data.com from local newspapers, TV, and radio stations
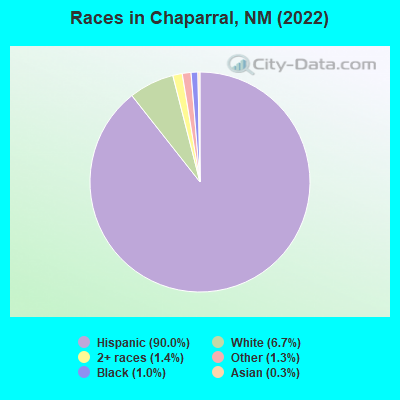
According to 2022 data, the most numerous races in Chaparral, NM are Hispanic (13,973 residents), White alone (1,045 residents), and American Indian alone (0 residents). 24.7% of Chaparral residents speak English at home. 30.9% of Chaparral, NM residents are foreign-born (30.0% born in Latin America), which is 70.9% greater than the foreign-born rate of 9.0% across the entire state of New Mexico.
Race distribution in Chaparral
2000 2022
813,495 44.7% White alone 765,386 42.1% Hispanic 161,460 8.9% American Indian alone 30,654 1.7% Black alone 25,793 1.4% Two or more races 18,257 1.0% Asian alone 3,009 0.2% Other race alone 992 0.05% Native Hawaiian and Other
1,059,867 50.2% Hispanic 735,478 34.8% White alone 171,808 8.1% American Indian alone 65,084 3.1% Two or more races 36,870 1.7% Black alone 35,870 1.7% Asian alone 7,582 0.4% Other race alone 785 0.04% Native Hawaiian and Other
Income and house value in Chaparral Median household income in 2022 $72,341 White non-Hispanic householders$109,311 Black householders$38,343 Some other race householders$42,606 Two or more races householders$40,395 Hispanic or Latino race householdersMedian 2022 house value $164,112 White Non-Hispanic householders$163,727 Black or African American householders$105,941 American Indian or Alaska Native householders$95,347 Some other race householders$92,650 Two or more races householders$110,564 Hispanic or Latino householders
Median age by race in Chaparral
34.2 Median age for White residents32.9 37.4 56.7 Median age for Black or African American residents58.9 6.4 -713,646,531.7 Median age for American Indian / Alaska Native residents-1,038,413,877.5 -612,560,385.9 -705,754,613.8 Median age for Asian residents-713,725,489.5 -695,364,237.7 -383,394,383.0 Median age for Native Hawaiian / Pacific Islander residents-685,897,435.2 -663,565,890.8 28.7 Median age for Other race residents25.6 29.5 33.7 Median age for Two or more races residents31.1 38.7 57.9 Median age for White alone residents56.2 57.7 29.5 Median age for Hispanic or Latino residents28.4 33.2
Owner/renter occupied households by race in Chaparral
House owners and renters - White residents 1,322 78.7% Owner occupied357 21.3% Renter occupiedHouse owners and renters - Black or African American residents 245 100.0% Owner occupiedHouse owners and renters - Asian residents 10 100.0% Owner occupiedHouse owners and renters - Other race residents 1,013 76.7% Owner occupied307 23.3% Renter occupiedHouse owners and renters - Two or more races residents 1,162 55.0% Owner occupied950 45.0% Renter occupiedHouse owners and renters - White alone residents 483 85.3% Owner occupied84 14.7% Renter occupiedHouse owners and renters - Hispanic or Latino residents 2,647 67.7% Owner occupied1,263 32.3% Renter occupied
Language usage in Chaparral
English speakers - Total 24.7% of residents of Chaparral speak English at home.
77.3% of residents speak Spanish at home 5,237 46.1% Speak English very well6,120 53.9% Speak English less than very well0.5% of residents speak other language at home 73 100.0% Speak English very well
English speakers - Born in the United States 33.0% of residents of Chaparral speak English at home.
67.7% of residents speak Spanish at home 2,693 53.7% Speak English very well2,319 46.3% Speak English less than very well0.1% of residents speak other language at home 11 100.0% Speak English very well
English speakers - Native, born elsewhere 27.4% of residents of Chaparral speak English at home.
67.2% of residents speak Spanish at home 125 77.2% Speak English very well37 22.8% Speak English less than very well
English speakers - Foreign-born 11.4% of residents of Chaparral speak English at home.
88.6% of residents speak Spanish at home 988 24.7% Speak English very well3,015 75.3% Speak English less than very well1.1% of residents speak other language at home 50 100.0% Speak English very well
White (Caucasian) - Speak only English Native:
33.8% (1,087)Foreign-born:
4.1% (35)
White (Caucasian) - Speak another language Native:
48.6% (1,561)Foreign-born:
100.0% (851)
Asian - Speak another language Native:
75.0% (21)Foreign-born:
100.0% (45)
Other race - Speak only English Native:
29.4% (1,050)Foreign-born:
11.3% (239)
Other race - Speak another language Native:
70.5% (2,524)Foreign-born:
84.0% (1,783)
Two or more races - Speak only English Native:
34.4% (1,481)Foreign-born:
24.5% (411)
Two or more races - Speak another language Native:
63.5% (2,738)Foreign-born:
82.0% (1,377)
White alone - Speak only English Native:
79.3% (737)Foreign-born:
66.1% (47)
White alone - Speak another language Native:
22.8% (212)Foreign-born:
42.6% (30)
Hispanic or Latino - Speak only English Native:
23.3% (2,017)Foreign-born:
8.7% (382)
Hispanic or Latino - Speak another language Native:
76.0% (6,577)Foreign-born:
91.1% (4,016)
Foreign-born residents in Chaparral 4,800 residents are foreign born (30.0% Latin America ).
This city:
30.9%New Mexico:
9.2%
Marital status for residents in Chaparral Marital status - White (Caucasian) population 15 years and over
Males 38.6% Never married57.8% Now married1.8% Separated0.7% Widowed1.1% DivorcedFemales 28.2% Never married55.7% Now married1.5% Separated8.8% Widowed5.8% DivorcedWomen who gave birth in the past 12 months Now married:
0.0% (0)Unmarried:
100.0% (35)
Women who did not give birth in the past 12 months Now married:
52.9% (595)Unmarried:
47.1% (529)
Marital status - Black or African American population 15 years and over
Males 0.0% Never married25.7% Now married0.0% Separated1.8% Widowed72.5% DivorcedFemales 0.0% Never married100.0% Now married0.0% Separated0.0% Widowed0.0% DivorcedMarital status - Other race population 15 years and over
Males 31.3% Never married60.3% Now married2.7% Separated4.8% Widowed1.0% DivorcedFemales 38.4% Never married39.7% Now married4.4% Separated14.2% Widowed3.3% DivorcedWomen who gave birth in the past 12 months Now married:
100.0% (45)Unmarried:
0.0% (0)
Women who did not give birth in the past 12 months Now married:
32.2% (499)Unmarried:
67.8% (1,051)
Marital status - Two or more races population 15 years and over
Males 48.8% Never married37.1% Now married1.4% Separated6.0% Widowed6.6% DivorcedFemales 32.3% Never married50.3% Now married0.6% Separated14.4% Widowed2.3% DivorcedWomen who gave birth in the past 12 months Now married:
36.6% (36)Unmarried:
63.4% (62)
Women who did not give birth in the past 12 months Now married:
35.4% (348)Unmarried:
64.6% (634)
Marital status - White alone, not Hispanic / Latino population 15 years and over
Males 4.7% Never married89.9% Now married0.0% Separated3.7% Widowed1.7% DivorcedFemales 17.4% Never married61.0% Now married0.0% Separated10.5% Widowed11.1% DivorcedWomen who did not give birth in the past 12 months Now married:
40.3% (71)Unmarried:
59.7% (105)
Marital status - Hispanic or Latino population 15 years and over
Males 45.5% Never married49.0% Now married1.6% Separated0.9% Widowed3.0% DivorcedFemales 33.0% Never married48.9% Now married2.3% Separated12.1% Widowed3.6% DivorcedWomen who gave birth in the past 12 months Now married:
35.6% (55)Unmarried:
64.4% (99)
Women who did not give birth in the past 12 months Now married:
44.3% (1,407)Unmarried:
55.7% (1,772)
Ancestries in Chaparral
150 1.4% German148 1.4% American104 1.0% French92 0.9% Irish59 0.6% English15 0.1% Italian10 0.09% European
Children Nativity (place of birth) in Chaparral
Children under 6 years - Living with two parents Both parents native 138 100.0% NativeBoth parents foreign-born 97 100.0% NativeOne native, one foreign-born parent 160 100.0% NativeChildren under 6 years - Living with one parent Native parent 390 100.0% NativeForeign-born parent 421 100.0% NativeChildren 6 to 17 years - Living with two parents Both parents native 149 100.0% NativeBoth parents foreign-born 672 91.0% Native66 9.0% Foreign-bornOne native, one foreign-born parent 297 100.0% NativeChildren 6 to 17 years - Living with one parent Native parent 1,125 100.0% NativeForeign-born parent 364 50.4% Native359 49.6% Foreign-born
Grandparents responsible for own grandchildren in Chaparral
Grandparents (30 to 59 years) White / Caucasian 16 8.0% Responsible for grandchildren185 92.0% Not responsible for grandchildrenOther race 23 18.7% Responsible for grandchildren100 81.3% Not responsible for grandchildrenTwo or more races 78 85.4% Responsible for grandchildren13 14.6% Not responsible for grandchildrenWhite alone, not Hispanic / Latino 10 21.6% Responsible for grandchildren35 78.4% Not responsible for grandchildrenHispanic or Latino 113 23.2% Responsible for grandchildren377 76.8% Not responsible for grandchildrenGrandparents (60 years and over) White / Caucasian 7 36.6% Responsible for grandchildren13 63.4% Not responsible for grandchildrenOther race 56 100.0% Responsible for grandchildrenTwo or more races 150 42.8% Responsible for grandchildren200 57.2% Not responsible for grandchildrenWhite alone, not Hispanic / Latino 20 100.0% Not responsible for grandchildrenHispanic or Latino 133 75.9% Responsible for grandchildren42 24.1% Not responsible for grandchildren