Races in Celebration, Florida (FL) Detailed Stats
Data:
Races - White alone (%)
Races - White alone (% change since 2000)
Races - Black alone (%)
Races - Black alone (% change since 2000)
Races - American Indian alone (%)
Races - American Indian alone (% change since 2000)
Races - Asian alone (%)
Races - Asian alone (% change since 2000)
Races - Hispanic (%)
Races - Hispanic (% change since 2000)
Races - Native Hawaiian and Other Pacific Islander alone (%)
Races - Native Hawaiian and Other Pacific Islander alone (% change since 2000)
Races - Two or more races(%)
Races - Two or more races(% change since 2000)
Races - Other race alone (%)
Races - Other race alone (% change since 2000)
Racial diversity
Place of birth - Born in state of residence (%)
Place of birth - Born in state of residence (%) - White
Place of birth - Born in state of residence (%) - Black or African American
Place of birth - Born in state of residence (%) - Asian
Place of birth - Born in state of residence (%) - Hispanic or Latino
Place of birth - Born in state of residence (%) - American Indian and Alaska Native
Place of birth - Born in state of residence (%) - Multirace
Place of birth - Born in state of residence (%) - Other Race
Place of birth - Born in other state (%)
Place of birth - Born in other state (%) - White
Place of birth - Born in other state (%) - Black or African American
Place of birth - Born in other state (%) - Asian
Place of birth - Born in other state (%) - Hispanic or Latino
Place of birth - Born in other state (%) - American Indian and Alaska Native
Place of birth - Born in other state (%) - Multirace
Place of birth - Born in other state (%) - Other Race
Place of birth - Native, outside of US (%)
Place of birth - Native, outside of US (%) - White
Place of birth - Native, outside of US (%) - Black or African American
Place of birth - Native, outside of US (%) - Asian
Place of birth - Native, outside of US (%) - Hispanic or Latino
Place of birth - Native, outside of US (%) - American Indian and Alaska Native
Place of birth - Native, outside of US (%) - Multirace
Place of birth - Native, outside of US (%) - Other Race
Place of birth - Foreign born (%)
Place of birth - Foreign born (%) - White
Place of birth - Foreign born (%) - Black or African American
Place of birth - Foreign born (%) - Asian
Place of birth - Foreign born (%) - Hispanic or Latino
Place of birth - Foreign born (%) - American Indian and Alaska Native
Place of birth - Foreign born (%) - Multirace
Place of birth - Foreign born (%) - Other Race
Residents speaking English at home (%)
Residents speaking English at home - Born in the United States (%)
Residents speaking English at home - Native, born elsewhere (%)
Residents speaking English at home - Foreign born (%)
Residents speaking Spanish at home (%)
Residents speaking Spanish at home - Born in the United States (%)
Residents speaking Spanish at home - Native, born elsewhere (%)
Residents speaking Spanish at home - Foreign born (%)
Residents speaking other language at home (%)
Residents speaking other language at home - Born in the United States (%)
Residents speaking other language at home - Native, born elsewhere (%)
Residents speaking other language at home - Foreign born (%)
Marital status - Never married (%)
Marital status - Now married (%)
Marital status - Separated (%)
Marital status - Widowed (%)
Marital status - Divorced (%)
Ancestries Reported - Arab (%)
Ancestries Reported - Czech (%)
Ancestries Reported - Danish (%)
Ancestries Reported - Dutch (%)
Ancestries Reported - English (%)
Ancestries Reported - French (%)
Ancestries Reported - French Canadian (%)
Ancestries Reported - German (%)
Ancestries Reported - Greek (%)
Ancestries Reported - Hungarian (%)
Ancestries Reported - Irish (%)
Ancestries Reported - Italian (%)
Ancestries Reported - Lithuanian (%)
Ancestries Reported - Norwegian (%)
Ancestries Reported - Polish (%)
Ancestries Reported - Portuguese (%)
Ancestries Reported - Russian (%)
Ancestries Reported - Scotch-Irish (%)
Ancestries Reported - Scottish (%)
Ancestries Reported - Slovak (%)
Ancestries Reported - Subsaharan African (%)
Ancestries Reported - Swedish (%)
Ancestries Reported - Swiss (%)
Ancestries Reported - Ukrainian (%)
Ancestries Reported - United States (%)
Ancestries Reported - Welsh (%)
Ancestries Reported - West Indian (%)
Ancestries Reported - Other (%)
Geographical mobility - Same house 1 year ago (%)
Geographical mobility - Same house 1 year ago (%) - White
Geographical mobility - Same house 1 year ago (%) - Black or African American
Geographical mobility - Same house 1 year ago (%) - Asian
Geographical mobility - Same house 1 year ago (%) - Hispanic or Latino
Geographical mobility - Same house 1 year ago (%) - American Indian and Alaska Native
Geographical mobility - Same house 1 year ago (%) - Multirace
Geographical mobility - Same house 1 year ago (%) - Other Race
Geographical mobility - Moved within same county (%)
Geographical mobility - Moved within same county (%) - White
Geographical mobility - Moved within same county (%) - Black or African American
Geographical mobility - Moved within same county (%) - Asian
Geographical mobility - Moved within same county (%) - Hispanic or Latino
Geographical mobility - Moved within same county (%) - American Indian and Alaska Native
Geographical mobility - Moved within same county (%) - Multirace
Geographical mobility - Moved within same county (%) - Other Race
Geographical mobility - Moved from different county within same state (%)
Geographical mobility - Moved from different county within same state (%) - White
Geographical mobility - Moved from different county within same state (%) - Black or African American
Geographical mobility - Moved from different county within same state (%) - Asian
Geographical mobility - Moved from different county within same state (%) - Hispanic or Latino
Geographical mobility - Moved from different county within same state (%) - American Indian and Alaska Native
Geographical mobility - Moved from different county within same state (%) - Multirace
Geographical mobility - Moved from different county within same state (%) - Other Race
Geographical mobility - Moved from different state (%)
Geographical mobility - Moved from different state (%) - White
Geographical mobility - Moved from different state (%) - Black or African American
Geographical mobility - Moved from different state (%) - Asian
Geographical mobility - Moved from different state (%) - Hispanic or Latino
Geographical mobility - Moved from different state (%) - American Indian and Alaska Native
Geographical mobility - Moved from different state (%) - Multirace
Geographical mobility - Moved from different state (%) - Other Race
Geographical mobility - Moved from abroad (%)
Geographical mobility - Moved from abroad (%) - White
Geographical mobility - Moved from abroad (%) - Black or African American
Geographical mobility - Moved from abroad (%) - Asian
Geographical mobility - Moved from abroad (%) - Hispanic or Latino
Geographical mobility - Moved from abroad (%) - American Indian and Alaska Native
Geographical mobility - Moved from abroad (%) - Multirace
Geographical mobility - Moved from abroad (%) - Other Race
Place of birth for the foreign-born population - Ireland (%)
Place of birth for the foreign-born population - Denmark (%)
Place of birth for the foreign-born population - Norway (%)
Place of birth for the foreign-born population - Sweden (%)
Place of birth for the foreign-born population - United Kingdom (%)
Place of birth for the foreign-born population - England (%)
Place of birth for the foreign-born population - Scotland (%)
Place of birth for the foreign-born population - Other Northern Europe (%)
Place of birth for the foreign-born population - Austria (%)
Place of birth for the foreign-born population - Belgium (%)
Place of birth for the foreign-born population - France (%)
Place of birth for the foreign-born population - Germany (%)
Place of birth for the foreign-born population - Netherlands (%)
Place of birth for the foreign-born population - Switzerland (%)
Place of birth for the foreign-born population - Other Western Europe (%)
Place of birth for the foreign-born population - Greece (%)
Place of birth for the foreign-born population - Italy (%)
Place of birth for the foreign-born population - Portugal (%)
Place of birth for the foreign-born population - Spain (%)
Place of birth for the foreign-born population - Other Southern Europe (%)
Place of birth for the foreign-born population - Albania (%)
Place of birth for the foreign-born population - Belarus (%)
Place of birth for the foreign-born population - Bosnia and Herzegovina (%)
Place of birth for the foreign-born population - Bulgaria (%)
Place of birth for the foreign-born population - Croatia (%)
Place of birth for the foreign-born population - Czechoslovakia (%)
Place of birth for the foreign-born population - Hungary (%)
Place of birth for the foreign-born population - Latvia (%)
Place of birth for the foreign-born population - Lithuania (%)
Place of birth for the foreign-born population - North Macedonia (Macedonia) (%)
Place of birth for the foreign-born population - Moldova (%)
Place of birth for the foreign-born population - Poland (%)
Place of birth for the foreign-born population - Romania (%)
Place of birth for the foreign-born population - Russia (%)
Place of birth for the foreign-born population - Serbia (%)
Place of birth for the foreign-born population - Ukraine (%)
Place of birth for the foreign-born population - Other Eastern Europe (%)
Place of birth for the foreign-born population - China (%)
Place of birth for the foreign-born population - Hong Kong (%)
Place of birth for the foreign-born population - Taiwan (%)
Place of birth for the foreign-born population - Japan (%)
Place of birth for the foreign-born population - Korea (%)
Place of birth for the foreign-born population - Other Eastern Asia (%)
Place of birth for the foreign-born population - Afghanistan (%)
Place of birth for the foreign-born population - Bangladesh (%)
Place of birth for the foreign-born population - India (%)
Place of birth for the foreign-born population - Iran (%)
Place of birth for the foreign-born population - Kazakhstan (%)
Place of birth for the foreign-born population - Nepal (%)
Place of birth for the foreign-born population - Pakistan (%)
Place of birth for the foreign-born population - Sri Lanka (%)
Place of birth for the foreign-born population - Uzbekistan (%)
Place of birth for the foreign-born population - Other South Central Asia (%)
Place of birth for the foreign-born population - Burma (%)
Place of birth for the foreign-born population - Cambodia (%)
Place of birth for the foreign-born population - Indonesia (%)
Place of birth for the foreign-born population - Laos (%)
Place of birth for the foreign-born population - Malaysia (%)
Place of birth for the foreign-born population - Philippines (%)
Place of birth for the foreign-born population - Singapore (%)
Place of birth for the foreign-born population - Thailand (%)
Place of birth for the foreign-born population - Vietnam (%)
Place of birth for the foreign-born population - Other South Eastern Asia (%)
Place of birth for the foreign-born population - Armenia (%)
Place of birth for the foreign-born population - Iraq (%)
Place of birth for the foreign-born population - Israel (%)
Place of birth for the foreign-born population - Jordan (%)
Place of birth for the foreign-born population - Kuwait (%)
Place of birth for the foreign-born population - Lebanon (%)
Place of birth for the foreign-born population - Saudi Arabia (%)
Place of birth for the foreign-born population - Syria (%)
Place of birth for the foreign-born population - Turkey (%)
Place of birth for the foreign-born population - Yemen (%)
Place of birth for the foreign-born population - Other Western Asia (%)
Place of birth for the foreign-born population - Eritrea (%)
Place of birth for the foreign-born population - Ethiopia (%)
Place of birth for the foreign-born population - Kenya (%)
Place of birth for the foreign-born population - Somalia (%)
Place of birth for the foreign-born population - Uganda (%)
Place of birth for the foreign-born population - Zimbabwe (%)
Place of birth for the foreign-born population - Other Eastern Africa (%)
Place of birth for the foreign-born population - Cameroon (%)
Place of birth for the foreign-born population - Congo (%)
Place of birth for the foreign-born population - Democratic Republic of Congo (Zaire) (%)
Place of birth for the foreign-born population - Other Middle Africa (%)
Place of birth for the foreign-born population - Egypt (%)
Place of birth for the foreign-born population - Morocco (%)
Place of birth for the foreign-born population - Sudan (%)
Place of birth for the foreign-born population - Other Northern Africa (%)
Place of birth for the foreign-born population - South Africa (%)
Place of birth for the foreign-born population - Other Southern Africa (%)
Place of birth for the foreign-born population - Cabo Verde (%)
Place of birth for the foreign-born population - Ghana (%)
Place of birth for the foreign-born population - Liberia (%)
Place of birth for the foreign-born population - Nigeria (%)
Place of birth for the foreign-born population - Senegal (%)
Place of birth for the foreign-born population - Sierra Leone (%)
Place of birth for the foreign-born population - Other Western Africa (%)
Place of birth for the foreign-born population - Australia (%)
Place of birth for the foreign-born population - New Zealand (%)
Place of birth for the foreign-born population - Fiji (%)
Place of birth for the foreign-born population - Micronesia (%)
Place of birth for the foreign-born population - Bahamas (%)
Place of birth for the foreign-born population - Barbados (%)
Place of birth for the foreign-born population - Cuba (%)
Place of birth for the foreign-born population - Dominica (%)
Place of birth for the foreign-born population - Dominican Republic (%)
Place of birth for the foreign-born population - Grenada (%)
Place of birth for the foreign-born population - Haiti (%)
Place of birth for the foreign-born population - Jamaica (%)
Place of birth for the foreign-born population - St. Vincent and the Grenadines (%)
Place of birth for the foreign-born population - Trinidad and Tobago (%)
Place of birth for the foreign-born population - West Indies (%)
Place of birth for the foreign-born population - Other Caribbean (%)
Place of birth for the foreign-born population - Belize (%)
Place of birth for the foreign-born population - Costa Rica (%)
Place of birth for the foreign-born population - El Salvador (%)
Place of birth for the foreign-born population - Guatemala (%)
Place of birth for the foreign-born population - Honduras (%)
Place of birth for the foreign-born population - Mexico (%)
Place of birth for the foreign-born population - Nicaragua (%)
Place of birth for the foreign-born population - Panama (%)
Place of birth for the foreign-born population - Other Central America (%)
Place of birth for the foreign-born population - Argentina (%)
Place of birth for the foreign-born population - Bolivia (%)
Place of birth for the foreign-born population - Brazil (%)
Place of birth for the foreign-born population - Chile (%)
Place of birth for the foreign-born population - Colombia (%)
Place of birth for the foreign-born population - Ecuador (%)
Place of birth for the foreign-born population - Guyana (%)
Place of birth for the foreign-born population - Peru (%)
Place of birth for the foreign-born population - Uruguay (%)
Place of birth for the foreign-born population - Venezuela (%)
Place of birth for the foreign-born population - Other South America (%)
Place of birth for the foreign-born population - Canada (%)
Place of birth for the foreign-born population - Other Northern America (%)
Place of birth for the foreign-born population - Other (%)
Polo, Volleyball, Sailor Circus/Candyland & lots of New Year's Eve Celebrations this weekend! (1 reply)Offshore Grand Prix Races, Summer Fest, Kayak Festival, Parades, Picnics & lots of Fireworks, all this weekend! (1 reply)Celebration Island Village. A Good place for families? (2 replies)100-plus fun things to do in October in Sarasota, Manatee and Charlotte counties (85 replies)Venice Holiday Parade, Light up Siesta Key, Cuban Music Celebration & more, all this weekend! (0 replies)Boat Show, Paddleboard Races, Reggae Celebration & more this weekend! (0 replies)
Latest news about races in Celebration, FL collected exclusively by city-data.com from local newspapers, TV, and radio stations
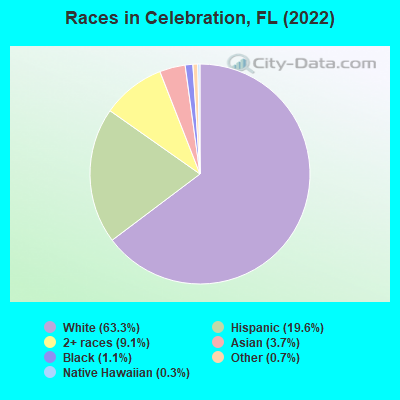
According to 2022 data, the most numerous races in Celebration, FL are White alone (8,167 residents), Hispanic (2,535 residents), and Black alone (139 residents). 74.0% of Celebration residents speak English at home. 17.4% of Celebration, FL residents are foreign-born (9.8% born in Latin America, 5.0% born in Europe), which is 20.5% less than the foreign-born rate of 21.0% across the entire state of Florida.
Race distribution in Celebration
2000 2022
10,458,509 65.4% White alone 2,682,715 16.8% Hispanic 2,264,268 14.2% Black alone 261,693 1.6% Asian alone 236,954 1.5% Two or more races 42,358 0.3% American Indian alone 28,994 0.2% Other race alone 6,887 0.04% Native Hawaiian and Other
11,309,403 50.8% White alone 6,025,039 27.1% Hispanic 3,241,015 14.6% Black alone 861,630 3.9% Two or more races 623,692 2.8% Asian alone 152,054 0.7% Other race alone 22,504 0.1% American Indian alone 9,486 0.04% Native Hawaiian and Other
Income and house value in Celebration Median household income in 2022 $99,680 White non-Hispanic householders$182,200 Asian householders$100,208 Some other race householders$116,541 Two or more races householders$97,042 Hispanic or Latino race householdersMedian 2022 house value $702,120 White Non-Hispanic householders $722,118 Asian householders$833,213 Two or more races householders$648,054 Hispanic or Latino householders
Median age by race in Celebration
43.6 Median age for White residents45.0 41.7 62.0 Median age for Black or African American residents-611,111,110.5 -679,245,282.3 -598,566,307.6 Median age for American Indian / Alaska Native residents-611,418,047.3 -594,925,633.7 35.3 Median age for Asian residents31.6 39.4 -666,666,666.0 Median age for Native Hawaiian / Pacific Islander residents-858,307,848.3 -666,666,666.0 41.5 Median age for Other race residents32.4 47.9 11.2 Median age for Two or more races residents14.1 8.5 45.5 Median age for White alone residents46.2 42.7 28.0 Median age for Hispanic or Latino residents35.7 16.2
Owner/renter occupied households by race in Celebration
House owners and renters - White residents 1,931 62.0% Owner occupied1,186 38.0% Renter occupiedHouse owners and renters - Black or African American residents 52 100.0% Owner occupiedHouse owners and renters - Asian residents 164 83.9% Owner occupied31 16.1% Renter occupiedHouse owners and renters - Other race residents 224 70.5% Owner occupied94 29.5% Renter occupiedHouse owners and renters - Two or more races residents 151 17.3% Owner occupied721 82.7% Renter occupiedHouse owners and renters - White alone residents 2,273 59.2% Owner occupied1,563 40.8% Renter occupiedHouse owners and renters - Hispanic or Latino residents 257 26.0% Owner occupied731 74.0% Renter occupied
Language usage in Celebration
English speakers - Total 74.0% of residents of Celebration speak English at home.
12.5% of residents speak Spanish at home 759 49.9% Speak English very well763 50.1% Speak English less than very well13.1% of residents speak other language at home 1,269 79.9% Speak English very well319 20.1% Speak English less than very well
English speakers - Born in the United States 87.9% of residents of Celebration speak English at home.
3.4% of residents speak Spanish at home 204 91.1% Speak English very well20 8.9% Speak English less than very well5.3% of residents speak other language at home 293 83.7% Speak English very well57 16.3% Speak English less than very well
English speakers - Native, born elsewhere 39.6% of residents of Celebration speak English at home.
46.4% of residents speak Spanish at home 212 64.8% Speak English very well115 35.2% Speak English less than very well13.1% of residents speak other language at home 71 77.2% Speak English very well21 22.8% Speak English less than very well
English speakers - Foreign-born 23.5% of residents of Celebration speak English at home.
35.1% of residents speak Spanish at home 209 24.3% Speak English very well650 75.7% Speak English less than very well36.0% of residents speak other language at home 652 73.9% Speak English very well230 26.1% Speak English less than very well
White (Caucasian) - Speak only English Native:
100.0% (5,649)Foreign-born:
51.6% (356)
White (Caucasian) - Speak another language Native:
5.4% (304)Foreign-born:
59.1% (408)
Asian - Speak only English Native:
100.0% (132)Foreign-born:
54.2% (170)
Other race - Speak another language Native:
93.8% (220)Foreign-born:
97.8% (417)
Two or more races - Speak another language Native:
35.4% (711)Foreign-born:
100.0% (447)
White alone - Speak only English Native:
94.2% (6,770)Foreign-born:
56.4% (359)
White alone - Speak another language Native:
5.8% (419)Foreign-born:
43.1% (274)
Hispanic or Latino - Speak another language Native:
54.3% (759)Foreign-born:
98.8% (946)
Foreign-born residents in Celebration 2,250 residents are foreign born (9.8% Latin America , 5.0% Europe ).
This city:
17.4%Florida:
21.1%
Marital status for residents in Celebration Marital status - White (Caucasian) population 15 years and over
Males 24.7% Never married66.7% Now married0.4% Separated1.6% Widowed6.6% DivorcedFemales 29.5% Never married50.3% Now married0.3% Separated7.5% Widowed12.4% DivorcedWomen who gave birth in the past 12 months Now married:
100.0% (45)Unmarried:
0.0% (0)
Women who did not give birth in the past 12 months Now married:
29.6% (370)Unmarried:
70.4% (880)
Marital status - Black or African American population 15 years and over
Males 0.0% Never married54.5% Now married0.0% Separated0.0% Widowed45.5% DivorcedFemales 0.0% Never married100.0% Now married0.0% Separated0.0% Widowed0.0% DivorcedMarital status - Asian population 15 years and over
Males 38.8% Never married61.2% Now married0.0% Separated0.0% Widowed0.0% DivorcedFemales 20.4% Never married59.3% Now married0.0% Separated9.9% Widowed10.5% DivorcedWomen who did not give birth in the past 12 months Now married:
49.5% (54)Unmarried:
50.5% (55)
Marital status - Other race population 15 years and over
Males 48.8% Never married35.0% Now married0.0% Separated0.0% Widowed16.1% DivorcedFemales 63.3% Never married18.4% Now married0.0% Separated0.0% Widowed18.4% DivorcedWomen who did not give birth in the past 12 months Now married:
40.3% (49)Unmarried:
59.7% (72)
Marital status - Two or more races population 15 years and over
Males 39.9% Never married46.4% Now married0.0% Separated0.0% Widowed13.8% DivorcedFemales 14.1% Never married64.6% Now married0.0% Separated10.5% Widowed10.8% DivorcedWomen who did not give birth in the past 12 months Now married:
72.1% (297)Unmarried:
27.9% (115)
Marital status - White alone, not Hispanic / Latino population 15 years and over
Males 21.7% Never married68.8% Now married0.4% Separated1.8% Widowed7.3% DivorcedFemales 29.7% Never married50.9% Now married0.3% Separated8.1% Widowed10.9% DivorcedWomen who gave birth in the past 12 months Now married:
100.0% (65)Unmarried:
0.0% (0)
Women who did not give birth in the past 12 months Now married:
27.9% (459)Unmarried:
72.1% (1,186)
Marital status - Hispanic or Latino population 15 years and over
Males 52.4% Never married36.0% Now married0.0% Separated0.0% Widowed11.6% DivorcedFemales 31.0% Never married44.3% Now married0.0% Separated2.7% Widowed22.0% DivorcedWomen who did not give birth in the past 12 months Now married:
54.3% (216)Unmarried:
45.7% (182)
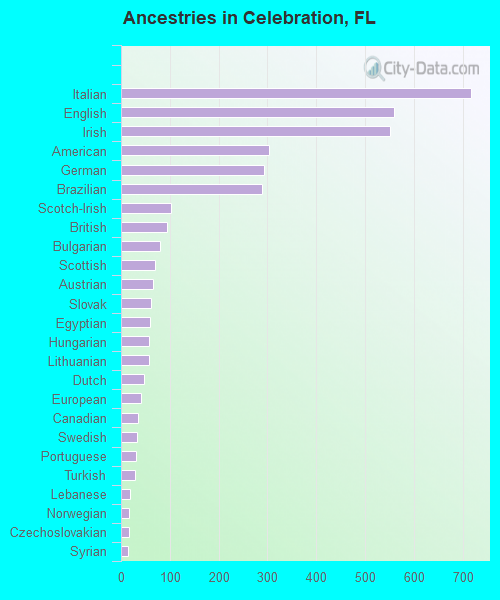
Ancestries in Celebration
718 12.5% Italian559 9.7% English552 9.6% Irish304 5.3% American292 5.1% German289 5.0% Brazilian102 1.8% Scotch-Irish94 1.6% British79 1.4% Bulgarian69 1.2% Scottish65 1.1% Austrian62 1.1% Slovak59 1.0% Egyptian57 1.0% Hungarian57 1.0% Lithuanian47 0.8% Dutch40 0.7% European34 0.6% Canadian33 0.6% Swedish31 0.5% Portuguese28 0.5% Turkish18 0.3% Lebanese17 0.3% Norwegian16 0.3% Czechoslovakian15 0.3% Syrian11 0.2% French10 0.2% Pennsylvania German10 0.2% Russian8 0.1% French Canadian8 0.1% Polish8 0.1% Yugoslavian7 0.1% Greek
Children Nativity (place of birth) in Celebration
Children under 6 years - Living with two parents Both parents native 257 100.0% NativeBoth parents foreign-born 283 100.0% NativeOne native, one foreign-born parent 45 47.6% Native49 52.4% Foreign-bornChildren under 6 years - Living with one parent Native parent 22 100.0% NativeForeign-born parent 53 100.0% NativeChildren 6 to 17 years - Living with two parents Both parents native 622 100.0% NativeBoth parents foreign-born 611 62.6% Native364 37.4% Foreign-bornOne native, one foreign-born parent 45 31.7% Native96 68.3% Foreign-bornChildren 6 to 17 years - Living with one parent Native parent 650 100.0% NativeForeign-born parent 222 47.1% Native249 52.9% Foreign-born