Races in Cedars, Tennessee (TN) Detailed Stats
Ancestries, Foreign-born residents, place of birth
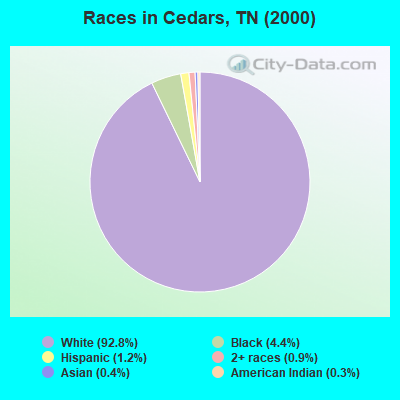
Race distribution in Cedars

- 12,05292.8%White alone
- 5684.4%Black alone
- 1591.2%Hispanic
- 1220.9%Two or more races
- 470.4%Asian alone
- 390.3%American Indian alone
- 40.03%Other race alone
- 20.02%Native Hawaiian and Other
Pacific Islander alone
2000
2022
-
- 4,505,93079.2%White alone
- 928,20416.3%Black alone
- 123,8382.2%Hispanic
- 54,8241.0%Two or more races
- 56,0771.0%Asian alone
- 13,8200.2%American Indian alone
- 4,7800.08%Other race alone
- 1,8100.03%Native Hawaiian and Other
Pacific Islander alone

-
- 5,070,02671.9%White alone
- 1,089,73815.5%Black alone
- 442,6296.3%Hispanic
- 279,3814.0%Two or more races
- 131,8171.9%Asian alone
- 26,9720.4%Other race alone
- 6,3870.09%American Indian alone
- 4,3890.06%Native Hawaiian and Other
Pacific Islander alone

Income and house value in Cedars
- Median household income in 2022
- $93,668White non-Hispanic householders
- $132,735Black householders
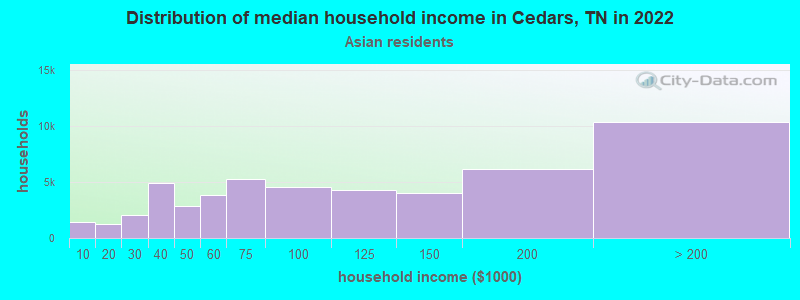
- $101,050Asian householders
- $120,133Some other race householders
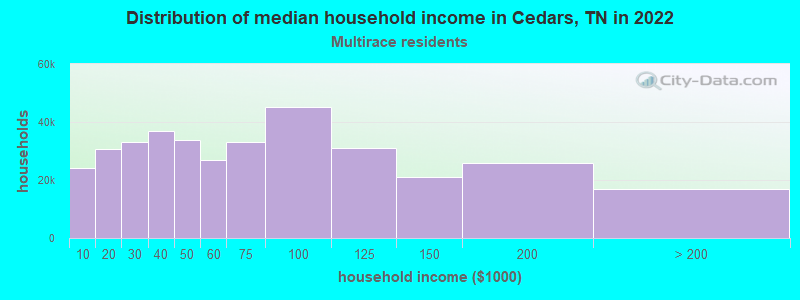
- over $200,000Two or more races householders
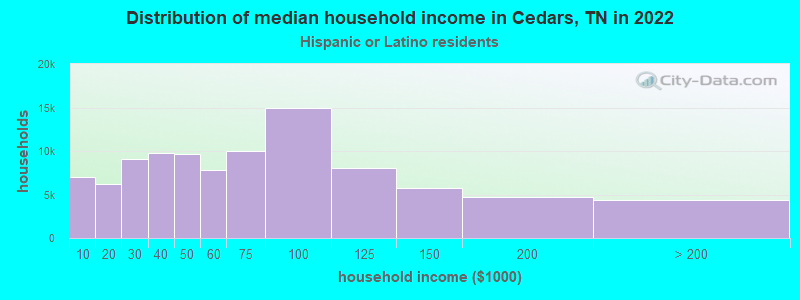
- $107,092Hispanic or Latino race householders
- Median 2022 house value
- $448,951White Non-Hispanic householders
- $318,896Black or African American householders
- $334,332Asian householders
- $369,473Some other race householders
- $451,578Two or more races householders
- $502,812Hispanic or Latino householders
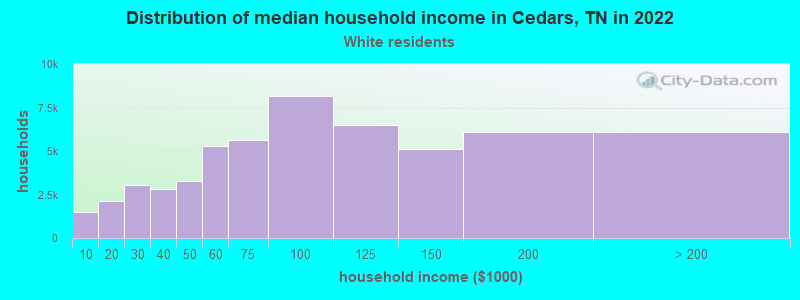
Household income for White non-Hispanic householders
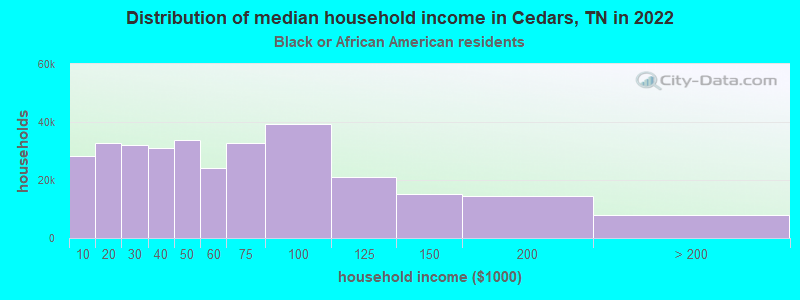
Household income for Black householders
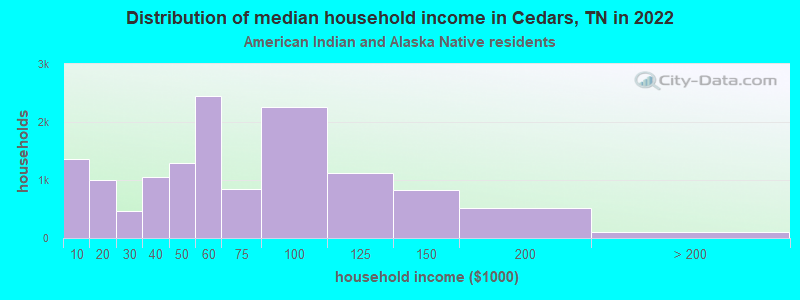
Household income for American Indian and Alaska Native householders
Household income for Asian householders
Household income for Two or more races householders
Household income for Hispanic or Latino race householders
Zip code: 37090