Races in Cayce, South Carolina (SC) Detailed Stats
Data:
Races - White alone (%)
Races - White alone (% change since 2000)
Races - Black alone (%)
Races - Black alone (% change since 2000)
Races - American Indian alone (%)
Races - American Indian alone (% change since 2000)
Races - Asian alone (%)
Races - Asian alone (% change since 2000)
Races - Hispanic (%)
Races - Hispanic (% change since 2000)
Races - Native Hawaiian and Other Pacific Islander alone (%)
Races - Native Hawaiian and Other Pacific Islander alone (% change since 2000)
Races - Two or more races(%)
Races - Two or more races(% change since 2000)
Races - Other race alone (%)
Races - Other race alone (% change since 2000)
Racial diversity
Place of birth - Born in state of residence (%)
Place of birth - Born in state of residence (%) - White
Place of birth - Born in state of residence (%) - Black or African American
Place of birth - Born in state of residence (%) - Asian
Place of birth - Born in state of residence (%) - Hispanic or Latino
Place of birth - Born in state of residence (%) - American Indian and Alaska Native
Place of birth - Born in state of residence (%) - Multirace
Place of birth - Born in state of residence (%) - Other Race
Place of birth - Born in other state (%)
Place of birth - Born in other state (%) - White
Place of birth - Born in other state (%) - Black or African American
Place of birth - Born in other state (%) - Asian
Place of birth - Born in other state (%) - Hispanic or Latino
Place of birth - Born in other state (%) - American Indian and Alaska Native
Place of birth - Born in other state (%) - Multirace
Place of birth - Born in other state (%) - Other Race
Place of birth - Native, outside of US (%)
Place of birth - Native, outside of US (%) - White
Place of birth - Native, outside of US (%) - Black or African American
Place of birth - Native, outside of US (%) - Asian
Place of birth - Native, outside of US (%) - Hispanic or Latino
Place of birth - Native, outside of US (%) - American Indian and Alaska Native
Place of birth - Native, outside of US (%) - Multirace
Place of birth - Native, outside of US (%) - Other Race
Place of birth - Foreign born (%)
Place of birth - Foreign born (%) - White
Place of birth - Foreign born (%) - Black or African American
Place of birth - Foreign born (%) - Asian
Place of birth - Foreign born (%) - Hispanic or Latino
Place of birth - Foreign born (%) - American Indian and Alaska Native
Place of birth - Foreign born (%) - Multirace
Place of birth - Foreign born (%) - Other Race
Residents speaking English at home (%)
Residents speaking English at home - Born in the United States (%)
Residents speaking English at home - Native, born elsewhere (%)
Residents speaking English at home - Foreign born (%)
Residents speaking Spanish at home (%)
Residents speaking Spanish at home - Born in the United States (%)
Residents speaking Spanish at home - Native, born elsewhere (%)
Residents speaking Spanish at home - Foreign born (%)
Residents speaking other language at home (%)
Residents speaking other language at home - Born in the United States (%)
Residents speaking other language at home - Native, born elsewhere (%)
Residents speaking other language at home - Foreign born (%)
Marital status - Never married (%)
Marital status - Now married (%)
Marital status - Separated (%)
Marital status - Widowed (%)
Marital status - Divorced (%)
Ancestries Reported - Arab (%)
Ancestries Reported - Czech (%)
Ancestries Reported - Danish (%)
Ancestries Reported - Dutch (%)
Ancestries Reported - English (%)
Ancestries Reported - French (%)
Ancestries Reported - French Canadian (%)
Ancestries Reported - German (%)
Ancestries Reported - Greek (%)
Ancestries Reported - Hungarian (%)
Ancestries Reported - Irish (%)
Ancestries Reported - Italian (%)
Ancestries Reported - Lithuanian (%)
Ancestries Reported - Norwegian (%)
Ancestries Reported - Polish (%)
Ancestries Reported - Portuguese (%)
Ancestries Reported - Russian (%)
Ancestries Reported - Scotch-Irish (%)
Ancestries Reported - Scottish (%)
Ancestries Reported - Slovak (%)
Ancestries Reported - Subsaharan African (%)
Ancestries Reported - Swedish (%)
Ancestries Reported - Swiss (%)
Ancestries Reported - Ukrainian (%)
Ancestries Reported - United States (%)
Ancestries Reported - Welsh (%)
Ancestries Reported - West Indian (%)
Ancestries Reported - Other (%)
Geographical mobility - Same house 1 year ago (%)
Geographical mobility - Same house 1 year ago (%) - White
Geographical mobility - Same house 1 year ago (%) - Black or African American
Geographical mobility - Same house 1 year ago (%) - Asian
Geographical mobility - Same house 1 year ago (%) - Hispanic or Latino
Geographical mobility - Same house 1 year ago (%) - American Indian and Alaska Native
Geographical mobility - Same house 1 year ago (%) - Multirace
Geographical mobility - Same house 1 year ago (%) - Other Race
Geographical mobility - Moved within same county (%)
Geographical mobility - Moved within same county (%) - White
Geographical mobility - Moved within same county (%) - Black or African American
Geographical mobility - Moved within same county (%) - Asian
Geographical mobility - Moved within same county (%) - Hispanic or Latino
Geographical mobility - Moved within same county (%) - American Indian and Alaska Native
Geographical mobility - Moved within same county (%) - Multirace
Geographical mobility - Moved within same county (%) - Other Race
Geographical mobility - Moved from different county within same state (%)
Geographical mobility - Moved from different county within same state (%) - White
Geographical mobility - Moved from different county within same state (%) - Black or African American
Geographical mobility - Moved from different county within same state (%) - Asian
Geographical mobility - Moved from different county within same state (%) - Hispanic or Latino
Geographical mobility - Moved from different county within same state (%) - American Indian and Alaska Native
Geographical mobility - Moved from different county within same state (%) - Multirace
Geographical mobility - Moved from different county within same state (%) - Other Race
Geographical mobility - Moved from different state (%)
Geographical mobility - Moved from different state (%) - White
Geographical mobility - Moved from different state (%) - Black or African American
Geographical mobility - Moved from different state (%) - Asian
Geographical mobility - Moved from different state (%) - Hispanic or Latino
Geographical mobility - Moved from different state (%) - American Indian and Alaska Native
Geographical mobility - Moved from different state (%) - Multirace
Geographical mobility - Moved from different state (%) - Other Race
Geographical mobility - Moved from abroad (%)
Geographical mobility - Moved from abroad (%) - White
Geographical mobility - Moved from abroad (%) - Black or African American
Geographical mobility - Moved from abroad (%) - Asian
Geographical mobility - Moved from abroad (%) - Hispanic or Latino
Geographical mobility - Moved from abroad (%) - American Indian and Alaska Native
Geographical mobility - Moved from abroad (%) - Multirace
Geographical mobility - Moved from abroad (%) - Other Race
Place of birth for the foreign-born population - Ireland (%)
Place of birth for the foreign-born population - Denmark (%)
Place of birth for the foreign-born population - Norway (%)
Place of birth for the foreign-born population - Sweden (%)
Place of birth for the foreign-born population - United Kingdom (%)
Place of birth for the foreign-born population - England (%)
Place of birth for the foreign-born population - Scotland (%)
Place of birth for the foreign-born population - Other Northern Europe (%)
Place of birth for the foreign-born population - Austria (%)
Place of birth for the foreign-born population - Belgium (%)
Place of birth for the foreign-born population - France (%)
Place of birth for the foreign-born population - Germany (%)
Place of birth for the foreign-born population - Netherlands (%)
Place of birth for the foreign-born population - Switzerland (%)
Place of birth for the foreign-born population - Other Western Europe (%)
Place of birth for the foreign-born population - Greece (%)
Place of birth for the foreign-born population - Italy (%)
Place of birth for the foreign-born population - Portugal (%)
Place of birth for the foreign-born population - Spain (%)
Place of birth for the foreign-born population - Other Southern Europe (%)
Place of birth for the foreign-born population - Albania (%)
Place of birth for the foreign-born population - Belarus (%)
Place of birth for the foreign-born population - Bosnia and Herzegovina (%)
Place of birth for the foreign-born population - Bulgaria (%)
Place of birth for the foreign-born population - Croatia (%)
Place of birth for the foreign-born population - Czechoslovakia (%)
Place of birth for the foreign-born population - Hungary (%)
Place of birth for the foreign-born population - Latvia (%)
Place of birth for the foreign-born population - Lithuania (%)
Place of birth for the foreign-born population - North Macedonia (Macedonia) (%)
Place of birth for the foreign-born population - Moldova (%)
Place of birth for the foreign-born population - Poland (%)
Place of birth for the foreign-born population - Romania (%)
Place of birth for the foreign-born population - Russia (%)
Place of birth for the foreign-born population - Serbia (%)
Place of birth for the foreign-born population - Ukraine (%)
Place of birth for the foreign-born population - Other Eastern Europe (%)
Place of birth for the foreign-born population - China (%)
Place of birth for the foreign-born population - Hong Kong (%)
Place of birth for the foreign-born population - Taiwan (%)
Place of birth for the foreign-born population - Japan (%)
Place of birth for the foreign-born population - Korea (%)
Place of birth for the foreign-born population - Other Eastern Asia (%)
Place of birth for the foreign-born population - Afghanistan (%)
Place of birth for the foreign-born population - Bangladesh (%)
Place of birth for the foreign-born population - India (%)
Place of birth for the foreign-born population - Iran (%)
Place of birth for the foreign-born population - Kazakhstan (%)
Place of birth for the foreign-born population - Nepal (%)
Place of birth for the foreign-born population - Pakistan (%)
Place of birth for the foreign-born population - Sri Lanka (%)
Place of birth for the foreign-born population - Uzbekistan (%)
Place of birth for the foreign-born population - Other South Central Asia (%)
Place of birth for the foreign-born population - Burma (%)
Place of birth for the foreign-born population - Cambodia (%)
Place of birth for the foreign-born population - Indonesia (%)
Place of birth for the foreign-born population - Laos (%)
Place of birth for the foreign-born population - Malaysia (%)
Place of birth for the foreign-born population - Philippines (%)
Place of birth for the foreign-born population - Singapore (%)
Place of birth for the foreign-born population - Thailand (%)
Place of birth for the foreign-born population - Vietnam (%)
Place of birth for the foreign-born population - Other South Eastern Asia (%)
Place of birth for the foreign-born population - Armenia (%)
Place of birth for the foreign-born population - Iraq (%)
Place of birth for the foreign-born population - Israel (%)
Place of birth for the foreign-born population - Jordan (%)
Place of birth for the foreign-born population - Kuwait (%)
Place of birth for the foreign-born population - Lebanon (%)
Place of birth for the foreign-born population - Saudi Arabia (%)
Place of birth for the foreign-born population - Syria (%)
Place of birth for the foreign-born population - Turkey (%)
Place of birth for the foreign-born population - Yemen (%)
Place of birth for the foreign-born population - Other Western Asia (%)
Place of birth for the foreign-born population - Eritrea (%)
Place of birth for the foreign-born population - Ethiopia (%)
Place of birth for the foreign-born population - Kenya (%)
Place of birth for the foreign-born population - Somalia (%)
Place of birth for the foreign-born population - Uganda (%)
Place of birth for the foreign-born population - Zimbabwe (%)
Place of birth for the foreign-born population - Other Eastern Africa (%)
Place of birth for the foreign-born population - Cameroon (%)
Place of birth for the foreign-born population - Congo (%)
Place of birth for the foreign-born population - Democratic Republic of Congo (Zaire) (%)
Place of birth for the foreign-born population - Other Middle Africa (%)
Place of birth for the foreign-born population - Egypt (%)
Place of birth for the foreign-born population - Morocco (%)
Place of birth for the foreign-born population - Sudan (%)
Place of birth for the foreign-born population - Other Northern Africa (%)
Place of birth for the foreign-born population - South Africa (%)
Place of birth for the foreign-born population - Other Southern Africa (%)
Place of birth for the foreign-born population - Cabo Verde (%)
Place of birth for the foreign-born population - Ghana (%)
Place of birth for the foreign-born population - Liberia (%)
Place of birth for the foreign-born population - Nigeria (%)
Place of birth for the foreign-born population - Senegal (%)
Place of birth for the foreign-born population - Sierra Leone (%)
Place of birth for the foreign-born population - Other Western Africa (%)
Place of birth for the foreign-born population - Australia (%)
Place of birth for the foreign-born population - New Zealand (%)
Place of birth for the foreign-born population - Fiji (%)
Place of birth for the foreign-born population - Micronesia (%)
Place of birth for the foreign-born population - Bahamas (%)
Place of birth for the foreign-born population - Barbados (%)
Place of birth for the foreign-born population - Cuba (%)
Place of birth for the foreign-born population - Dominica (%)
Place of birth for the foreign-born population - Dominican Republic (%)
Place of birth for the foreign-born population - Grenada (%)
Place of birth for the foreign-born population - Haiti (%)
Place of birth for the foreign-born population - Jamaica (%)
Place of birth for the foreign-born population - St. Vincent and the Grenadines (%)
Place of birth for the foreign-born population - Trinidad and Tobago (%)
Place of birth for the foreign-born population - West Indies (%)
Place of birth for the foreign-born population - Other Caribbean (%)
Place of birth for the foreign-born population - Belize (%)
Place of birth for the foreign-born population - Costa Rica (%)
Place of birth for the foreign-born population - El Salvador (%)
Place of birth for the foreign-born population - Guatemala (%)
Place of birth for the foreign-born population - Honduras (%)
Place of birth for the foreign-born population - Mexico (%)
Place of birth for the foreign-born population - Nicaragua (%)
Place of birth for the foreign-born population - Panama (%)
Place of birth for the foreign-born population - Other Central America (%)
Place of birth for the foreign-born population - Argentina (%)
Place of birth for the foreign-born population - Bolivia (%)
Place of birth for the foreign-born population - Brazil (%)
Place of birth for the foreign-born population - Chile (%)
Place of birth for the foreign-born population - Colombia (%)
Place of birth for the foreign-born population - Ecuador (%)
Place of birth for the foreign-born population - Guyana (%)
Place of birth for the foreign-born population - Peru (%)
Place of birth for the foreign-born population - Uruguay (%)
Place of birth for the foreign-born population - Venezuela (%)
Place of birth for the foreign-born population - Other South America (%)
Place of birth for the foreign-born population - Canada (%)
Place of birth for the foreign-born population - Other Northern America (%)
Place of birth for the foreign-born population - Other (%)
Latest news about races in Cayce, SC collected exclusively by city-data.com from local newspapers, TV, and radio stations
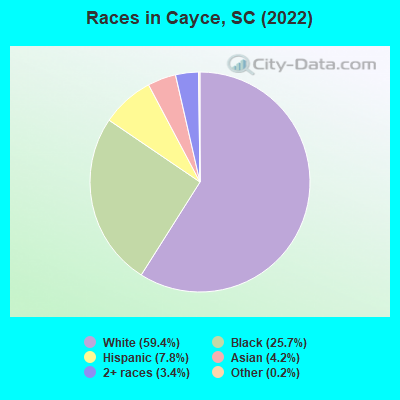
According to 2022 data, the most numerous races in Cayce, SC are White alone (8,413 residents), Black alone (3,636 residents), and Hispanic (1,100 residents). 91.4% of Cayce residents speak English at home. 5.5% of Cayce, SC residents are foreign-born (2.8% born in Asia, 1.9% born in Latin America, 0.8% born in Europe), which is 8.4% greater than the foreign-born rate of 5.0% across the entire state of South Carolina.
Race distribution in Cayce
2000 2022
2,652,291 66.1% White alone 1,178,486 29.4% Black alone 95,076 2.4% Hispanic 35,568 0.9% Asian alone 33,290 0.8% Two or more races 12,765 0.3% American Indian alone 3,266 0.08% Other race alone 1,270 0.03% Native Hawaiian and Other
3,301,739 62.5% White alone 1,313,290 24.9% Black alone 343,783 6.5% Hispanic 190,508 3.6% Two or more races 89,888 1.7% Asian alone 29,390 0.6% Other race alone 12,112 0.2% American Indian alone 1,924 0.04% Native Hawaiian and Other
Income and house value in Cayce Median household income in 2022 $64,371 White non-Hispanic householders$36,124 Black householders$98,622 Asian householders$24,371 Some other race householders$48,326 Hispanic or Latino race householdersMedian 2022 house value $176,561 White Non-Hispanic householders$117,707 Black or African American householders $251,504 Asian householders$179,948 Two or more races householders$329,411 Hispanic or Latino householders
Median age by race in Cayce
40.5 Median age for White residents37.5 46.9 32.9 Median age for Black or African American residents38.0 30.0 -984,126,983.1 Median age for American Indian / Alaska Native residents-878,787,877.9 -1,034,343,433.3 30.1 Median age for Asian residents31.1 24.9 -698,412,697.7 Median age for Native Hawaiian / Pacific Islander residents-551,574,375.1 -666,666,666.0 22.0 Median age for Other race residents53.1 26.9 29.2 Median age for Two or more races residents24.0 40.1 41.4 Median age for White alone residents37.9 48.6 21.9 Median age for Hispanic or Latino residents20.4 24.1
Owner/renter occupied households by race in Cayce
House owners and renters - White residents 3,041 72.1% Owner occupied1,176 27.9% Renter occupiedHouse owners and renters - Black or African American residents 574 35.4% Owner occupied1,048 64.6% Renter occupiedHouse owners and renters - Asian residents 55 20.0% Owner occupied219 80.0% Renter occupiedHouse owners and renters - Other race residents 9 5.0% Owner occupied169 95.0% Renter occupiedHouse owners and renters - Two or more races residents 378 59.7% Owner occupied255 40.3% Renter occupiedHouse owners and renters - White alone residents 2,996 72.9% Owner occupied1,112 27.1% Renter occupiedHouse owners and renters - Hispanic or Latino residents 137 22.0% Owner occupied484 78.0% Renter occupied
Language usage in Cayce
English speakers - Total 91.4% of residents of Cayce speak English at home.
5.3% of residents speak Spanish at home 511 72.1% Speak English very well198 27.9% Speak English less than very well3.3% of residents speak other language at home 262 58.4% Speak English very well187 41.6% Speak English less than very well
English speakers - Born in the United States 96.1% of residents of Cayce speak English at home.
2.4% of residents speak Spanish at home 104 100.0% Speak English very well1.0% of residents speak other language at home 37 84.1% Speak English very well7 15.9% Speak English less than very well
English speakers - Native, born elsewhere 71.1% of residents of Cayce speak English at home.
30.3% of residents speak Spanish at home 28 42.4% Speak English very well38 57.6% Speak English less than very well
English speakers - Foreign-born 13.5% of residents of Cayce speak English at home.
31.9% of residents speak Spanish at home 85 33.9% Speak English very well166 66.1% Speak English less than very well50.0% of residents speak other language at home 227 57.8% Speak English very well166 42.2% Speak English less than very well
White (Caucasian) - Speak only English Native:
98.3% (8,043)Foreign-born:
29.3% (42)
White (Caucasian) - Speak another language Native:
1.5% (123)Foreign-born:
70.5% (102)
Asian - Speak only English Native:
66.9% (107)Foreign-born:
14.7% (54)
Asian - Speak another language Native:
26.9% (43)Foreign-born:
81.3% (297)
Other race - Speak another language Native:
54.4% (96)Foreign-born:
100.0% (22)
Two or more races - Speak another language Native:
24.4% (195)Foreign-born:
100.0% (315)
White alone - Speak only English Native:
99.0% (7,981)Foreign-born:
41.1% (49)
White alone - Speak another language Native:
0.9% (70)Foreign-born:
58.5% (70)
Hispanic or Latino - Speak another language Native:
55.5% (352)Foreign-born:
100.0% (282)
Foreign-born residents in Cayce 773 residents are foreign born (2.8% Asia , 1.9% Latin America , 0.8% Europe ).
This city:
5.5%South Carolina:
5.3%
Marital status for residents in Cayce Marital status - White (Caucasian) population 15 years and over
Males 44.4% Never married41.8% Now married1.5% Separated2.5% Widowed9.8% DivorcedFemales 29.6% Never married41.9% Now married1.8% Separated11.7% Widowed14.9% DivorcedWomen who gave birth in the past 12 months Now married:
85.8% (97)Unmarried:
14.2% (16)
Women who did not give birth in the past 12 months Now married:
37.6% (645)Unmarried:
62.4% (1,071)
Marital status - Black or African American population 15 years and over
Males 58.4% Never married19.2% Now married9.1% Separated3.0% Widowed10.3% DivorcedFemales 59.0% Never married18.9% Now married0.0% Separated3.6% Widowed18.5% DivorcedWomen who gave birth in the past 12 months Now married:
0.0% (0)Unmarried:
100.0% (35)
Women who did not give birth in the past 12 months Now married:
15.7% (123)Unmarried:
84.3% (659)
Marital status - Asian population 15 years and over
Males 37.7% Never married42.4% Now married6.1% Separated3.0% Widowed10.8% DivorcedFemales 63.7% Never married15.8% Now married4.7% Separated9.3% Widowed6.5% DivorcedWomen who gave birth in the past 12 months Now married:
100.0% (10)Unmarried:
0.0% (0)
Women who did not give birth in the past 12 months Now married:
16.0% (29)Unmarried:
84.0% (152)
Marital status - Other race population 15 years and over
Males 62.2% Never married0.0% Now married0.0% Separated0.0% Widowed37.8% DivorcedFemales 89.9% Never married0.0% Now married0.0% Separated0.0% Widowed10.1% DivorcedWomen who did not give birth in the past 12 months Now married:
0.0% (0)Unmarried:
100.0% (206)
Marital status - Two or more races population 15 years and over
Males 31.6% Never married43.3% Now married0.0% Separated0.0% Widowed25.1% DivorcedFemales 23.0% Never married24.1% Now married2.2% Separated3.3% Widowed47.5% DivorcedWomen who did not give birth in the past 12 months Now married:
40.5% (101)Unmarried:
59.5% (148)
Marital status - White alone, not Hispanic / Latino population 15 years and over
Males 44.4% Never married41.8% Now married1.5% Separated2.5% Widowed9.8% DivorcedFemales 29.2% Never married43.3% Now married1.3% Separated11.5% Widowed14.7% DivorcedWomen who gave birth in the past 12 months Now married:
85.8% (97)Unmarried:
14.2% (16)
Women who did not give birth in the past 12 months Now married:
38.0% (623)Unmarried:
62.0% (1,016)
Marital status - Hispanic or Latino population 15 years and over
Males 35.2% Never married40.2% Now married0.0% Separated0.0% Widowed24.6% DivorcedFemales 50.2% Never married21.1% Now married7.0% Separated4.4% Widowed17.3% DivorcedWomen who did not give birth in the past 12 months Now married:
29.8% (136)Unmarried:
70.2% (322)
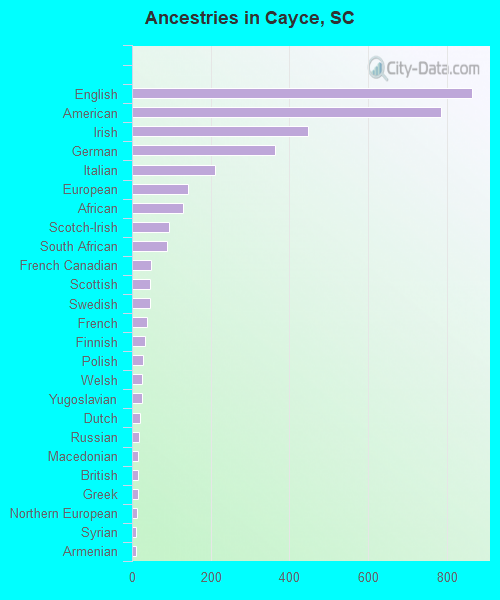
Ancestries in Cayce
864 12.0% English786 10.9% American447 6.2% Irish364 5.1% German211 2.9% Italian142 2.0% European129 1.8% African93 1.3% Scotch-Irish88 1.2% South African48 0.7% French Canadian46 0.6% Scottish46 0.6% Swedish39 0.5% French32 0.4% Finnish29 0.4% Polish25 0.3% Welsh25 0.3% Yugoslavian20 0.3% Dutch18 0.3% Russian16 0.2% Macedonian15 0.2% British15 0.2% Greek13 0.2% Northern European10 0.1% Syrian9 0.1% Armenian8 0.1% Belgian7 0.10% Norwegian7 0.10% Swiss
Children Nativity (place of birth) in Cayce
Children under 6 years - Living with two parents Both parents native 356 100.0% NativeBoth parents foreign-born 94 77.0% Native28 23.0% Foreign-bornChildren under 6 years - Living with one parent Native parent 302 100.0% NativeForeign-born parent 8 100.0% Foreign-bornChildren 6 to 17 years - Living with two parents Both parents native 683 100.0% NativeBoth parents foreign-born 39 100.0% NativeOne native, one foreign-born parent 9 100.0% NativeChildren 6 to 17 years - Living with one parent Native parent 884 96.9% Native28 3.1% Foreign-bornForeign-born parent 78 70.9% Native32 29.1% Foreign-born
Grandparents responsible for own grandchildren in Cayce
Grandparents (30 to 59 years) White / Caucasian 8 100.0% Responsible for grandchildrenAsian 5 100.0% Responsible for grandchildrenTwo or more races 4 100.0% Not responsible for grandchildrenWhite alone, not Hispanic / Latino 9 100.0% Responsible for grandchildren
Grandparents (60 years and over) White / Caucasian 32 100.0% Not responsible for grandchildrenWhite alone, not Hispanic / Latino 32 100.0% Not responsible for grandchildren