Races in Carver, Massachusetts (MA) Detailed Stats
Ancestries, Foreign-born residents, place of birth

Recent posts about races in Carver, Massachusetts on our local forum with over 2,400,000 registered users:
 | People are leaving Massachusetts in droves. Who are they? (334 replies) |
| WFH in MA 2024 (217 replies) |
| 2023 Real Estate Observations (5278 replies) |
| towns that offer the most jobs per dollar of house (58 replies) |
| 2021 Real Estate Observations (1729 replies) |
| middle class black/latino areas in southern new england (31 replies) |
2.9% of Carver, MA residents are foreign-born (1.1% born in North America, 1.0% born in Europe, 0.3% born in Africa, 0.3% born in Asia), which is 520.2% less than the foreign-born rate of 18.0% across the entire state of Massachusetts.
Race distribution in Carver

- 10,63695.3%White alone
- 1711.5%Two or more races
- 1351.2%Black alone
- 910.8%Hispanic
- 850.8%Other race alone
- 340.3%Asian alone
- 100.09%American Indian alone
- 10.01%Native Hawaiian and Other
Pacific Islander alone

2000
2022
-
- 5,198,35981.9%White alone
- 428,7296.8%Hispanic
- 318,3295.0%Black alone
- 236,7863.7%Asian alone
- 110,3381.7%Two or more races
- 43,5860.7%Other race alone
- 11,2640.2%American Indian alone
- 1,7060.03%Native Hawaiian and Other
Pacific Islander alone

-
- 4,676,62767.0%White alone
- 911,03813.0%Hispanic
- 501,4637.2%Asian alone
- 459,7406.6%Black alone
- 341,8894.9%Two or more races
- 84,4031.2%Other race alone
- 5,8380.08%American Indian alone
- 9760.01%Native Hawaiian and Other
Pacific Islander alone

Income and house value in Carver
- Median household income in 2022
- $98,566White non-Hispanic householders
- $132,398Black householders
- $129,994American Indian and Alaska Native householders
- $98,113Some other race householders
- $148,444Two or more races householders
- $109,156Hispanic or Latino race householders
- Median 2022 house value
- $519,143White Non-Hispanic householders
- $402,359Black or African American householders
- $350,351American Indian or Alaska Native householders
- $488,000Some other race householders
- $588,902Two or more races householders
- $350,351Hispanic or Latino householders
Household income for White non-Hispanic householders

Household income for Black householders

Household income for American Indian and Alaska Native householders

Household income for Two or more races householders

Household income for Hispanic or Latino race householders

Foreign-born residents in Carver
324 residents are foreign born (1.1% North America, 1.0% Europe, 0.3% Africa, 0.3% Asia).
| This city: | 2.9% |
| Massachusetts: | 12.2% |
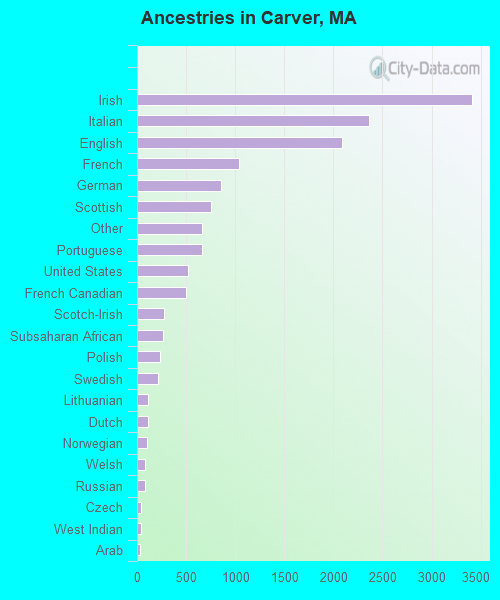
Ancestries in Carver

- 3,41423.5%Irish
- 2,36316.3%Italian
- 2,09214.4%English
- 1,0377.1%French
- 8595.9%German
- 7565.2%Scottish
- 6654.6%Other
- 6624.6%Portuguese
- 5173.6%United States
- 5003.4%French Canadian
- 2801.9%Scotch-Irish
- 2611.8%Subsaharan African
- 2331.6%Polish
- 2151.5%Swedish
- 1160.8%Lithuanian
- 1110.8%Dutch
- 970.7%Norwegian
- 850.6%Welsh
- 830.6%Russian
- 440.3%Czech
- 420.3%West Indian
- 320.2%Arab
- 310.2%Greek
- 210.1%Slovak
- 80.06%Hungarian
Zip codes: 02330.