Races in Calapooia, Oregon (OR) Detailed Stats
Ancestries, Foreign-born residents, place of birth
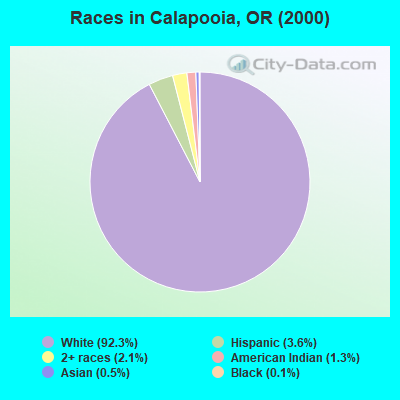
Race distribution in Calapooia

- 13,36692.3%White alone
- 5203.6%Hispanic
- 3102.1%Two or more races
- 1841.3%American Indian alone
- 660.5%Asian alone
- 180.1%Black alone
- 70.05%Native Hawaiian and Other
Pacific Islander alone - 60.04%Other race alone
2000
2022
-
- 2,857,61683.5%White alone
- 275,3148.0%Hispanic
- 100,3332.9%Asian alone
- 82,7332.4%Two or more races
- 53,3251.6%Black alone
- 40,1301.2%American Indian alone
- 7,3980.2%Native Hawaiian and Other
Pacific Islander alone - 4,5500.1%Other race alone

-
- 3,037,57171.6%White alone
- 609,53814.4%Hispanic
- 252,7446.0%Two or more races
- 191,2834.5%Asian alone
- 78,2281.8%Black alone
- 29,3990.7%American Indian alone
- 25,7310.6%Other race alone
- 15,6430.4%Native Hawaiian and Other
Pacific Islander alone

Income and house value in Calapooia
- Median household income in 2022
- $53,947White non-Hispanic householders
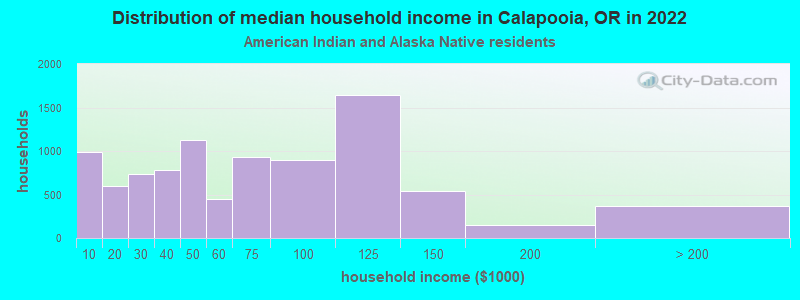
- $58,748American Indian and Alaska Native householders
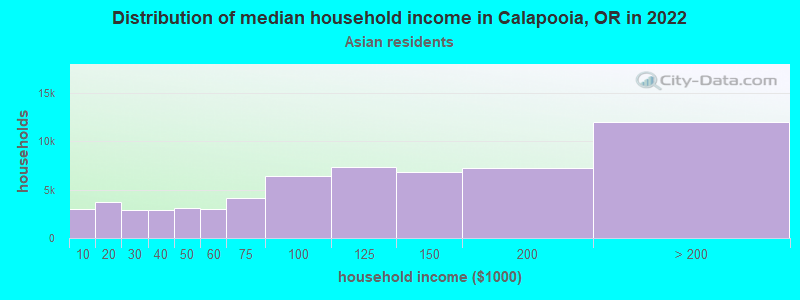
- $86,228Asian householders
- $26,938Some other race householders
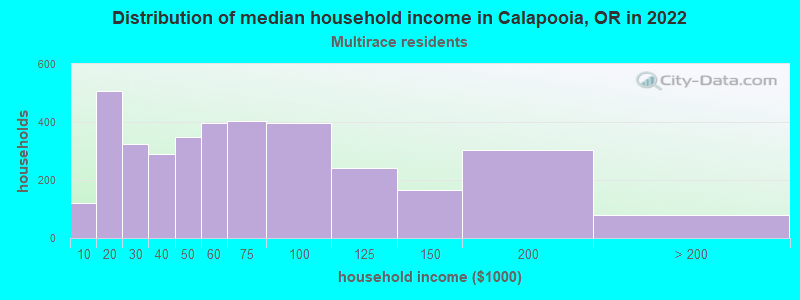
- $53,434Two or more races householders
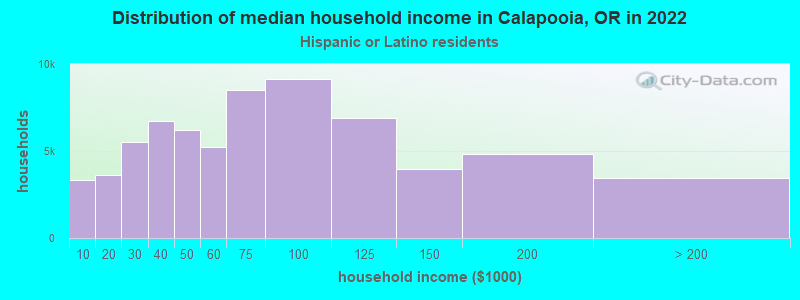
- $33,713Hispanic or Latino race householders
- Median 2022 house value
- $412,351White Non-Hispanic householders
- $604,712Black or African American householders
- $487,197American Indian or Alaska Native householders
- $429,839Some other race householders
- $443,479Two or more races householders
- $393,465Hispanic or Latino householders
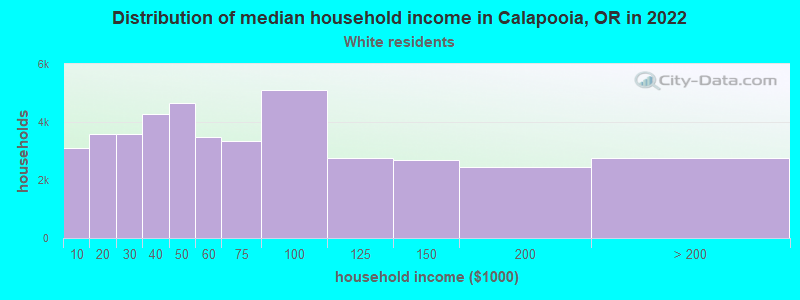
Household income for White non-Hispanic householders
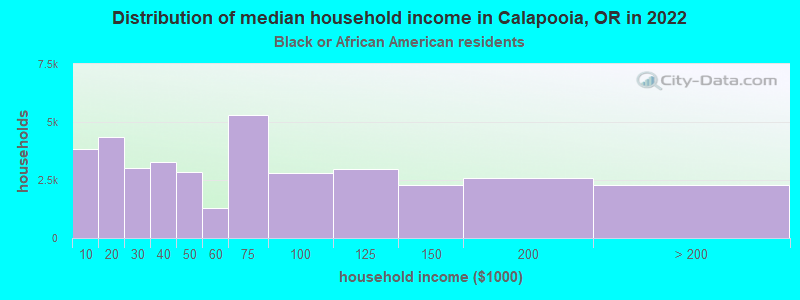
Household income for Black householders
Household income for American Indian and Alaska Native householders
Household income for Asian householders
Household income for Two or more races householders
Household income for Hispanic or Latino race householders
Zip code: 97479