Races in Burnsville, Minnesota (MN) Detailed Stats
Data:
Races - White alone (%)
Races - White alone (% change since 2000)
Races - Black alone (%)
Races - Black alone (% change since 2000)
Races - American Indian alone (%)
Races - American Indian alone (% change since 2000)
Races - Asian alone (%)
Races - Asian alone (% change since 2000)
Races - Hispanic (%)
Races - Hispanic (% change since 2000)
Races - Native Hawaiian and Other Pacific Islander alone (%)
Races - Native Hawaiian and Other Pacific Islander alone (% change since 2000)
Races - Two or more races(%)
Races - Two or more races(% change since 2000)
Races - Other race alone (%)
Races - Other race alone (% change since 2000)
Racial diversity
Place of birth - Born in state of residence (%)
Place of birth - Born in state of residence (%) - White
Place of birth - Born in state of residence (%) - Black or African American
Place of birth - Born in state of residence (%) - Asian
Place of birth - Born in state of residence (%) - Hispanic or Latino
Place of birth - Born in state of residence (%) - American Indian and Alaska Native
Place of birth - Born in state of residence (%) - Multirace
Place of birth - Born in state of residence (%) - Other Race
Place of birth - Born in other state (%)
Place of birth - Born in other state (%) - White
Place of birth - Born in other state (%) - Black or African American
Place of birth - Born in other state (%) - Asian
Place of birth - Born in other state (%) - Hispanic or Latino
Place of birth - Born in other state (%) - American Indian and Alaska Native
Place of birth - Born in other state (%) - Multirace
Place of birth - Born in other state (%) - Other Race
Place of birth - Native, outside of US (%)
Place of birth - Native, outside of US (%) - White
Place of birth - Native, outside of US (%) - Black or African American
Place of birth - Native, outside of US (%) - Asian
Place of birth - Native, outside of US (%) - Hispanic or Latino
Place of birth - Native, outside of US (%) - American Indian and Alaska Native
Place of birth - Native, outside of US (%) - Multirace
Place of birth - Native, outside of US (%) - Other Race
Place of birth - Foreign born (%)
Place of birth - Foreign born (%) - White
Place of birth - Foreign born (%) - Black or African American
Place of birth - Foreign born (%) - Asian
Place of birth - Foreign born (%) - Hispanic or Latino
Place of birth - Foreign born (%) - American Indian and Alaska Native
Place of birth - Foreign born (%) - Multirace
Place of birth - Foreign born (%) - Other Race
Residents speaking English at home (%)
Residents speaking English at home - Born in the United States (%)
Residents speaking English at home - Native, born elsewhere (%)
Residents speaking English at home - Foreign born (%)
Residents speaking Spanish at home (%)
Residents speaking Spanish at home - Born in the United States (%)
Residents speaking Spanish at home - Native, born elsewhere (%)
Residents speaking Spanish at home - Foreign born (%)
Residents speaking other language at home (%)
Residents speaking other language at home - Born in the United States (%)
Residents speaking other language at home - Native, born elsewhere (%)
Residents speaking other language at home - Foreign born (%)
Marital status - Never married (%)
Marital status - Now married (%)
Marital status - Separated (%)
Marital status - Widowed (%)
Marital status - Divorced (%)
Ancestries Reported - Arab (%)
Ancestries Reported - Czech (%)
Ancestries Reported - Danish (%)
Ancestries Reported - Dutch (%)
Ancestries Reported - English (%)
Ancestries Reported - French (%)
Ancestries Reported - French Canadian (%)
Ancestries Reported - German (%)
Ancestries Reported - Greek (%)
Ancestries Reported - Hungarian (%)
Ancestries Reported - Irish (%)
Ancestries Reported - Italian (%)
Ancestries Reported - Lithuanian (%)
Ancestries Reported - Norwegian (%)
Ancestries Reported - Polish (%)
Ancestries Reported - Portuguese (%)
Ancestries Reported - Russian (%)
Ancestries Reported - Scotch-Irish (%)
Ancestries Reported - Scottish (%)
Ancestries Reported - Slovak (%)
Ancestries Reported - Subsaharan African (%)
Ancestries Reported - Swedish (%)
Ancestries Reported - Swiss (%)
Ancestries Reported - Ukrainian (%)
Ancestries Reported - United States (%)
Ancestries Reported - Welsh (%)
Ancestries Reported - West Indian (%)
Ancestries Reported - Other (%)
Geographical mobility - Same house 1 year ago (%)
Geographical mobility - Same house 1 year ago (%) - White
Geographical mobility - Same house 1 year ago (%) - Black or African American
Geographical mobility - Same house 1 year ago (%) - Asian
Geographical mobility - Same house 1 year ago (%) - Hispanic or Latino
Geographical mobility - Same house 1 year ago (%) - American Indian and Alaska Native
Geographical mobility - Same house 1 year ago (%) - Multirace
Geographical mobility - Same house 1 year ago (%) - Other Race
Geographical mobility - Moved within same county (%)
Geographical mobility - Moved within same county (%) - White
Geographical mobility - Moved within same county (%) - Black or African American
Geographical mobility - Moved within same county (%) - Asian
Geographical mobility - Moved within same county (%) - Hispanic or Latino
Geographical mobility - Moved within same county (%) - American Indian and Alaska Native
Geographical mobility - Moved within same county (%) - Multirace
Geographical mobility - Moved within same county (%) - Other Race
Geographical mobility - Moved from different county within same state (%)
Geographical mobility - Moved from different county within same state (%) - White
Geographical mobility - Moved from different county within same state (%) - Black or African American
Geographical mobility - Moved from different county within same state (%) - Asian
Geographical mobility - Moved from different county within same state (%) - Hispanic or Latino
Geographical mobility - Moved from different county within same state (%) - American Indian and Alaska Native
Geographical mobility - Moved from different county within same state (%) - Multirace
Geographical mobility - Moved from different county within same state (%) - Other Race
Geographical mobility - Moved from different state (%)
Geographical mobility - Moved from different state (%) - White
Geographical mobility - Moved from different state (%) - Black or African American
Geographical mobility - Moved from different state (%) - Asian
Geographical mobility - Moved from different state (%) - Hispanic or Latino
Geographical mobility - Moved from different state (%) - American Indian and Alaska Native
Geographical mobility - Moved from different state (%) - Multirace
Geographical mobility - Moved from different state (%) - Other Race
Geographical mobility - Moved from abroad (%)
Geographical mobility - Moved from abroad (%) - White
Geographical mobility - Moved from abroad (%) - Black or African American
Geographical mobility - Moved from abroad (%) - Asian
Geographical mobility - Moved from abroad (%) - Hispanic or Latino
Geographical mobility - Moved from abroad (%) - American Indian and Alaska Native
Geographical mobility - Moved from abroad (%) - Multirace
Geographical mobility - Moved from abroad (%) - Other Race
Place of birth for the foreign-born population - Ireland (%)
Place of birth for the foreign-born population - Denmark (%)
Place of birth for the foreign-born population - Norway (%)
Place of birth for the foreign-born population - Sweden (%)
Place of birth for the foreign-born population - United Kingdom (%)
Place of birth for the foreign-born population - England (%)
Place of birth for the foreign-born population - Scotland (%)
Place of birth for the foreign-born population - Other Northern Europe (%)
Place of birth for the foreign-born population - Austria (%)
Place of birth for the foreign-born population - Belgium (%)
Place of birth for the foreign-born population - France (%)
Place of birth for the foreign-born population - Germany (%)
Place of birth for the foreign-born population - Netherlands (%)
Place of birth for the foreign-born population - Switzerland (%)
Place of birth for the foreign-born population - Other Western Europe (%)
Place of birth for the foreign-born population - Greece (%)
Place of birth for the foreign-born population - Italy (%)
Place of birth for the foreign-born population - Portugal (%)
Place of birth for the foreign-born population - Spain (%)
Place of birth for the foreign-born population - Other Southern Europe (%)
Place of birth for the foreign-born population - Albania (%)
Place of birth for the foreign-born population - Belarus (%)
Place of birth for the foreign-born population - Bosnia and Herzegovina (%)
Place of birth for the foreign-born population - Bulgaria (%)
Place of birth for the foreign-born population - Croatia (%)
Place of birth for the foreign-born population - Czechoslovakia (%)
Place of birth for the foreign-born population - Hungary (%)
Place of birth for the foreign-born population - Latvia (%)
Place of birth for the foreign-born population - Lithuania (%)
Place of birth for the foreign-born population - North Macedonia (Macedonia) (%)
Place of birth for the foreign-born population - Moldova (%)
Place of birth for the foreign-born population - Poland (%)
Place of birth for the foreign-born population - Romania (%)
Place of birth for the foreign-born population - Russia (%)
Place of birth for the foreign-born population - Serbia (%)
Place of birth for the foreign-born population - Ukraine (%)
Place of birth for the foreign-born population - Other Eastern Europe (%)
Place of birth for the foreign-born population - China (%)
Place of birth for the foreign-born population - Hong Kong (%)
Place of birth for the foreign-born population - Taiwan (%)
Place of birth for the foreign-born population - Japan (%)
Place of birth for the foreign-born population - Korea (%)
Place of birth for the foreign-born population - Other Eastern Asia (%)
Place of birth for the foreign-born population - Afghanistan (%)
Place of birth for the foreign-born population - Bangladesh (%)
Place of birth for the foreign-born population - India (%)
Place of birth for the foreign-born population - Iran (%)
Place of birth for the foreign-born population - Kazakhstan (%)
Place of birth for the foreign-born population - Nepal (%)
Place of birth for the foreign-born population - Pakistan (%)
Place of birth for the foreign-born population - Sri Lanka (%)
Place of birth for the foreign-born population - Uzbekistan (%)
Place of birth for the foreign-born population - Other South Central Asia (%)
Place of birth for the foreign-born population - Burma (%)
Place of birth for the foreign-born population - Cambodia (%)
Place of birth for the foreign-born population - Indonesia (%)
Place of birth for the foreign-born population - Laos (%)
Place of birth for the foreign-born population - Malaysia (%)
Place of birth for the foreign-born population - Philippines (%)
Place of birth for the foreign-born population - Singapore (%)
Place of birth for the foreign-born population - Thailand (%)
Place of birth for the foreign-born population - Vietnam (%)
Place of birth for the foreign-born population - Other South Eastern Asia (%)
Place of birth for the foreign-born population - Armenia (%)
Place of birth for the foreign-born population - Iraq (%)
Place of birth for the foreign-born population - Israel (%)
Place of birth for the foreign-born population - Jordan (%)
Place of birth for the foreign-born population - Kuwait (%)
Place of birth for the foreign-born population - Lebanon (%)
Place of birth for the foreign-born population - Saudi Arabia (%)
Place of birth for the foreign-born population - Syria (%)
Place of birth for the foreign-born population - Turkey (%)
Place of birth for the foreign-born population - Yemen (%)
Place of birth for the foreign-born population - Other Western Asia (%)
Place of birth for the foreign-born population - Eritrea (%)
Place of birth for the foreign-born population - Ethiopia (%)
Place of birth for the foreign-born population - Kenya (%)
Place of birth for the foreign-born population - Somalia (%)
Place of birth for the foreign-born population - Uganda (%)
Place of birth for the foreign-born population - Zimbabwe (%)
Place of birth for the foreign-born population - Other Eastern Africa (%)
Place of birth for the foreign-born population - Cameroon (%)
Place of birth for the foreign-born population - Congo (%)
Place of birth for the foreign-born population - Democratic Republic of Congo (Zaire) (%)
Place of birth for the foreign-born population - Other Middle Africa (%)
Place of birth for the foreign-born population - Egypt (%)
Place of birth for the foreign-born population - Morocco (%)
Place of birth for the foreign-born population - Sudan (%)
Place of birth for the foreign-born population - Other Northern Africa (%)
Place of birth for the foreign-born population - South Africa (%)
Place of birth for the foreign-born population - Other Southern Africa (%)
Place of birth for the foreign-born population - Cabo Verde (%)
Place of birth for the foreign-born population - Ghana (%)
Place of birth for the foreign-born population - Liberia (%)
Place of birth for the foreign-born population - Nigeria (%)
Place of birth for the foreign-born population - Senegal (%)
Place of birth for the foreign-born population - Sierra Leone (%)
Place of birth for the foreign-born population - Other Western Africa (%)
Place of birth for the foreign-born population - Australia (%)
Place of birth for the foreign-born population - New Zealand (%)
Place of birth for the foreign-born population - Fiji (%)
Place of birth for the foreign-born population - Micronesia (%)
Place of birth for the foreign-born population - Bahamas (%)
Place of birth for the foreign-born population - Barbados (%)
Place of birth for the foreign-born population - Cuba (%)
Place of birth for the foreign-born population - Dominica (%)
Place of birth for the foreign-born population - Dominican Republic (%)
Place of birth for the foreign-born population - Grenada (%)
Place of birth for the foreign-born population - Haiti (%)
Place of birth for the foreign-born population - Jamaica (%)
Place of birth for the foreign-born population - St. Vincent and the Grenadines (%)
Place of birth for the foreign-born population - Trinidad and Tobago (%)
Place of birth for the foreign-born population - West Indies (%)
Place of birth for the foreign-born population - Other Caribbean (%)
Place of birth for the foreign-born population - Belize (%)
Place of birth for the foreign-born population - Costa Rica (%)
Place of birth for the foreign-born population - El Salvador (%)
Place of birth for the foreign-born population - Guatemala (%)
Place of birth for the foreign-born population - Honduras (%)
Place of birth for the foreign-born population - Mexico (%)
Place of birth for the foreign-born population - Nicaragua (%)
Place of birth for the foreign-born population - Panama (%)
Place of birth for the foreign-born population - Other Central America (%)
Place of birth for the foreign-born population - Argentina (%)
Place of birth for the foreign-born population - Bolivia (%)
Place of birth for the foreign-born population - Brazil (%)
Place of birth for the foreign-born population - Chile (%)
Place of birth for the foreign-born population - Colombia (%)
Place of birth for the foreign-born population - Ecuador (%)
Place of birth for the foreign-born population - Guyana (%)
Place of birth for the foreign-born population - Peru (%)
Place of birth for the foreign-born population - Uruguay (%)
Place of birth for the foreign-born population - Venezuela (%)
Place of birth for the foreign-born population - Other South America (%)
Place of birth for the foreign-born population - Canada (%)
Place of birth for the foreign-born population - Other Northern America (%)
Place of birth for the foreign-born population - Other (%)
Latest news about races in Burnsville, MN collected exclusively by city-data.com from local newspapers, TV, and radio stations
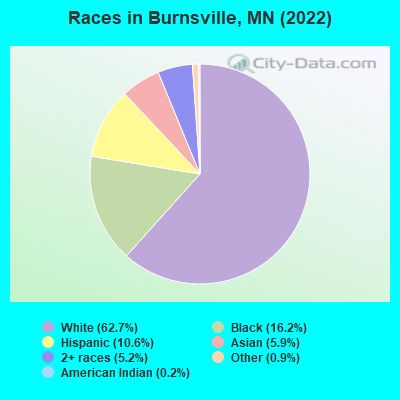
According to 2022 data, the most numerous races in Burnsville, MN are White alone (40,571 residents), Black alone (10,483 residents), and Hispanic (6,826 residents). 79.1% of Burnsville residents speak English at home. 14.6% of Burnsville, MN residents are foreign-born (4.6% born in Asia, 4.4% born in Latin America, 4.3% born in Africa), which is 45.4% greater than the foreign-born rate of 8.0% across the entire state of Minnesota.
Race distribution in Burnsville
2000 2022
51,952 86.3% White alone 2,433 4.0% Black alone 2,433 4.0% Asian alone 1,725 2.9% Hispanic 1,264 2.1% Two or more races 244 0.4% American Indian alone 129 0.2% Other race alone 40 0.07% Native Hawaiian and Other
40,571 62.7% White alone 10,483 16.2% Black alone 6,826 10.6% Hispanic 3,829 5.9% Asian alone 3,343 5.2% Two or more races 613 0.9% Other race alone 137 0.2% American Indian alone
2000 2022
4,337,143 88.2% White alone 168,813 3.4% Black alone 143,382 2.9% Hispanic 141,083 2.9% Asian alone 70,304 1.4% Two or more races 52,009 1.1% American Indian alone 5,031 0.1% Other race alone 1,714 0.03% Native Hawaiian and Other
4,356,347 76.2% White alone 395,179 6.9% Black alone 333,830 5.8% Hispanic 294,800 5.2% Asian alone 259,649 4.5% Two or more races 42,125 0.7% American Indian alone 32,976 0.6% Other race alone 2,278 0.04% Native Hawaiian and Other
Income and house value in Burnsville Median household income in 2022 $90,052 White non-Hispanic householders$72,494 Black householders$66,284 Asian householders$106,903 Some other race householders$74,743 Two or more races householders$73,326 Hispanic or Latino race householdersMedian 2022 house value $351,621 White Non-Hispanic householders$356,586 Black or African American householders$310,320 American Indian or Alaska Native householders $347,784 Asian householders$331,986 Some other race householders$363,357 Two or more races householders$353,878 Hispanic or Latino householders
Median age by race in Burnsville
46.2 Median age for White residents44.7 47.7 26.2 Median age for Black or African American residents28.6 23.9 25.9 Median age for American Indian / Alaska Native residents55.6 19.2 37.4 Median age for Asian residents36.5 37.2 -744,336,568.8 Median age for Native Hawaiian / Pacific Islander residents-856,799,036.4 -534,959,349.1 27.1 Median age for Other race residents29.6 25.9 23.2 Median age for Two or more races residents23.4 23.6 46.9 Median age for White alone residents45.3 49.0 25.7 Median age for Hispanic or Latino residents26.3 25.3
Owner/renter occupied households by race in Burnsville
House owners and renters - White residents 14,197 72.4% Owner occupied5,417 27.6% Renter occupiedHouse owners and renters - Black or African American residents 1,081 38.0% Owner occupied1,767 62.0% Renter occupiedHouse owners and renters - American Indian / Alaska Native residents 27 35.9% Owner occupied48 64.1% Renter occupiedHouse owners and renters - Asian residents 954 70.3% Owner occupied403 29.7% Renter occupiedHouse owners and renters - Other race residents 642 58.7% Owner occupied451 41.3% Renter occupiedHouse owners and renters - Two or more races residents 541 41.1% Owner occupied775 58.9% Renter occupiedHouse owners and renters - White alone residents 14,158 73.3% Owner occupied5,148 26.7% Renter occupiedHouse owners and renters - Hispanic or Latino residents 885 46.8% Owner occupied1,005 53.2% Renter occupied
Language usage in Burnsville
English speakers - Total 79.1% of residents of Burnsville speak English at home.
9.1% of residents speak Spanish at home 2,235 40.4% Speak English very well3,291 59.6% Speak English less than very well12.3% of residents speak other language at home 4,485 60.2% Speak English very well2,960 39.8% Speak English less than very well
English speakers - Born in the United States 92.5% of residents of Burnsville speak English at home.
4.4% of residents speak Spanish at home 585 76.2% Speak English very well183 23.8% Speak English less than very well2.4% of residents speak other language at home 399 95.5% Speak English very well19 4.5% Speak English less than very well
English speakers - Native, born elsewhere 72.9% of residents of Burnsville speak English at home.
28.9% of residents speak Spanish at home 77 33.3% Speak English very well154 66.7% Speak English less than very well9.3% of residents speak other language at home 74 100.0% Speak English very well
English speakers - Foreign-born 11.6% of residents of Burnsville speak English at home.
37.1% of residents speak Spanish at home 488 13.5% Speak English very well3,128 86.5% Speak English less than very well55.2% of residents speak other language at home 2,883 53.6% Speak English very well2,497 46.4% Speak English less than very well
White (Caucasian) - Speak only English Native:
97.0% (37,104)Foreign-born:
21.7% (278)
White (Caucasian) - Speak another language Native:
2.5% (952)Foreign-born:
71.7% (919)
Black or African American - Speak only English Native:
80.4% (5,581)Foreign-born:
4.6% (129)
Black or African American - Speak another language Native:
19.9% (1,384)Foreign-born:
95.8% (2,711)
Asian - Speak only English Native:
71.5% (1,065)Foreign-born:
19.7% (439)
Asian - Speak another language Native:
31.0% (461)Foreign-born:
80.3% (1,793)
Other race - Speak only English Native:
15.5% (224)Foreign-born:
16.8% (387)
Other race - Speak another language Native:
88.6% (1,284)Foreign-born:
84.0% (1,940)
Two or more races - Speak only English Native:
89.2% (3,510)Foreign-born:
1.6% (20)
Two or more races - Speak another language Native:
10.2% (400)Foreign-born:
100.0% (1,267)
White alone - Speak only English Native:
98.1% (36,881)Foreign-born:
20.4% (236)
White alone - Speak another language Native:
1.7% (649)Foreign-born:
75.9% (876)
Hispanic or Latino - Speak only English Native:
36.5% (1,040)Foreign-born:
8.2% (288)
Hispanic or Latino - Speak another language Native:
64.0% (1,821)Foreign-born:
91.7% (3,237)
Foreign-born residents in Burnsville 9,470 residents are foreign born (4.6% Asia , 4.4% Latin America , 4.3% Africa ).
This city:
14.6%Minnesota:
8.5%
Marital status for residents in Burnsville Marital status - White (Caucasian) population 15 years and over
Males 31.7% Never married57.2% Now married0.6% Separated2.1% Widowed8.5% DivorcedFemales 25.2% Never married53.3% Now married0.4% Separated8.6% Widowed12.5% DivorcedWomen who gave birth in the past 12 months Now married:
76.8% (398)Unmarried:
23.2% (120)
Women who did not give birth in the past 12 months Now married:
46.5% (3,750)Unmarried:
53.5% (4,320)
Marital status - Black or African American population 15 years and over
Males 51.9% Never married37.0% Now married1.0% Separated2.9% Widowed7.2% DivorcedFemales 45.1% Never married34.3% Now married2.4% Separated1.9% Widowed16.3% DivorcedWomen who gave birth in the past 12 months Now married:
61.9% (264)Unmarried:
38.1% (162)
Women who did not give birth in the past 12 months Now married:
33.7% (871)Unmarried:
66.3% (1,710)
Marital status - American Indian / Alaska Native population 15 years and over
Males 18.2% Never married52.7% Now married0.0% Separated0.0% Widowed29.1% DivorcedFemales 50.0% Never married50.0% Now married0.0% Separated0.0% Widowed0.0% DivorcedWomen who did not give birth in the past 12 months Now married:
42.4% (29)Unmarried:
57.6% (40)
Marital status - Asian population 15 years and over
Males 37.3% Never married47.0% Now married1.6% Separated2.2% Widowed11.9% DivorcedFemales 27.4% Never married44.7% Now married1.5% Separated5.6% Widowed20.8% DivorcedWomen who gave birth in the past 12 months Now married:
87.8% (35)Unmarried:
12.2% (5)
Women who did not give birth in the past 12 months Now married:
37.6% (355)Unmarried:
62.4% (589)
Marital status - Other race population 15 years and over
Males 55.9% Never married44.1% Now married0.0% Separated0.0% Widowed0.0% DivorcedFemales 52.3% Never married35.0% Now married1.2% Separated6.5% Widowed4.9% DivorcedWomen who gave birth in the past 12 months Now married:
100.0% (97)Unmarried:
0.0% (0)
Women who did not give birth in the past 12 months Now married:
30.0% (375)Unmarried:
70.0% (876)
Marital status - Two or more races population 15 years and over
Males 55.9% Never married29.5% Now married1.3% Separated0.0% Widowed13.3% DivorcedFemales 40.8% Never married35.0% Now married1.5% Separated1.4% Widowed21.3% DivorcedWomen who gave birth in the past 12 months Now married:
22.1% (42)Unmarried:
77.9% (149)
Women who did not give birth in the past 12 months Now married:
41.4% (481)Unmarried:
58.6% (682)
Marital status - White alone, not Hispanic / Latino population 15 years and over
Males 30.8% Never married58.0% Now married0.6% Separated2.1% Widowed8.5% DivorcedFemales 23.9% Never married54.4% Now married0.4% Separated8.6% Widowed12.8% DivorcedWomen who gave birth in the past 12 months Now married:
86.3% (381)Unmarried:
13.7% (61)
Women who did not give birth in the past 12 months Now married:
46.9% (3,692)Unmarried:
53.1% (4,179)
Marital status - Hispanic or Latino population 15 years and over
Males 55.2% Never married37.5% Now married0.7% Separated0.0% Widowed6.6% DivorcedFemales 49.1% Never married33.2% Now married1.5% Separated5.8% Widowed10.4% DivorcedWomen who gave birth in the past 12 months Now married:
64.9% (126)Unmarried:
35.1% (68)
Women who did not give birth in the past 12 months Now married:
34.9% (615)Unmarried:
65.1% (1,145)
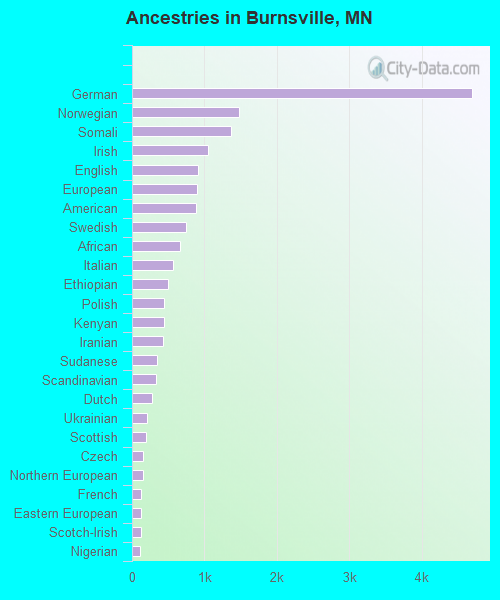
Ancestries in Burnsville
4,694 15.5% German1,478 4.9% Norwegian1,363 4.5% Somali1,043 3.5% Irish916 3.0% English901 3.0% European884 2.9% American748 2.5% Swedish662 2.2% African561 1.9% Italian500 1.7% Ethiopian440 1.5% Polish440 1.5% Kenyan433 1.4% Iranian348 1.2% Sudanese334 1.1% Scandinavian278 0.9% Dutch212 0.7% Ukrainian192 0.6% Scottish158 0.5% Czech152 0.5% Northern European126 0.4% French121 0.4% Eastern European119 0.4% Scotch-Irish113 0.4% Nigerian78 0.3% Russian78 0.3% Finnish75 0.2% French Canadian71 0.2% Iraqi70 0.2% Jamaican47 0.2% Slovak45 0.1% Danish43 0.1% British37 0.1% Egyptian35 0.1% Turkish33 0.1% Hungarian30 0.10% Lebanese29 0.10% Romanian26 0.09% Swiss20 0.07% Brazilian18 0.06% Canadian18 0.06% Bahamian16 0.05% Yugoslavian15 0.05% Slovene13 0.04% Liberian13 0.04% Basque13 0.04% Austrian11 0.04% Lithuanian10 0.03% Afghan9 0.03% Czechoslovakian7 0.02% Ghanaian7 0.02% Greek7 0.02% Syrian6 0.02% Slavic6 0.02% Moroccan6 0.02% Icelander6 0.02% Palestinian5 0.02% Welsh4 0.01% West Indian
Geographical mobility in Burnsville Same house 1 year ago 35,998 87.1% White (Caucasian)7,821 76.8% Black or African American141 78.5% American Indian / Alaska Native3,292 85.3% Asian3,310 86.4% Other race4,194 75.1% Two or more races35,426 88.0% White alone, not Hispanic / Latino4,921 73.2% Hispanic or LatinoMoved within same county 2,049 5.0% White / Caucasian744 7.3% Black or African American12 6.8% American Indian / Alaska Native164 4.2% Asian80 2.1% Other race382 6.8% Two or more races1,866 4.6% White alone, not Hispanic / Latino367 5.5% Hispanic or LatinoMoved within same state 2,615 6.3% White / Caucasian1,240 12.2% Black or African American27 15.1% American Indian / Alaska Native206 5.3% Asian344 9.0% Other race483 8.7% Two or more races2,363 5.9% White alone, not Hispanic / Latino881 13.1% Hispanic or LatinoMoved from different state 530 1.3% White / Caucasian48 1.3% Asian84 2.2% Other race146 2.6% Two or more races546 1.4% White alone, not Hispanic / Latino127 1.9% Hispanic or LatinoMoved from abroad 80 0.2% White206 2.0% Black or African American18 0.5% Asian32 0.8% Other race302 5.4% Two or more races38 0.1% White alone, not Hispanic / Latino447 6.6% Hispanic or Latino
Children Nativity (place of birth) in Burnsville
Children under 6 years - Living with two parents Both parents native 2,143 100.0% NativeBoth parents foreign-born 980 99.4% Native6 0.6% Foreign-bornOne native, one foreign-born parent 375 100.0% NativeChildren under 6 years - Living with one parent Native parent 830 100.0% NativeForeign-born parent 350 100.0% NativeChildren 6 to 17 years - Living with two parents Both parents native 4,027 100.0% NativeBoth parents foreign-born 1,333 89.8% Native152 10.2% Foreign-bornOne native, one foreign-born parent 778 91.5% Native72 8.5% Foreign-bornChildren 6 to 17 years - Living with one parent Native parent 795 100.0% NativeForeign-born parent 1,058 52.3% Native964 47.7% Foreign-born
Grandparents responsible for own grandchildren in Burnsville
Grandparents (30 to 59 years) White / Caucasian 5 2.7% Responsible for grandchildren178 97.3% Not responsible for grandchildrenBlack or African American 28 31.7% Responsible for grandchildren61 68.3% Not responsible for grandchildrenAsian 6 11.1% Responsible for grandchildren50 88.9% Not responsible for grandchildrenOther race 20 100.0% Not responsible for grandchildrenTwo or more races 4 100.0% Not responsible for grandchildrenWhite alone, not Hispanic / Latino 5 2.6% Responsible for grandchildren191 97.4% Not responsible for grandchildrenHispanic or Latino 17 100.0% Not responsible for grandchildrenGrandparents (60 years and over) White / Caucasian 169 47.2% Responsible for grandchildren189 52.8% Not responsible for grandchildrenBlack or African American 6 100.0% Responsible for grandchildrenAsian 12 5.7% Responsible for grandchildren198 94.3% Not responsible for grandchildrenWhite alone, not Hispanic / Latino 169 46.5% Responsible for grandchildren195 53.5% Not responsible for grandchildren