Races in Brownsville, Tennessee (TN) Detailed Stats
Data:
Races - White alone (%)
Races - White alone (% change since 2000)
Races - Black alone (%)
Races - Black alone (% change since 2000)
Races - American Indian alone (%)
Races - American Indian alone (% change since 2000)
Races - Asian alone (%)
Races - Asian alone (% change since 2000)
Races - Hispanic (%)
Races - Hispanic (% change since 2000)
Races - Native Hawaiian and Other Pacific Islander alone (%)
Races - Native Hawaiian and Other Pacific Islander alone (% change since 2000)
Races - Two or more races(%)
Races - Two or more races(% change since 2000)
Races - Other race alone (%)
Races - Other race alone (% change since 2000)
Racial diversity
Place of birth - Born in state of residence (%)
Place of birth - Born in state of residence (%) - White
Place of birth - Born in state of residence (%) - Black or African American
Place of birth - Born in state of residence (%) - Asian
Place of birth - Born in state of residence (%) - Hispanic or Latino
Place of birth - Born in state of residence (%) - American Indian and Alaska Native
Place of birth - Born in state of residence (%) - Multirace
Place of birth - Born in state of residence (%) - Other Race
Place of birth - Born in other state (%)
Place of birth - Born in other state (%) - White
Place of birth - Born in other state (%) - Black or African American
Place of birth - Born in other state (%) - Asian
Place of birth - Born in other state (%) - Hispanic or Latino
Place of birth - Born in other state (%) - American Indian and Alaska Native
Place of birth - Born in other state (%) - Multirace
Place of birth - Born in other state (%) - Other Race
Place of birth - Native, outside of US (%)
Place of birth - Native, outside of US (%) - White
Place of birth - Native, outside of US (%) - Black or African American
Place of birth - Native, outside of US (%) - Asian
Place of birth - Native, outside of US (%) - Hispanic or Latino
Place of birth - Native, outside of US (%) - American Indian and Alaska Native
Place of birth - Native, outside of US (%) - Multirace
Place of birth - Native, outside of US (%) - Other Race
Place of birth - Foreign born (%)
Place of birth - Foreign born (%) - White
Place of birth - Foreign born (%) - Black or African American
Place of birth - Foreign born (%) - Asian
Place of birth - Foreign born (%) - Hispanic or Latino
Place of birth - Foreign born (%) - American Indian and Alaska Native
Place of birth - Foreign born (%) - Multirace
Place of birth - Foreign born (%) - Other Race
Residents speaking English at home (%)
Residents speaking English at home - Born in the United States (%)
Residents speaking English at home - Native, born elsewhere (%)
Residents speaking English at home - Foreign born (%)
Residents speaking Spanish at home (%)
Residents speaking Spanish at home - Born in the United States (%)
Residents speaking Spanish at home - Native, born elsewhere (%)
Residents speaking Spanish at home - Foreign born (%)
Residents speaking other language at home (%)
Residents speaking other language at home - Born in the United States (%)
Residents speaking other language at home - Native, born elsewhere (%)
Residents speaking other language at home - Foreign born (%)
Marital status - Never married (%)
Marital status - Now married (%)
Marital status - Separated (%)
Marital status - Widowed (%)
Marital status - Divorced (%)
Ancestries Reported - Arab (%)
Ancestries Reported - Czech (%)
Ancestries Reported - Danish (%)
Ancestries Reported - Dutch (%)
Ancestries Reported - English (%)
Ancestries Reported - French (%)
Ancestries Reported - French Canadian (%)
Ancestries Reported - German (%)
Ancestries Reported - Greek (%)
Ancestries Reported - Hungarian (%)
Ancestries Reported - Irish (%)
Ancestries Reported - Italian (%)
Ancestries Reported - Lithuanian (%)
Ancestries Reported - Norwegian (%)
Ancestries Reported - Polish (%)
Ancestries Reported - Portuguese (%)
Ancestries Reported - Russian (%)
Ancestries Reported - Scotch-Irish (%)
Ancestries Reported - Scottish (%)
Ancestries Reported - Slovak (%)
Ancestries Reported - Subsaharan African (%)
Ancestries Reported - Swedish (%)
Ancestries Reported - Swiss (%)
Ancestries Reported - Ukrainian (%)
Ancestries Reported - United States (%)
Ancestries Reported - Welsh (%)
Ancestries Reported - West Indian (%)
Ancestries Reported - Other (%)
Geographical mobility - Same house 1 year ago (%)
Geographical mobility - Same house 1 year ago (%) - White
Geographical mobility - Same house 1 year ago (%) - Black or African American
Geographical mobility - Same house 1 year ago (%) - Asian
Geographical mobility - Same house 1 year ago (%) - Hispanic or Latino
Geographical mobility - Same house 1 year ago (%) - American Indian and Alaska Native
Geographical mobility - Same house 1 year ago (%) - Multirace
Geographical mobility - Same house 1 year ago (%) - Other Race
Geographical mobility - Moved within same county (%)
Geographical mobility - Moved within same county (%) - White
Geographical mobility - Moved within same county (%) - Black or African American
Geographical mobility - Moved within same county (%) - Asian
Geographical mobility - Moved within same county (%) - Hispanic or Latino
Geographical mobility - Moved within same county (%) - American Indian and Alaska Native
Geographical mobility - Moved within same county (%) - Multirace
Geographical mobility - Moved within same county (%) - Other Race
Geographical mobility - Moved from different county within same state (%)
Geographical mobility - Moved from different county within same state (%) - White
Geographical mobility - Moved from different county within same state (%) - Black or African American
Geographical mobility - Moved from different county within same state (%) - Asian
Geographical mobility - Moved from different county within same state (%) - Hispanic or Latino
Geographical mobility - Moved from different county within same state (%) - American Indian and Alaska Native
Geographical mobility - Moved from different county within same state (%) - Multirace
Geographical mobility - Moved from different county within same state (%) - Other Race
Geographical mobility - Moved from different state (%)
Geographical mobility - Moved from different state (%) - White
Geographical mobility - Moved from different state (%) - Black or African American
Geographical mobility - Moved from different state (%) - Asian
Geographical mobility - Moved from different state (%) - Hispanic or Latino
Geographical mobility - Moved from different state (%) - American Indian and Alaska Native
Geographical mobility - Moved from different state (%) - Multirace
Geographical mobility - Moved from different state (%) - Other Race
Geographical mobility - Moved from abroad (%)
Geographical mobility - Moved from abroad (%) - White
Geographical mobility - Moved from abroad (%) - Black or African American
Geographical mobility - Moved from abroad (%) - Asian
Geographical mobility - Moved from abroad (%) - Hispanic or Latino
Geographical mobility - Moved from abroad (%) - American Indian and Alaska Native
Geographical mobility - Moved from abroad (%) - Multirace
Geographical mobility - Moved from abroad (%) - Other Race
Place of birth for the foreign-born population - Ireland (%)
Place of birth for the foreign-born population - Denmark (%)
Place of birth for the foreign-born population - Norway (%)
Place of birth for the foreign-born population - Sweden (%)
Place of birth for the foreign-born population - United Kingdom (%)
Place of birth for the foreign-born population - England (%)
Place of birth for the foreign-born population - Scotland (%)
Place of birth for the foreign-born population - Other Northern Europe (%)
Place of birth for the foreign-born population - Austria (%)
Place of birth for the foreign-born population - Belgium (%)
Place of birth for the foreign-born population - France (%)
Place of birth for the foreign-born population - Germany (%)
Place of birth for the foreign-born population - Netherlands (%)
Place of birth for the foreign-born population - Switzerland (%)
Place of birth for the foreign-born population - Other Western Europe (%)
Place of birth for the foreign-born population - Greece (%)
Place of birth for the foreign-born population - Italy (%)
Place of birth for the foreign-born population - Portugal (%)
Place of birth for the foreign-born population - Spain (%)
Place of birth for the foreign-born population - Other Southern Europe (%)
Place of birth for the foreign-born population - Albania (%)
Place of birth for the foreign-born population - Belarus (%)
Place of birth for the foreign-born population - Bosnia and Herzegovina (%)
Place of birth for the foreign-born population - Bulgaria (%)
Place of birth for the foreign-born population - Croatia (%)
Place of birth for the foreign-born population - Czechoslovakia (%)
Place of birth for the foreign-born population - Hungary (%)
Place of birth for the foreign-born population - Latvia (%)
Place of birth for the foreign-born population - Lithuania (%)
Place of birth for the foreign-born population - North Macedonia (Macedonia) (%)
Place of birth for the foreign-born population - Moldova (%)
Place of birth for the foreign-born population - Poland (%)
Place of birth for the foreign-born population - Romania (%)
Place of birth for the foreign-born population - Russia (%)
Place of birth for the foreign-born population - Serbia (%)
Place of birth for the foreign-born population - Ukraine (%)
Place of birth for the foreign-born population - Other Eastern Europe (%)
Place of birth for the foreign-born population - China (%)
Place of birth for the foreign-born population - Hong Kong (%)
Place of birth for the foreign-born population - Taiwan (%)
Place of birth for the foreign-born population - Japan (%)
Place of birth for the foreign-born population - Korea (%)
Place of birth for the foreign-born population - Other Eastern Asia (%)
Place of birth for the foreign-born population - Afghanistan (%)
Place of birth for the foreign-born population - Bangladesh (%)
Place of birth for the foreign-born population - India (%)
Place of birth for the foreign-born population - Iran (%)
Place of birth for the foreign-born population - Kazakhstan (%)
Place of birth for the foreign-born population - Nepal (%)
Place of birth for the foreign-born population - Pakistan (%)
Place of birth for the foreign-born population - Sri Lanka (%)
Place of birth for the foreign-born population - Uzbekistan (%)
Place of birth for the foreign-born population - Other South Central Asia (%)
Place of birth for the foreign-born population - Burma (%)
Place of birth for the foreign-born population - Cambodia (%)
Place of birth for the foreign-born population - Indonesia (%)
Place of birth for the foreign-born population - Laos (%)
Place of birth for the foreign-born population - Malaysia (%)
Place of birth for the foreign-born population - Philippines (%)
Place of birth for the foreign-born population - Singapore (%)
Place of birth for the foreign-born population - Thailand (%)
Place of birth for the foreign-born population - Vietnam (%)
Place of birth for the foreign-born population - Other South Eastern Asia (%)
Place of birth for the foreign-born population - Armenia (%)
Place of birth for the foreign-born population - Iraq (%)
Place of birth for the foreign-born population - Israel (%)
Place of birth for the foreign-born population - Jordan (%)
Place of birth for the foreign-born population - Kuwait (%)
Place of birth for the foreign-born population - Lebanon (%)
Place of birth for the foreign-born population - Saudi Arabia (%)
Place of birth for the foreign-born population - Syria (%)
Place of birth for the foreign-born population - Turkey (%)
Place of birth for the foreign-born population - Yemen (%)
Place of birth for the foreign-born population - Other Western Asia (%)
Place of birth for the foreign-born population - Eritrea (%)
Place of birth for the foreign-born population - Ethiopia (%)
Place of birth for the foreign-born population - Kenya (%)
Place of birth for the foreign-born population - Somalia (%)
Place of birth for the foreign-born population - Uganda (%)
Place of birth for the foreign-born population - Zimbabwe (%)
Place of birth for the foreign-born population - Other Eastern Africa (%)
Place of birth for the foreign-born population - Cameroon (%)
Place of birth for the foreign-born population - Congo (%)
Place of birth for the foreign-born population - Democratic Republic of Congo (Zaire) (%)
Place of birth for the foreign-born population - Other Middle Africa (%)
Place of birth for the foreign-born population - Egypt (%)
Place of birth for the foreign-born population - Morocco (%)
Place of birth for the foreign-born population - Sudan (%)
Place of birth for the foreign-born population - Other Northern Africa (%)
Place of birth for the foreign-born population - South Africa (%)
Place of birth for the foreign-born population - Other Southern Africa (%)
Place of birth for the foreign-born population - Cabo Verde (%)
Place of birth for the foreign-born population - Ghana (%)
Place of birth for the foreign-born population - Liberia (%)
Place of birth for the foreign-born population - Nigeria (%)
Place of birth for the foreign-born population - Senegal (%)
Place of birth for the foreign-born population - Sierra Leone (%)
Place of birth for the foreign-born population - Other Western Africa (%)
Place of birth for the foreign-born population - Australia (%)
Place of birth for the foreign-born population - New Zealand (%)
Place of birth for the foreign-born population - Fiji (%)
Place of birth for the foreign-born population - Micronesia (%)
Place of birth for the foreign-born population - Bahamas (%)
Place of birth for the foreign-born population - Barbados (%)
Place of birth for the foreign-born population - Cuba (%)
Place of birth for the foreign-born population - Dominica (%)
Place of birth for the foreign-born population - Dominican Republic (%)
Place of birth for the foreign-born population - Grenada (%)
Place of birth for the foreign-born population - Haiti (%)
Place of birth for the foreign-born population - Jamaica (%)
Place of birth for the foreign-born population - St. Vincent and the Grenadines (%)
Place of birth for the foreign-born population - Trinidad and Tobago (%)
Place of birth for the foreign-born population - West Indies (%)
Place of birth for the foreign-born population - Other Caribbean (%)
Place of birth for the foreign-born population - Belize (%)
Place of birth for the foreign-born population - Costa Rica (%)
Place of birth for the foreign-born population - El Salvador (%)
Place of birth for the foreign-born population - Guatemala (%)
Place of birth for the foreign-born population - Honduras (%)
Place of birth for the foreign-born population - Mexico (%)
Place of birth for the foreign-born population - Nicaragua (%)
Place of birth for the foreign-born population - Panama (%)
Place of birth for the foreign-born population - Other Central America (%)
Place of birth for the foreign-born population - Argentina (%)
Place of birth for the foreign-born population - Bolivia (%)
Place of birth for the foreign-born population - Brazil (%)
Place of birth for the foreign-born population - Chile (%)
Place of birth for the foreign-born population - Colombia (%)
Place of birth for the foreign-born population - Ecuador (%)
Place of birth for the foreign-born population - Guyana (%)
Place of birth for the foreign-born population - Peru (%)
Place of birth for the foreign-born population - Uruguay (%)
Place of birth for the foreign-born population - Venezuela (%)
Place of birth for the foreign-born population - Other South America (%)
Place of birth for the foreign-born population - Canada (%)
Place of birth for the foreign-born population - Other Northern America (%)
Place of birth for the foreign-born population - Other (%)
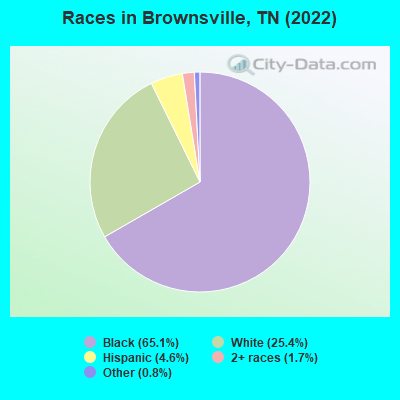
According to 2022 data, the most numerous races in Brownsville, TN are White alone (2,515 residents), Black alone (6,458 residents), and Hispanic (458 residents). 95.8% of Brownsville residents speak English at home. 2.8% of Brownsville, TN residents are foreign-born (1.7% born in Latin America, 0.6% born in Asia, 0.3% born in Europe), which is 81.6% less than the foreign-born rate of 5.0% across the entire state of Tennessee.
Race distribution in Brownsville
2000 2022
4,505,930 79.2% White alone 928,204 16.3% Black alone 123,838 2.2% Hispanic 54,824 1.0% Two or more races 56,077 1.0% Asian alone 13,820 0.2% American Indian alone 4,780 0.08% Other race alone 1,810 0.03% Native Hawaiian and Other
5,070,026 71.9% White alone 1,089,738 15.5% Black alone 442,629 6.3% Hispanic 279,381 4.0% Two or more races 131,817 1.9% Asian alone 26,972 0.4% Other race alone 6,387 0.09% American Indian alone 4,389 0.06% Native Hawaiian and Other
Income and house value in Brownsville Median household income in 2022 $62,265 White non-Hispanic householders$30,273 Black householders$43,382 Hispanic or Latino race householdersMedian 2022 house value $171,894 White Non-Hispanic householders$108,977 Black or African American householders$57,232 American Indian or Alaska Native householders$172,678 Some other race householders$147,002 Two or more races householders$150,334 Hispanic or Latino householders
Median age by race in Brownsville
52.8 Median age for White residents49.3 55.0 37.3 Median age for Black or African American residents35.4 39.6 -681,948,423.4 Median age for American Indian / Alaska Native residents-633,911,367.4 -801,477,376.9 -685,288,639.9 Median age for Asian residents-662,846,226.7 -686,648,500.7 -885,813,147.9 Median age for Native Hawaiian / Pacific Islander residents-951,707,890.7 -735,930,735.2 34.9 Median age for Other race residents32.8 38.0 10.0 Median age for Two or more races residents9.3 46.9 52.5 Median age for White alone residents49.1 55.1 33.6 Median age for Hispanic or Latino residents33.6 33.3
Owner/renter occupied households by race in Brownsville
House owners and renters - White residents 601 57.7% Owner occupied440 42.3% Renter occupiedHouse owners and renters - Black or African American residents 1,163 42.1% Owner occupied1,602 57.9% Renter occupiedHouse owners and renters - Other race residents 60 39.6% Owner occupied91 60.4% Renter occupiedHouse owners and renters - Two or more races residents 10 10.9% Owner occupied78 89.1% Renter occupiedHouse owners and renters - White alone residents 586 57.4% Owner occupied435 42.6% Renter occupiedHouse owners and renters - Hispanic or Latino residents 68 41.6% Owner occupied95 58.4% Renter occupied
Language usage in Brownsville
English speakers - Total 95.8% of residents of Brownsville speak English at home.
3.1% of residents speak Spanish at home 122 42.1% Speak English very well168 57.9% Speak English less than very well0.9% of residents speak other language at home 9 10.8% Speak English very well74 89.2% Speak English less than very well
English speakers - Born in the United States 94.8% of residents of Brownsville speak English at home.
4.2% of residents speak Spanish at home 39 76.5% Speak English very well12 23.5% Speak English less than very well0.8% of residents speak other language at home 10 100.0% Speak English very well
English speakers - Native, born elsewhere 48.1% of residents of Brownsville speak English at home.
55.6% of residents speak Spanish at home 30 100.0% Speak English less than very well
English speakers - Foreign-born 15.4% of residents of Brownsville speak English at home.
61.9% of residents speak Spanish at home 40 23.7% Speak English very well129 76.3% Speak English less than very well22.3% of residents speak other language at home 61 100.0% Speak English less than very well
White (Caucasian) - Speak only English Native:
99.2% (2,343)Foreign-born:
31.9% (27)
White (Caucasian) - Speak another language Native:
1.0% (23)Foreign-born:
67.1% (57)
Other race - Speak only English Native:
56.2% (155)Foreign-born:
6.0% (9)
Other race - Speak another language Native:
44.6% (123)Foreign-born:
94.2% (144)
White alone - Speak only English Native:
98.7% (2,305)Foreign-born:
31.5% (29)
White alone - Speak another language Native:
1.3% (31)Foreign-born:
69.0% (64)
Hispanic or Latino - Speak only English Native:
59.2% (150)Foreign-born:
6.4% (12)
Hispanic or Latino - Speak another language Native:
41.3% (105)Foreign-born:
93.7% (170)
Foreign-born residents in Brownsville 273 residents are foreign born (1.7% Latin America , 0.6% Asia , 0.3% Europe ).
This city:
2.8%Tennessee:
5.4%
Marital status for residents in Brownsville Marital status - White (Caucasian) population 15 years and over
Males 30.1% Never married47.0% Now married2.0% Separated5.5% Widowed15.3% DivorcedFemales 24.9% Never married38.5% Now married5.5% Separated15.0% Widowed16.2% DivorcedWomen who gave birth in the past 12 months Now married:
80.0% (24)Unmarried:
20.0% (6)
Women who did not give birth in the past 12 months Now married:
45.2% (178)Unmarried:
54.8% (216)
Marital status - Black or African American population 15 years and over
Males 42.8% Never married28.3% Now married4.9% Separated6.0% Widowed18.0% DivorcedFemales 46.0% Never married21.1% Now married3.7% Separated11.4% Widowed17.8% DivorcedWomen who gave birth in the past 12 months Now married:
38.0% (29)Unmarried:
62.0% (48)
Women who did not give birth in the past 12 months Now married:
22.7% (340)Unmarried:
77.3% (1,158)
Marital status - Other race population 15 years and over
Males 20.6% Never married68.1% Now married0.0% Separated0.0% Widowed11.3% DivorcedFemales 42.3% Never married46.0% Now married4.3% Separated0.0% Widowed7.4% DivorcedWomen who did not give birth in the past 12 months Now married:
53.4% (94)Unmarried:
46.6% (82)
Marital status - Two or more races population 15 years and over
Males 57.1% Never married0.0% Now married0.0% Separated0.0% Widowed42.9% DivorcedFemales 0.0% Never married15.8% Now married40.4% Separated0.0% Widowed43.9% DivorcedWomen who did not give birth in the past 12 months Now married:
0.0% (0)Unmarried:
100.0% (25)
Marital status - White alone, not Hispanic / Latino population 15 years and over
Males 28.8% Never married48.8% Now married2.1% Separated5.8% Widowed14.4% DivorcedFemales 24.4% Never married38.5% Now married5.5% Separated15.2% Widowed16.4% DivorcedWomen who gave birth in the past 12 months Now married:
80.0% (24)Unmarried:
20.0% (6)
Women who did not give birth in the past 12 months Now married:
45.7% (176)Unmarried:
54.3% (209)
Marital status - Hispanic or Latino population 15 years and over
Males 28.5% Never married55.0% Now married0.0% Separated0.0% Widowed16.5% DivorcedFemales 33.1% Never married58.9% Now married0.0% Separated0.0% Widowed7.9% DivorcedWomen who did not give birth in the past 12 months Now married:
60.6% (86)Unmarried:
39.4% (56)
Ancestries in Brownsville
278 3.9% English237 3.3% American101 1.4% German93 1.3% Scottish59 0.8% African39 0.5% Irish35 0.5% Scotch-Irish31 0.4% Dutch10 0.1% Canadian8 0.1% Swedish6 0.08% Polish4 0.06% Italian3 0.04% British1 0.01% French
Children Nativity (place of birth) in Brownsville
Children under 6 years - Living with two parents Both parents native 266 100.0% NativeOne native, one foreign-born parent 11 100.0% NativeChildren under 6 years - Living with one parent Native parent 362 100.0% NativeChildren 6 to 17 years - Living with two parents Both parents native 261 100.0% NativeBoth parents foreign-born 24 58.2% Native17 41.8% Foreign-bornOne native, one foreign-born parent 43 100.0% NativeChildren 6 to 17 years - Living with one parent Native parent 1,204 100.0% Native
Place of birth for residents in Brownsville 177 Americas177 Latin America177 Central America64 Asia64 Western Asia31 Europe31 Northern Europe
Grandparents responsible for own grandchildren in Brownsville
Grandparents (30 to 59 years) White / Caucasian 6 22.2% Responsible for grandchildren21 77.8% Not responsible for grandchildrenBlack or African American 61 70.7% Responsible for grandchildren25 29.3% Not responsible for grandchildrenWhite alone, not Hispanic / Latino 6 21.8% Responsible for grandchildren22 78.2% Not responsible for grandchildrenGrandparents (60 years and over) White / Caucasian 20 84.7% Responsible for grandchildren4 15.3% Not responsible for grandchildrenBlack or African American 13 11.0% Responsible for grandchildren103 89.0% Not responsible for grandchildrenWhite alone, not Hispanic / Latino 20 84.7% Responsible for grandchildren4 15.3% Not responsible for grandchildren