Races in Broadview Park, Florida (FL) Detailed Stats
Data:
Races - White alone (%)
Races - White alone (% change since 2000)
Races - Black alone (%)
Races - Black alone (% change since 2000)
Races - American Indian alone (%)
Races - American Indian alone (% change since 2000)
Races - Asian alone (%)
Races - Asian alone (% change since 2000)
Races - Hispanic (%)
Races - Hispanic (% change since 2000)
Races - Native Hawaiian and Other Pacific Islander alone (%)
Races - Native Hawaiian and Other Pacific Islander alone (% change since 2000)
Races - Two or more races(%)
Races - Two or more races(% change since 2000)
Races - Other race alone (%)
Races - Other race alone (% change since 2000)
Racial diversity
Place of birth - Born in state of residence (%)
Place of birth - Born in state of residence (%) - White
Place of birth - Born in state of residence (%) - Black or African American
Place of birth - Born in state of residence (%) - Asian
Place of birth - Born in state of residence (%) - Hispanic or Latino
Place of birth - Born in state of residence (%) - American Indian and Alaska Native
Place of birth - Born in state of residence (%) - Multirace
Place of birth - Born in state of residence (%) - Other Race
Place of birth - Born in other state (%)
Place of birth - Born in other state (%) - White
Place of birth - Born in other state (%) - Black or African American
Place of birth - Born in other state (%) - Asian
Place of birth - Born in other state (%) - Hispanic or Latino
Place of birth - Born in other state (%) - American Indian and Alaska Native
Place of birth - Born in other state (%) - Multirace
Place of birth - Born in other state (%) - Other Race
Place of birth - Native, outside of US (%)
Place of birth - Native, outside of US (%) - White
Place of birth - Native, outside of US (%) - Black or African American
Place of birth - Native, outside of US (%) - Asian
Place of birth - Native, outside of US (%) - Hispanic or Latino
Place of birth - Native, outside of US (%) - American Indian and Alaska Native
Place of birth - Native, outside of US (%) - Multirace
Place of birth - Native, outside of US (%) - Other Race
Place of birth - Foreign born (%)
Place of birth - Foreign born (%) - White
Place of birth - Foreign born (%) - Black or African American
Place of birth - Foreign born (%) - Asian
Place of birth - Foreign born (%) - Hispanic or Latino
Place of birth - Foreign born (%) - American Indian and Alaska Native
Place of birth - Foreign born (%) - Multirace
Place of birth - Foreign born (%) - Other Race
Residents speaking English at home (%)
Residents speaking English at home - Born in the United States (%)
Residents speaking English at home - Native, born elsewhere (%)
Residents speaking English at home - Foreign born (%)
Residents speaking Spanish at home (%)
Residents speaking Spanish at home - Born in the United States (%)
Residents speaking Spanish at home - Native, born elsewhere (%)
Residents speaking Spanish at home - Foreign born (%)
Residents speaking other language at home (%)
Residents speaking other language at home - Born in the United States (%)
Residents speaking other language at home - Native, born elsewhere (%)
Residents speaking other language at home - Foreign born (%)
Marital status - Never married (%)
Marital status - Now married (%)
Marital status - Separated (%)
Marital status - Widowed (%)
Marital status - Divorced (%)
Ancestries Reported - Arab (%)
Ancestries Reported - Czech (%)
Ancestries Reported - Danish (%)
Ancestries Reported - Dutch (%)
Ancestries Reported - English (%)
Ancestries Reported - French (%)
Ancestries Reported - French Canadian (%)
Ancestries Reported - German (%)
Ancestries Reported - Greek (%)
Ancestries Reported - Hungarian (%)
Ancestries Reported - Irish (%)
Ancestries Reported - Italian (%)
Ancestries Reported - Lithuanian (%)
Ancestries Reported - Norwegian (%)
Ancestries Reported - Polish (%)
Ancestries Reported - Portuguese (%)
Ancestries Reported - Russian (%)
Ancestries Reported - Scotch-Irish (%)
Ancestries Reported - Scottish (%)
Ancestries Reported - Slovak (%)
Ancestries Reported - Subsaharan African (%)
Ancestries Reported - Swedish (%)
Ancestries Reported - Swiss (%)
Ancestries Reported - Ukrainian (%)
Ancestries Reported - United States (%)
Ancestries Reported - Welsh (%)
Ancestries Reported - West Indian (%)
Ancestries Reported - Other (%)
Geographical mobility - Same house 1 year ago (%)
Geographical mobility - Same house 1 year ago (%) - White
Geographical mobility - Same house 1 year ago (%) - Black or African American
Geographical mobility - Same house 1 year ago (%) - Asian
Geographical mobility - Same house 1 year ago (%) - Hispanic or Latino
Geographical mobility - Same house 1 year ago (%) - American Indian and Alaska Native
Geographical mobility - Same house 1 year ago (%) - Multirace
Geographical mobility - Same house 1 year ago (%) - Other Race
Geographical mobility - Moved within same county (%)
Geographical mobility - Moved within same county (%) - White
Geographical mobility - Moved within same county (%) - Black or African American
Geographical mobility - Moved within same county (%) - Asian
Geographical mobility - Moved within same county (%) - Hispanic or Latino
Geographical mobility - Moved within same county (%) - American Indian and Alaska Native
Geographical mobility - Moved within same county (%) - Multirace
Geographical mobility - Moved within same county (%) - Other Race
Geographical mobility - Moved from different county within same state (%)
Geographical mobility - Moved from different county within same state (%) - White
Geographical mobility - Moved from different county within same state (%) - Black or African American
Geographical mobility - Moved from different county within same state (%) - Asian
Geographical mobility - Moved from different county within same state (%) - Hispanic or Latino
Geographical mobility - Moved from different county within same state (%) - American Indian and Alaska Native
Geographical mobility - Moved from different county within same state (%) - Multirace
Geographical mobility - Moved from different county within same state (%) - Other Race
Geographical mobility - Moved from different state (%)
Geographical mobility - Moved from different state (%) - White
Geographical mobility - Moved from different state (%) - Black or African American
Geographical mobility - Moved from different state (%) - Asian
Geographical mobility - Moved from different state (%) - Hispanic or Latino
Geographical mobility - Moved from different state (%) - American Indian and Alaska Native
Geographical mobility - Moved from different state (%) - Multirace
Geographical mobility - Moved from different state (%) - Other Race
Geographical mobility - Moved from abroad (%)
Geographical mobility - Moved from abroad (%) - White
Geographical mobility - Moved from abroad (%) - Black or African American
Geographical mobility - Moved from abroad (%) - Asian
Geographical mobility - Moved from abroad (%) - Hispanic or Latino
Geographical mobility - Moved from abroad (%) - American Indian and Alaska Native
Geographical mobility - Moved from abroad (%) - Multirace
Geographical mobility - Moved from abroad (%) - Other Race
Place of birth for the foreign-born population - Ireland (%)
Place of birth for the foreign-born population - Denmark (%)
Place of birth for the foreign-born population - Norway (%)
Place of birth for the foreign-born population - Sweden (%)
Place of birth for the foreign-born population - United Kingdom (%)
Place of birth for the foreign-born population - England (%)
Place of birth for the foreign-born population - Scotland (%)
Place of birth for the foreign-born population - Other Northern Europe (%)
Place of birth for the foreign-born population - Austria (%)
Place of birth for the foreign-born population - Belgium (%)
Place of birth for the foreign-born population - France (%)
Place of birth for the foreign-born population - Germany (%)
Place of birth for the foreign-born population - Netherlands (%)
Place of birth for the foreign-born population - Switzerland (%)
Place of birth for the foreign-born population - Other Western Europe (%)
Place of birth for the foreign-born population - Greece (%)
Place of birth for the foreign-born population - Italy (%)
Place of birth for the foreign-born population - Portugal (%)
Place of birth for the foreign-born population - Spain (%)
Place of birth for the foreign-born population - Other Southern Europe (%)
Place of birth for the foreign-born population - Albania (%)
Place of birth for the foreign-born population - Belarus (%)
Place of birth for the foreign-born population - Bosnia and Herzegovina (%)
Place of birth for the foreign-born population - Bulgaria (%)
Place of birth for the foreign-born population - Croatia (%)
Place of birth for the foreign-born population - Czechoslovakia (%)
Place of birth for the foreign-born population - Hungary (%)
Place of birth for the foreign-born population - Latvia (%)
Place of birth for the foreign-born population - Lithuania (%)
Place of birth for the foreign-born population - North Macedonia (Macedonia) (%)
Place of birth for the foreign-born population - Moldova (%)
Place of birth for the foreign-born population - Poland (%)
Place of birth for the foreign-born population - Romania (%)
Place of birth for the foreign-born population - Russia (%)
Place of birth for the foreign-born population - Serbia (%)
Place of birth for the foreign-born population - Ukraine (%)
Place of birth for the foreign-born population - Other Eastern Europe (%)
Place of birth for the foreign-born population - China (%)
Place of birth for the foreign-born population - Hong Kong (%)
Place of birth for the foreign-born population - Taiwan (%)
Place of birth for the foreign-born population - Japan (%)
Place of birth for the foreign-born population - Korea (%)
Place of birth for the foreign-born population - Other Eastern Asia (%)
Place of birth for the foreign-born population - Afghanistan (%)
Place of birth for the foreign-born population - Bangladesh (%)
Place of birth for the foreign-born population - India (%)
Place of birth for the foreign-born population - Iran (%)
Place of birth for the foreign-born population - Kazakhstan (%)
Place of birth for the foreign-born population - Nepal (%)
Place of birth for the foreign-born population - Pakistan (%)
Place of birth for the foreign-born population - Sri Lanka (%)
Place of birth for the foreign-born population - Uzbekistan (%)
Place of birth for the foreign-born population - Other South Central Asia (%)
Place of birth for the foreign-born population - Burma (%)
Place of birth for the foreign-born population - Cambodia (%)
Place of birth for the foreign-born population - Indonesia (%)
Place of birth for the foreign-born population - Laos (%)
Place of birth for the foreign-born population - Malaysia (%)
Place of birth for the foreign-born population - Philippines (%)
Place of birth for the foreign-born population - Singapore (%)
Place of birth for the foreign-born population - Thailand (%)
Place of birth for the foreign-born population - Vietnam (%)
Place of birth for the foreign-born population - Other South Eastern Asia (%)
Place of birth for the foreign-born population - Armenia (%)
Place of birth for the foreign-born population - Iraq (%)
Place of birth for the foreign-born population - Israel (%)
Place of birth for the foreign-born population - Jordan (%)
Place of birth for the foreign-born population - Kuwait (%)
Place of birth for the foreign-born population - Lebanon (%)
Place of birth for the foreign-born population - Saudi Arabia (%)
Place of birth for the foreign-born population - Syria (%)
Place of birth for the foreign-born population - Turkey (%)
Place of birth for the foreign-born population - Yemen (%)
Place of birth for the foreign-born population - Other Western Asia (%)
Place of birth for the foreign-born population - Eritrea (%)
Place of birth for the foreign-born population - Ethiopia (%)
Place of birth for the foreign-born population - Kenya (%)
Place of birth for the foreign-born population - Somalia (%)
Place of birth for the foreign-born population - Uganda (%)
Place of birth for the foreign-born population - Zimbabwe (%)
Place of birth for the foreign-born population - Other Eastern Africa (%)
Place of birth for the foreign-born population - Cameroon (%)
Place of birth for the foreign-born population - Congo (%)
Place of birth for the foreign-born population - Democratic Republic of Congo (Zaire) (%)
Place of birth for the foreign-born population - Other Middle Africa (%)
Place of birth for the foreign-born population - Egypt (%)
Place of birth for the foreign-born population - Morocco (%)
Place of birth for the foreign-born population - Sudan (%)
Place of birth for the foreign-born population - Other Northern Africa (%)
Place of birth for the foreign-born population - South Africa (%)
Place of birth for the foreign-born population - Other Southern Africa (%)
Place of birth for the foreign-born population - Cabo Verde (%)
Place of birth for the foreign-born population - Ghana (%)
Place of birth for the foreign-born population - Liberia (%)
Place of birth for the foreign-born population - Nigeria (%)
Place of birth for the foreign-born population - Senegal (%)
Place of birth for the foreign-born population - Sierra Leone (%)
Place of birth for the foreign-born population - Other Western Africa (%)
Place of birth for the foreign-born population - Australia (%)
Place of birth for the foreign-born population - New Zealand (%)
Place of birth for the foreign-born population - Fiji (%)
Place of birth for the foreign-born population - Micronesia (%)
Place of birth for the foreign-born population - Bahamas (%)
Place of birth for the foreign-born population - Barbados (%)
Place of birth for the foreign-born population - Cuba (%)
Place of birth for the foreign-born population - Dominica (%)
Place of birth for the foreign-born population - Dominican Republic (%)
Place of birth for the foreign-born population - Grenada (%)
Place of birth for the foreign-born population - Haiti (%)
Place of birth for the foreign-born population - Jamaica (%)
Place of birth for the foreign-born population - St. Vincent and the Grenadines (%)
Place of birth for the foreign-born population - Trinidad and Tobago (%)
Place of birth for the foreign-born population - West Indies (%)
Place of birth for the foreign-born population - Other Caribbean (%)
Place of birth for the foreign-born population - Belize (%)
Place of birth for the foreign-born population - Costa Rica (%)
Place of birth for the foreign-born population - El Salvador (%)
Place of birth for the foreign-born population - Guatemala (%)
Place of birth for the foreign-born population - Honduras (%)
Place of birth for the foreign-born population - Mexico (%)
Place of birth for the foreign-born population - Nicaragua (%)
Place of birth for the foreign-born population - Panama (%)
Place of birth for the foreign-born population - Other Central America (%)
Place of birth for the foreign-born population - Argentina (%)
Place of birth for the foreign-born population - Bolivia (%)
Place of birth for the foreign-born population - Brazil (%)
Place of birth for the foreign-born population - Chile (%)
Place of birth for the foreign-born population - Colombia (%)
Place of birth for the foreign-born population - Ecuador (%)
Place of birth for the foreign-born population - Guyana (%)
Place of birth for the foreign-born population - Peru (%)
Place of birth for the foreign-born population - Uruguay (%)
Place of birth for the foreign-born population - Venezuela (%)
Place of birth for the foreign-born population - Other South America (%)
Place of birth for the foreign-born population - Canada (%)
Place of birth for the foreign-born population - Other Northern America (%)
Place of birth for the foreign-born population - Other (%)
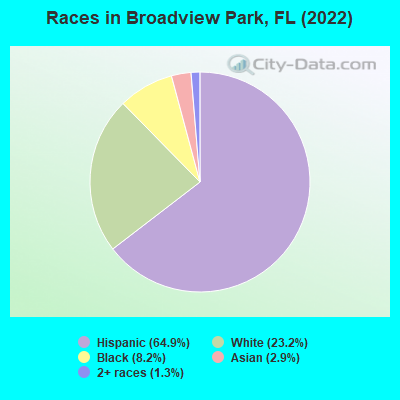
According to 2022 data, the most numerous races in Broadview Park, FL are White alone (1,720 residents), Hispanic (4,808 residents), and Black alone (611 residents). 36.0% of Broadview Park residents speak English at home. 49.4% of Broadview Park, FL residents are foreign-born (43.8% born in Latin America), which is 57.5% greater than the foreign-born rate of 21.0% across the entire state of Florida.
Race distribution in Broadview Park
2000 2022
10,458,509 65.4% White alone 2,682,715 16.8% Hispanic 2,264,268 14.2% Black alone 261,693 1.6% Asian alone 236,954 1.5% Two or more races 42,358 0.3% American Indian alone 28,994 0.2% Other race alone 6,887 0.04% Native Hawaiian and Other
11,309,403 50.8% White alone 6,025,039 27.1% Hispanic 3,241,015 14.6% Black alone 861,630 3.9% Two or more races 623,692 2.8% Asian alone 152,054 0.7% Other race alone 22,504 0.1% American Indian alone 9,486 0.04% Native Hawaiian and Other
Income and house value in Broadview Park Median household income in 2022 $55,846 White non-Hispanic householders$64,904 Asian householders$80,080 Two or more races householders$65,414 Hispanic or Latino race householdersMedian 2022 house value $324,917 White Non-Hispanic householders$327,391 Black or African American householders $387,592 Asian householders$390,478 Some other race householders$309,249 Two or more races householders$359,141 Hispanic or Latino householders
Median age by race in Broadview Park
49.0 Median age for White residents49.3 48.7 34.2 Median age for Black or African American residents33.8 50.3 -660,098,521.5 Median age for American Indian / Alaska Native residents-518,333,332.8 -735,362,996.9 59.9 Median age for Asian residents35.0 63.9 -437,357,630.5 Median age for Native Hawaiian / Pacific Islander residents-454,756,380.1 -666,666,666.0 32.4 Median age for Other race residents33.5 32.4 37.8 Median age for Two or more races residents36.6 44.4 50.6 Median age for White alone residents50.8 47.7 41.3 Median age for Hispanic or Latino residents41.5 41.2
Owner/renter occupied households by race in Broadview Park
House owners and renters - White residents 843 69.8% Owner occupied365 30.2% Renter occupiedHouse owners and renters - Black or African American residents 53 27.3% Owner occupied142 72.7% Renter occupiedHouse owners and renters - Asian residents 58 80.0% Owner occupied15 20.0% Renter occupiedHouse owners and renters - Other race residents 58 15.6% Owner occupied315 84.4% Renter occupiedHouse owners and renters - Two or more races residents 338 46.9% Owner occupied383 53.1% Renter occupiedHouse owners and renters - White alone residents 452 64.6% Owner occupied247 35.4% Renter occupiedHouse owners and renters - Hispanic or Latino residents 798 53.2% Owner occupied703 46.8% Renter occupied
Language usage in Broadview Park
English speakers - Total 36.0% of residents of Broadview Park speak English at home.
62.1% of residents speak Spanish at home 1,607 36.8% Speak English very well2,760 63.2% Speak English less than very well4.2% of residents speak other language at home 203 69.0% Speak English very well91 31.0% Speak English less than very well
English speakers - Born in the United States 72.5% of residents of Broadview Park speak English at home.
25.3% of residents speak Spanish at home 163 48.5% Speak English very well173 51.5% Speak English less than very well1.4% of residents speak other language at home 19 100.0% Speak English very well
English speakers - Native, born elsewhere 0.0% of residents of Broadview Park speak English at home.
99.7% of residents speak Spanish at home 227 60.7% Speak English very well147 39.3% Speak English less than very well
English speakers - Foreign-born 10.4% of residents of Broadview Park speak English at home.
87.7% of residents speak Spanish at home 738 23.6% Speak English very well2,384 76.4% Speak English less than very well4.8% of residents speak other language at home 79 46.5% Speak English very well91 53.5% Speak English less than very well
White (Caucasian) - Speak only English Native:
80.1% (1,486)Foreign-born:
2.4% (19)
White (Caucasian) - Speak another language Native:
18.3% (340)Foreign-born:
91.8% (707)
Black or African American - Speak only English Native:
60.5% (177)Foreign-born:
86.5% (274)
Black or African American - Speak another language Native:
37.6% (110)Foreign-born:
9.8% (31)
Asian - Speak only English Native:
94.3% (27)Foreign-born:
28.7% (54)
Other race - Speak another language Native:
88.1% (440)Foreign-born:
99.4% (854)
Two or more races - Speak another language Native:
57.4% (622)Foreign-born:
100.0% (1,723)
White alone - Speak only English Native:
84.1% (1,290)Foreign-born:
17.4% (22)
White alone - Speak another language Native:
16.0% (246)Foreign-born:
81.5% (101)
Hispanic or Latino - Speak another language Native:
65.1% (1,005)Foreign-born:
99.7% (2,974)
Foreign-born residents in Broadview Park 3,660 residents are foreign born (43.8% Latin America ).
This city:
49.4%Florida:
21.1%
Marital status for residents in Broadview Park Marital status - White (Caucasian) population 15 years and over
Males 43.9% Never married40.7% Now married6.9% Separated4.8% Widowed3.7% DivorcedFemales 32.5% Never married37.7% Now married3.0% Separated8.8% Widowed18.0% DivorcedWomen who gave birth in the past 12 months Now married:
0.0% (0)Unmarried:
100.0% (50)
Women who did not give birth in the past 12 months Now married:
32.8% (140)Unmarried:
67.2% (287)
Marital status - Black or African American population 15 years and over
Males 62.7% Never married26.0% Now married0.0% Separated0.0% Widowed11.3% DivorcedFemales 0.0% Never married22.6% Now married0.0% Separated49.1% Widowed28.3% DivorcedWomen who gave birth in the past 12 months Now married:
100.0% (23)Unmarried:
0.0% (0)
Women who did not give birth in the past 12 months Now married:
0.0% (0)Unmarried:
100.0% (29)
Marital status - Asian population 15 years and over
Males 56.3% Never married43.8% Now married0.0% Separated0.0% Widowed0.0% DivorcedFemales 0.0% Never married82.8% Now married17.2% Separated0.0% Widowed0.0% DivorcedMarital status - Other race population 15 years and over
Males 15.1% Never married84.9% Now married0.0% Separated0.0% Widowed0.0% DivorcedFemales 25.5% Never married74.5% Now married0.0% Separated0.0% Widowed0.0% DivorcedWomen who did not give birth in the past 12 months Now married:
65.4% (174)Unmarried:
34.6% (92)
Marital status - Two or more races population 15 years and over
Males 51.3% Never married26.8% Now married0.0% Separated12.1% Widowed9.8% DivorcedFemales 34.5% Never married25.8% Now married9.0% Separated11.9% Widowed18.8% DivorcedWomen who gave birth in the past 12 months Now married:
100.0% (71)Unmarried:
0.0% (0)
Women who did not give birth in the past 12 months Now married:
40.3% (269)Unmarried:
59.7% (399)
Marital status - White alone, not Hispanic / Latino population 15 years and over
Males 51.7% Never married33.1% Now married0.0% Separated10.1% Widowed5.0% DivorcedFemales 38.4% Never married27.0% Now married2.7% Separated14.4% Widowed17.5% DivorcedWomen who gave birth in the past 12 months Now married:
0.0% (0)Unmarried:
100.0% (30)
Women who did not give birth in the past 12 months Now married:
9.7% (34)Unmarried:
90.3% (316)
Marital status - Hispanic or Latino population 15 years and over
Males 38.7% Never married45.9% Now married5.7% Separated4.8% Widowed5.0% DivorcedFemales 29.2% Never married43.3% Now married5.7% Separated6.0% Widowed15.7% DivorcedWomen who gave birth in the past 12 months Now married:
58.0% (48)Unmarried:
42.0% (35)
Women who did not give birth in the past 12 months Now married:
55.3% (456)Unmarried:
44.7% (368)
Ancestries in Broadview Park
443 8.7% American208 4.1% Bahamian117 2.3% Italian59 1.2% Jamaican48 0.9% Yugoslavian37 0.7% English31 0.6% Haitian13 0.3% Hungarian13 0.3% Polish12 0.2% German8 0.2% European4 0.08% Cape Verdean
Children Nativity (place of birth) in Broadview Park
Children under 6 years - Living with two parents Both parents native 18 66.1% Native9 33.9% Foreign-bornBoth parents foreign-born 168 64.3% Native93 35.7% Foreign-bornChildren under 6 years - Living with one parent Foreign-born parent 229 100.0% NativeChildren 6 to 17 years - Living with two parents Both parents native 58 100.0% NativeBoth parents foreign-born 336 73.0% Native124 27.0% Foreign-bornChildren 6 to 17 years - Living with one parent Native parent 49 100.0% NativeForeign-born parent 238 54.9% Native195 45.1% Foreign-born
Grandparents responsible for own grandchildren in Broadview Park
Grandparents (30 to 59 years) White / Caucasian 17 54.6% Responsible for grandchildren14 45.4% Not responsible for grandchildrenTwo or more races 221 100.0% Not responsible for grandchildrenWhite alone, not Hispanic / Latino 21 65.3% Responsible for grandchildren11 34.7% Not responsible for grandchildrenHispanic or Latino 132 100.0% Not responsible for grandchildren
Grandparents (60 years and over) Two or more races 14 100.0% Not responsible for grandchildrenHispanic or Latino 8 100.0% Not responsible for grandchildren