Races in Brentwood, Tennessee (TN) Detailed Stats
Data:
Races - White alone (%)
Races - White alone (% change since 2000)
Races - Black alone (%)
Races - Black alone (% change since 2000)
Races - American Indian alone (%)
Races - American Indian alone (% change since 2000)
Races - Asian alone (%)
Races - Asian alone (% change since 2000)
Races - Hispanic (%)
Races - Hispanic (% change since 2000)
Races - Native Hawaiian and Other Pacific Islander alone (%)
Races - Native Hawaiian and Other Pacific Islander alone (% change since 2000)
Races - Two or more races(%)
Races - Two or more races(% change since 2000)
Races - Other race alone (%)
Races - Other race alone (% change since 2000)
Racial diversity
Place of birth - Born in state of residence (%)
Place of birth - Born in state of residence (%) - White
Place of birth - Born in state of residence (%) - Black or African American
Place of birth - Born in state of residence (%) - Asian
Place of birth - Born in state of residence (%) - Hispanic or Latino
Place of birth - Born in state of residence (%) - American Indian and Alaska Native
Place of birth - Born in state of residence (%) - Multirace
Place of birth - Born in state of residence (%) - Other Race
Place of birth - Born in other state (%)
Place of birth - Born in other state (%) - White
Place of birth - Born in other state (%) - Black or African American
Place of birth - Born in other state (%) - Asian
Place of birth - Born in other state (%) - Hispanic or Latino
Place of birth - Born in other state (%) - American Indian and Alaska Native
Place of birth - Born in other state (%) - Multirace
Place of birth - Born in other state (%) - Other Race
Place of birth - Native, outside of US (%)
Place of birth - Native, outside of US (%) - White
Place of birth - Native, outside of US (%) - Black or African American
Place of birth - Native, outside of US (%) - Asian
Place of birth - Native, outside of US (%) - Hispanic or Latino
Place of birth - Native, outside of US (%) - American Indian and Alaska Native
Place of birth - Native, outside of US (%) - Multirace
Place of birth - Native, outside of US (%) - Other Race
Place of birth - Foreign born (%)
Place of birth - Foreign born (%) - White
Place of birth - Foreign born (%) - Black or African American
Place of birth - Foreign born (%) - Asian
Place of birth - Foreign born (%) - Hispanic or Latino
Place of birth - Foreign born (%) - American Indian and Alaska Native
Place of birth - Foreign born (%) - Multirace
Place of birth - Foreign born (%) - Other Race
Residents speaking English at home (%)
Residents speaking English at home - Born in the United States (%)
Residents speaking English at home - Native, born elsewhere (%)
Residents speaking English at home - Foreign born (%)
Residents speaking Spanish at home (%)
Residents speaking Spanish at home - Born in the United States (%)
Residents speaking Spanish at home - Native, born elsewhere (%)
Residents speaking Spanish at home - Foreign born (%)
Residents speaking other language at home (%)
Residents speaking other language at home - Born in the United States (%)
Residents speaking other language at home - Native, born elsewhere (%)
Residents speaking other language at home - Foreign born (%)
Marital status - Never married (%)
Marital status - Now married (%)
Marital status - Separated (%)
Marital status - Widowed (%)
Marital status - Divorced (%)
Ancestries Reported - Arab (%)
Ancestries Reported - Czech (%)
Ancestries Reported - Danish (%)
Ancestries Reported - Dutch (%)
Ancestries Reported - English (%)
Ancestries Reported - French (%)
Ancestries Reported - French Canadian (%)
Ancestries Reported - German (%)
Ancestries Reported - Greek (%)
Ancestries Reported - Hungarian (%)
Ancestries Reported - Irish (%)
Ancestries Reported - Italian (%)
Ancestries Reported - Lithuanian (%)
Ancestries Reported - Norwegian (%)
Ancestries Reported - Polish (%)
Ancestries Reported - Portuguese (%)
Ancestries Reported - Russian (%)
Ancestries Reported - Scotch-Irish (%)
Ancestries Reported - Scottish (%)
Ancestries Reported - Slovak (%)
Ancestries Reported - Subsaharan African (%)
Ancestries Reported - Swedish (%)
Ancestries Reported - Swiss (%)
Ancestries Reported - Ukrainian (%)
Ancestries Reported - United States (%)
Ancestries Reported - Welsh (%)
Ancestries Reported - West Indian (%)
Ancestries Reported - Other (%)
Geographical mobility - Same house 1 year ago (%)
Geographical mobility - Same house 1 year ago (%) - White
Geographical mobility - Same house 1 year ago (%) - Black or African American
Geographical mobility - Same house 1 year ago (%) - Asian
Geographical mobility - Same house 1 year ago (%) - Hispanic or Latino
Geographical mobility - Same house 1 year ago (%) - American Indian and Alaska Native
Geographical mobility - Same house 1 year ago (%) - Multirace
Geographical mobility - Same house 1 year ago (%) - Other Race
Geographical mobility - Moved within same county (%)
Geographical mobility - Moved within same county (%) - White
Geographical mobility - Moved within same county (%) - Black or African American
Geographical mobility - Moved within same county (%) - Asian
Geographical mobility - Moved within same county (%) - Hispanic or Latino
Geographical mobility - Moved within same county (%) - American Indian and Alaska Native
Geographical mobility - Moved within same county (%) - Multirace
Geographical mobility - Moved within same county (%) - Other Race
Geographical mobility - Moved from different county within same state (%)
Geographical mobility - Moved from different county within same state (%) - White
Geographical mobility - Moved from different county within same state (%) - Black or African American
Geographical mobility - Moved from different county within same state (%) - Asian
Geographical mobility - Moved from different county within same state (%) - Hispanic or Latino
Geographical mobility - Moved from different county within same state (%) - American Indian and Alaska Native
Geographical mobility - Moved from different county within same state (%) - Multirace
Geographical mobility - Moved from different county within same state (%) - Other Race
Geographical mobility - Moved from different state (%)
Geographical mobility - Moved from different state (%) - White
Geographical mobility - Moved from different state (%) - Black or African American
Geographical mobility - Moved from different state (%) - Asian
Geographical mobility - Moved from different state (%) - Hispanic or Latino
Geographical mobility - Moved from different state (%) - American Indian and Alaska Native
Geographical mobility - Moved from different state (%) - Multirace
Geographical mobility - Moved from different state (%) - Other Race
Geographical mobility - Moved from abroad (%)
Geographical mobility - Moved from abroad (%) - White
Geographical mobility - Moved from abroad (%) - Black or African American
Geographical mobility - Moved from abroad (%) - Asian
Geographical mobility - Moved from abroad (%) - Hispanic or Latino
Geographical mobility - Moved from abroad (%) - American Indian and Alaska Native
Geographical mobility - Moved from abroad (%) - Multirace
Geographical mobility - Moved from abroad (%) - Other Race
Place of birth for the foreign-born population - Ireland (%)
Place of birth for the foreign-born population - Denmark (%)
Place of birth for the foreign-born population - Norway (%)
Place of birth for the foreign-born population - Sweden (%)
Place of birth for the foreign-born population - United Kingdom (%)
Place of birth for the foreign-born population - England (%)
Place of birth for the foreign-born population - Scotland (%)
Place of birth for the foreign-born population - Other Northern Europe (%)
Place of birth for the foreign-born population - Austria (%)
Place of birth for the foreign-born population - Belgium (%)
Place of birth for the foreign-born population - France (%)
Place of birth for the foreign-born population - Germany (%)
Place of birth for the foreign-born population - Netherlands (%)
Place of birth for the foreign-born population - Switzerland (%)
Place of birth for the foreign-born population - Other Western Europe (%)
Place of birth for the foreign-born population - Greece (%)
Place of birth for the foreign-born population - Italy (%)
Place of birth for the foreign-born population - Portugal (%)
Place of birth for the foreign-born population - Spain (%)
Place of birth for the foreign-born population - Other Southern Europe (%)
Place of birth for the foreign-born population - Albania (%)
Place of birth for the foreign-born population - Belarus (%)
Place of birth for the foreign-born population - Bosnia and Herzegovina (%)
Place of birth for the foreign-born population - Bulgaria (%)
Place of birth for the foreign-born population - Croatia (%)
Place of birth for the foreign-born population - Czechoslovakia (%)
Place of birth for the foreign-born population - Hungary (%)
Place of birth for the foreign-born population - Latvia (%)
Place of birth for the foreign-born population - Lithuania (%)
Place of birth for the foreign-born population - North Macedonia (Macedonia) (%)
Place of birth for the foreign-born population - Moldova (%)
Place of birth for the foreign-born population - Poland (%)
Place of birth for the foreign-born population - Romania (%)
Place of birth for the foreign-born population - Russia (%)
Place of birth for the foreign-born population - Serbia (%)
Place of birth for the foreign-born population - Ukraine (%)
Place of birth for the foreign-born population - Other Eastern Europe (%)
Place of birth for the foreign-born population - China (%)
Place of birth for the foreign-born population - Hong Kong (%)
Place of birth for the foreign-born population - Taiwan (%)
Place of birth for the foreign-born population - Japan (%)
Place of birth for the foreign-born population - Korea (%)
Place of birth for the foreign-born population - Other Eastern Asia (%)
Place of birth for the foreign-born population - Afghanistan (%)
Place of birth for the foreign-born population - Bangladesh (%)
Place of birth for the foreign-born population - India (%)
Place of birth for the foreign-born population - Iran (%)
Place of birth for the foreign-born population - Kazakhstan (%)
Place of birth for the foreign-born population - Nepal (%)
Place of birth for the foreign-born population - Pakistan (%)
Place of birth for the foreign-born population - Sri Lanka (%)
Place of birth for the foreign-born population - Uzbekistan (%)
Place of birth for the foreign-born population - Other South Central Asia (%)
Place of birth for the foreign-born population - Burma (%)
Place of birth for the foreign-born population - Cambodia (%)
Place of birth for the foreign-born population - Indonesia (%)
Place of birth for the foreign-born population - Laos (%)
Place of birth for the foreign-born population - Malaysia (%)
Place of birth for the foreign-born population - Philippines (%)
Place of birth for the foreign-born population - Singapore (%)
Place of birth for the foreign-born population - Thailand (%)
Place of birth for the foreign-born population - Vietnam (%)
Place of birth for the foreign-born population - Other South Eastern Asia (%)
Place of birth for the foreign-born population - Armenia (%)
Place of birth for the foreign-born population - Iraq (%)
Place of birth for the foreign-born population - Israel (%)
Place of birth for the foreign-born population - Jordan (%)
Place of birth for the foreign-born population - Kuwait (%)
Place of birth for the foreign-born population - Lebanon (%)
Place of birth for the foreign-born population - Saudi Arabia (%)
Place of birth for the foreign-born population - Syria (%)
Place of birth for the foreign-born population - Turkey (%)
Place of birth for the foreign-born population - Yemen (%)
Place of birth for the foreign-born population - Other Western Asia (%)
Place of birth for the foreign-born population - Eritrea (%)
Place of birth for the foreign-born population - Ethiopia (%)
Place of birth for the foreign-born population - Kenya (%)
Place of birth for the foreign-born population - Somalia (%)
Place of birth for the foreign-born population - Uganda (%)
Place of birth for the foreign-born population - Zimbabwe (%)
Place of birth for the foreign-born population - Other Eastern Africa (%)
Place of birth for the foreign-born population - Cameroon (%)
Place of birth for the foreign-born population - Congo (%)
Place of birth for the foreign-born population - Democratic Republic of Congo (Zaire) (%)
Place of birth for the foreign-born population - Other Middle Africa (%)
Place of birth for the foreign-born population - Egypt (%)
Place of birth for the foreign-born population - Morocco (%)
Place of birth for the foreign-born population - Sudan (%)
Place of birth for the foreign-born population - Other Northern Africa (%)
Place of birth for the foreign-born population - South Africa (%)
Place of birth for the foreign-born population - Other Southern Africa (%)
Place of birth for the foreign-born population - Cabo Verde (%)
Place of birth for the foreign-born population - Ghana (%)
Place of birth for the foreign-born population - Liberia (%)
Place of birth for the foreign-born population - Nigeria (%)
Place of birth for the foreign-born population - Senegal (%)
Place of birth for the foreign-born population - Sierra Leone (%)
Place of birth for the foreign-born population - Other Western Africa (%)
Place of birth for the foreign-born population - Australia (%)
Place of birth for the foreign-born population - New Zealand (%)
Place of birth for the foreign-born population - Fiji (%)
Place of birth for the foreign-born population - Micronesia (%)
Place of birth for the foreign-born population - Bahamas (%)
Place of birth for the foreign-born population - Barbados (%)
Place of birth for the foreign-born population - Cuba (%)
Place of birth for the foreign-born population - Dominica (%)
Place of birth for the foreign-born population - Dominican Republic (%)
Place of birth for the foreign-born population - Grenada (%)
Place of birth for the foreign-born population - Haiti (%)
Place of birth for the foreign-born population - Jamaica (%)
Place of birth for the foreign-born population - St. Vincent and the Grenadines (%)
Place of birth for the foreign-born population - Trinidad and Tobago (%)
Place of birth for the foreign-born population - West Indies (%)
Place of birth for the foreign-born population - Other Caribbean (%)
Place of birth for the foreign-born population - Belize (%)
Place of birth for the foreign-born population - Costa Rica (%)
Place of birth for the foreign-born population - El Salvador (%)
Place of birth for the foreign-born population - Guatemala (%)
Place of birth for the foreign-born population - Honduras (%)
Place of birth for the foreign-born population - Mexico (%)
Place of birth for the foreign-born population - Nicaragua (%)
Place of birth for the foreign-born population - Panama (%)
Place of birth for the foreign-born population - Other Central America (%)
Place of birth for the foreign-born population - Argentina (%)
Place of birth for the foreign-born population - Bolivia (%)
Place of birth for the foreign-born population - Brazil (%)
Place of birth for the foreign-born population - Chile (%)
Place of birth for the foreign-born population - Colombia (%)
Place of birth for the foreign-born population - Ecuador (%)
Place of birth for the foreign-born population - Guyana (%)
Place of birth for the foreign-born population - Peru (%)
Place of birth for the foreign-born population - Uruguay (%)
Place of birth for the foreign-born population - Venezuela (%)
Place of birth for the foreign-born population - Other South America (%)
Place of birth for the foreign-born population - Canada (%)
Place of birth for the foreign-born population - Other Northern America (%)
Place of birth for the foreign-born population - Other (%)
Latest news about races in Brentwood, TN collected exclusively by city-data.com from local newspapers, TV, and radio stations
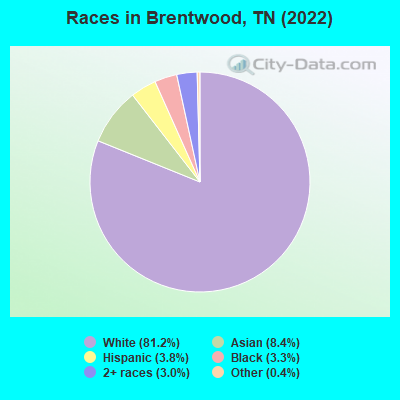
According to 2022 data, the most numerous races in Brentwood, TN are White alone (38,129 residents), Black alone (1,538 residents), and Hispanic (1,783 residents). 89.0% of Brentwood residents speak English at home. 9.0% of Brentwood, TN residents are foreign-born (5.3% born in Asia, 1.2% born in Latin America, 0.9% born in Europe), which is 44.5% greater than the foreign-born rate of 5.0% across the entire state of Tennessee.
Race distribution in Brentwood
2000 2022
4,505,930 79.2% White alone 928,204 16.3% Black alone 123,838 2.2% Hispanic 54,824 1.0% Two or more races 56,077 1.0% Asian alone 13,820 0.2% American Indian alone 4,780 0.08% Other race alone 1,810 0.03% Native Hawaiian and Other
5,070,026 71.9% White alone 1,089,738 15.5% Black alone 442,629 6.3% Hispanic 279,381 4.0% Two or more races 131,817 1.9% Asian alone 26,972 0.4% Other race alone 6,387 0.09% American Indian alone 4,389 0.06% Native Hawaiian and Other
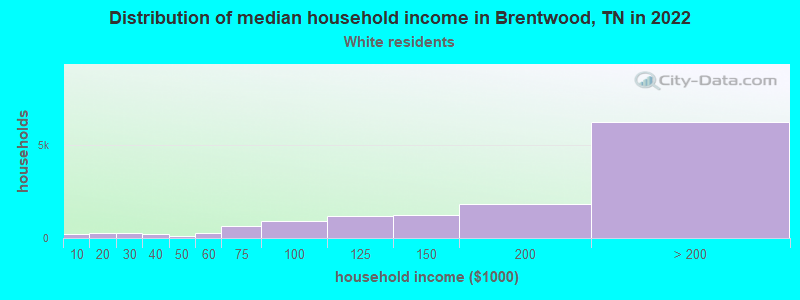
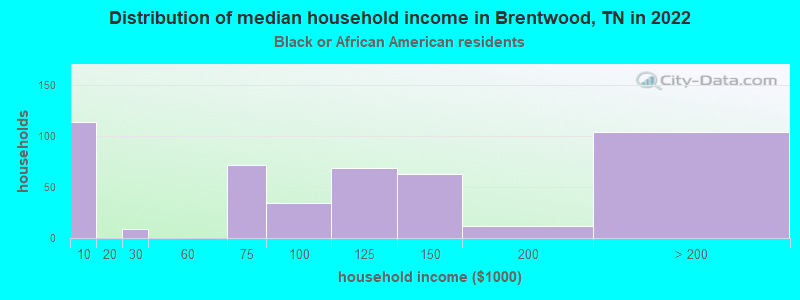
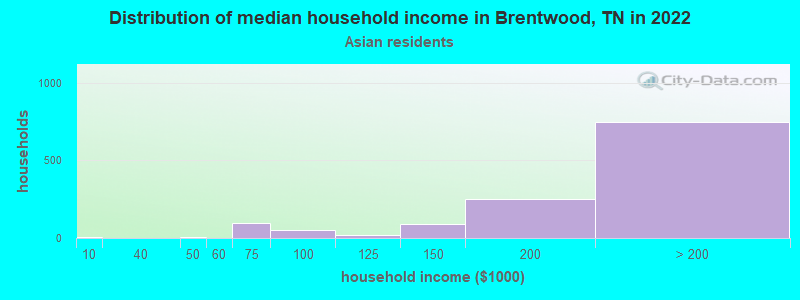
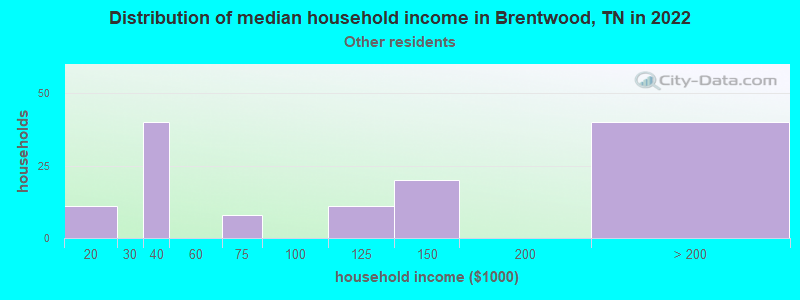
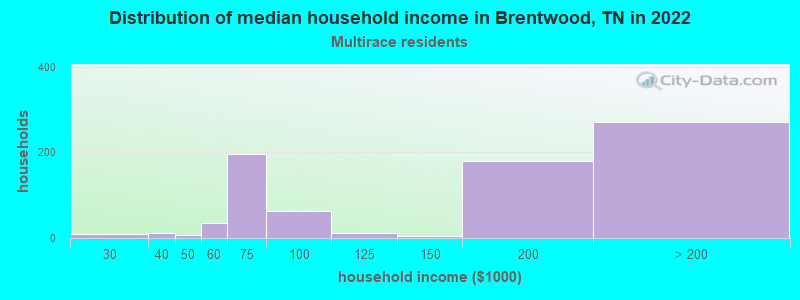
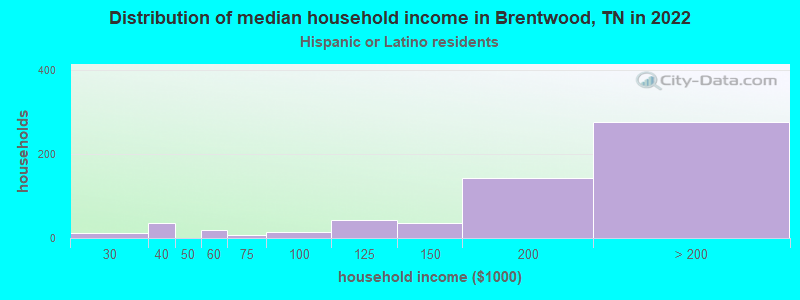
Income and house value in Brentwood Median household income in 2022 $183,559 White non-Hispanic householders$118,660 Black householdersover $200,000 Asian householders$170,181 Two or more races householders$185,709 Hispanic or Latino race householdersMedian 2022 house value over $1,000,000 White Non-Hispanic householdersover $1,000,000 Black or African American householders$531,019 American Indian or Alaska Native householders over $1,000,000 Asian householders$449,324 Native Hawaiian and other Pacific Islander householdersover $1,000,000 Two or more races householdersover $1,000,000 Hispanic or Latino householders
Median age by race in Brentwood
44.9 Median age for White residents43.0 47.4 42.0 Median age for Black or African American residents30.1 39.6 21.4 Median age for American Indian / Alaska Native residents-875,213,674.3 18.5 43.6 Median age for Asian residents40.2 46.6 -666,666,666.0 Median age for Native Hawaiian / Pacific Islander residents-666,666,666.0 -735,930,735.2 31.3 Median age for Other race residents32.7 27.4 39.1 Median age for Two or more races residents31.6 42.4 45.0 Median age for White alone residents43.1 47.2 47.1 Median age for Hispanic or Latino residents36.9 42.9
Owner/renter occupied households by race in Brentwood
House owners and renters - White residents 12,335 92.6% Owner occupied982 7.4% Renter occupiedHouse owners and renters - Black or African American residents 405 70.7% Owner occupied168 29.3% Renter occupiedHouse owners and renters - American Indian / Alaska Native residents 12 100.0% Owner occupiedHouse owners and renters - Asian residents 1,267 95.5% Owner occupied59 4.5% Renter occupiedHouse owners and renters - Other race residents 65 43.4% Owner occupied86 56.6% Renter occupiedHouse owners and renters - Two or more races residents 636 89.9% Owner occupied71 10.1% Renter occupiedHouse owners and renters - White alone residents 12,178 92.6% Owner occupied969 7.4% Renter occupiedHouse owners and renters - Hispanic or Latino residents 333 75.4% Owner occupied108 24.6% Renter occupied
Language usage in Brentwood
English speakers - Total 89.0% of residents of Brentwood speak English at home.
1.9% of residents speak Spanish at home 604 70.6% Speak English very well252 29.4% Speak English less than very well9.3% of residents speak other language at home 3,358 79.4% Speak English very well872 20.6% Speak English less than very well
English speakers - Born in the United States 96.7% of residents of Brentwood speak English at home.
0.6% of residents speak Spanish at home 121 94.5% Speak English very well7 5.5% Speak English less than very well3.9% of residents speak other language at home 859 97.4% Speak English very well23 2.6% Speak English less than very well
English speakers - Native, born elsewhere 83.8% of residents of Brentwood speak English at home.
13.0% of residents speak Spanish at home 75 100.0% Speak English very well2.3% of residents speak other language at home 13 100.0% Speak English very well
English speakers - Foreign-born 27.7% of residents of Brentwood speak English at home.
7.5% of residents speak Spanish at home 212 59.7% Speak English very well143 40.3% Speak English less than very well63.6% of residents speak other language at home 2,250 74.4% Speak English very well773 25.6% Speak English less than very well
White (Caucasian) - Speak only English Native:
98.4% (35,527)Foreign-born:
66.4% (837)
White (Caucasian) - Speak another language Native:
1.6% (581)Foreign-born:
31.8% (401)
Black or African American - Speak only English Native:
99.9% (1,219)Foreign-born:
56.6% (115)
American Indian / Alaska Native - Speak another language Native:
100.0% (30)Foreign-born:
100.0% (23)
Asian - Speak only English Native:
39.9% (591)Foreign-born:
9.0% (212)
Asian - Speak another language Native:
60.8% (900)Foreign-born:
91.8% (2,148)
Other race - Speak only English Native:
97.1% (355)Foreign-born:
48.7% (50)
Other race - Speak another language Native:
7.0% (26)Foreign-born:
30.0% (31)
Two or more races - Speak only English Native:
86.2% (1,526)Foreign-born:
50.8% (176)
Two or more races - Speak another language Native:
12.5% (222)Foreign-born:
53.8% (186)
White alone - Speak only English Native:
98.8% (35,213)Foreign-born:
58.9% (755)
White alone - Speak another language Native:
1.2% (446)Foreign-born:
40.2% (515)
Hispanic or Latino - Speak only English Native:
59.1% (635)Foreign-born:
36.9% (219)
Hispanic or Latino - Speak another language Native:
39.4% (424)Foreign-born:
61.5% (365)
Foreign-born residents in Brentwood 4,231 residents are foreign born (5.3% Asia , 1.2% Latin America , 0.9% Europe ).
This city:
9.0%Tennessee:
5.4%
Marital status for residents in Brentwood Marital status - White (Caucasian) population 15 years and over
Males 24.9% Never married69.6% Now married0.3% Separated1.7% Widowed3.4% DivorcedFemales 20.9% Never married65.0% Now married0.5% Separated5.4% Widowed8.2% DivorcedWomen who gave birth in the past 12 months Now married:
93.6% (191)Unmarried:
6.4% (13)
Women who did not give birth in the past 12 months Now married:
53.8% (4,184)Unmarried:
46.2% (3,587)
Marital status - Black or African American population 15 years and over
Males 36.5% Never married53.1% Now married0.0% Separated0.0% Widowed10.4% DivorcedFemales 34.9% Never married54.0% Now married0.8% Separated4.4% Widowed5.9% DivorcedWomen who did not give birth in the past 12 months Now married:
45.7% (187)Unmarried:
54.3% (222)
Marital status - American Indian / Alaska Native population 15 years and over
Males 0.0% Never married100.0% Now married0.0% Separated0.0% Widowed0.0% DivorcedFemales 84.4% Never married15.6% Now married0.0% Separated0.0% Widowed0.0% DivorcedWomen who did not give birth in the past 12 months Now married:
15.6% (6)Unmarried:
84.4% (32)
Marital status - Asian population 15 years and over
Males 19.1% Never married80.2% Now married0.0% Separated0.0% Widowed0.7% DivorcedFemales 19.6% Never married75.6% Now married0.6% Separated1.4% Widowed2.8% DivorcedWomen who gave birth in the past 12 months Now married:
100.0% (9)Unmarried:
0.0% (0)
Women who did not give birth in the past 12 months Now married:
69.4% (789)Unmarried:
30.6% (347)
Marital status - Other race population 15 years and over
Males 47.5% Never married48.8% Now married0.0% Separated0.0% Widowed3.8% DivorcedFemales 46.6% Never married13.5% Now married0.0% Separated5.4% Widowed34.5% DivorcedWomen who did not give birth in the past 12 months Now married:
0.0% (0)Unmarried:
100.0% (89)
Marital status - Two or more races population 15 years and over
Males 12.1% Never married75.7% Now married0.0% Separated0.0% Widowed12.1% DivorcedFemales 20.5% Never married40.0% Now married0.0% Separated28.0% Widowed11.5% DivorcedWomen who did not give birth in the past 12 months Now married:
43.0% (174)Unmarried:
57.0% (231)
Marital status - White alone, not Hispanic / Latino population 15 years and over
Males 24.9% Never married69.8% Now married0.3% Separated1.8% Widowed3.2% DivorcedFemales 20.9% Never married64.8% Now married0.5% Separated5.5% Widowed8.4% DivorcedWomen who gave birth in the past 12 months Now married:
93.6% (194)Unmarried:
6.4% (13)
Women who did not give birth in the past 12 months Now married:
53.5% (4,120)Unmarried:
46.5% (3,578)
Marital status - Hispanic or Latino population 15 years and over
Males 21.5% Never married67.2% Now married0.9% Separated0.0% Widowed10.5% DivorcedFemales 29.5% Never married60.5% Now married0.0% Separated1.5% Widowed8.6% DivorcedWomen who did not give birth in the past 12 months Now married:
53.9% (216)Unmarried:
46.1% (185)
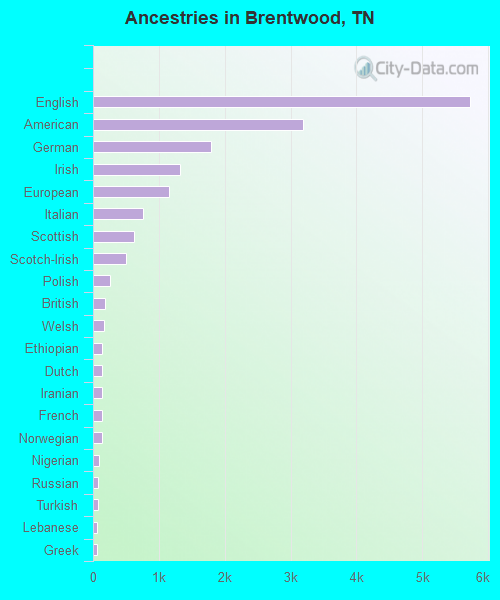
Ancestries in Brentwood
5,726 24.0% English3,189 13.4% American1,793 7.5% German1,326 5.6% Irish1,148 4.8% European756 3.2% Italian619 2.6% Scottish508 2.1% Scotch-Irish251 1.1% Polish185 0.8% British173 0.7% Welsh144 0.6% Ethiopian143 0.6% Dutch140 0.6% Iranian140 0.6% French139 0.6% Norwegian90 0.4% Nigerian82 0.3% Russian70 0.3% Turkish65 0.3% Lebanese58 0.2% Greek50 0.2% Lithuanian50 0.2% Danish47 0.2% French Canadian47 0.2% Canadian46 0.2% Latvian46 0.2% Cape Verdean43 0.2% Egyptian38 0.2% Swiss36 0.2% Hungarian35 0.1% Northern European35 0.1% South African34 0.1% Scandinavian29 0.1% Eastern European20 0.08% Serbian18 0.08% Jamaican18 0.08% Ukrainian16 0.07% Brazilian15 0.06% Belgian12 0.05% Croatian10 0.04% African9 0.04% Portuguese9 0.04% Romanian9 0.04% Slovak9 0.04% Swedish7 0.03% Austrian7 0.03% Celtic6 0.03% Estonian5 0.02% Armenian4 0.02% Bulgarian4 0.02% Icelander4 0.02% Finnish
Geographical mobility in Brentwood Same house 1 year ago 35,921 93.5% White (Caucasian)1,058 74.3% Black or African American52 100.0% American Indian / Alaska Native3,278 83.9% Asian427 89.9% Other race1,812 79.4% Two or more races35,538 93.5% White alone, not Hispanic / Latino1,591 90.8% Hispanic or LatinoMoved within same county 1,418 3.7% White / Caucasian309 21.7% Black or African American144 3.7% Asian125 5.5% Two or more races1,348 3.5% White alone, not Hispanic / Latino94 5.4% Hispanic or LatinoMoved within same state 666 1.7% White / Caucasian50 1.3% Asian37 7.8% Other race157 6.9% Two or more races675 1.8% White alone, not Hispanic / Latino33 1.9% Hispanic or LatinoMoved from different state 630 1.6% White / Caucasian43 3.0% Black or African American244 6.2% Asian89 3.9% Two or more races639 1.7% White alone, not Hispanic / LatinoMoved from abroad 70 0.2% White5 0.1% Asian21 4.5% Other race32 1.4% Two or more races51 0.1% White alone, not Hispanic / Latino23 1.3% Hispanic or Latino
Children Nativity (place of birth) in Brentwood
Children under 6 years - Living with two parents Both parents native 1,380 100.0% NativeBoth parents foreign-born 148 89.5% Native17 10.5% Foreign-bornOne native, one foreign-born parent 172 100.0% NativeChildren under 6 years - Living with one parent Native parent 88 100.0% NativeForeign-born parent 12 100.0% NativeChildren 6 to 17 years - Living with two parents Both parents native 7,332 97.7% Native176 2.3% Foreign-bornBoth parents foreign-born 790 69.3% Native350 30.7% Foreign-bornOne native, one foreign-born parent 403 97.3% Native11 2.7% Foreign-bornChildren 6 to 17 years - Living with one parent Native parent 1,100 100.0% NativeForeign-born parent 103 46.5% Native118 53.5% Foreign-born
Grandparents responsible for own grandchildren in Brentwood
Grandparents (30 to 59 years) White / Caucasian 11 100.0% Not responsible for grandchildrenAsian 52 100.0% Not responsible for grandchildrenWhite alone, not Hispanic / Latino 11 100.0% Not responsible for grandchildrenGrandparents (60 years and over) White / Caucasian 42 14.0% Responsible for grandchildren260 86.0% Not responsible for grandchildrenAsian 9 16.6% Responsible for grandchildren44 83.4% Not responsible for grandchildrenWhite alone, not Hispanic / Latino 43 14.0% Responsible for grandchildren261 86.0% Not responsible for grandchildren