Races in Bremerton, Washington (WA) Detailed Stats
Data:
Races - White alone (%)
Races - White alone (% change since 2000)
Races - Black alone (%)
Races - Black alone (% change since 2000)
Races - American Indian alone (%)
Races - American Indian alone (% change since 2000)
Races - Asian alone (%)
Races - Asian alone (% change since 2000)
Races - Hispanic (%)
Races - Hispanic (% change since 2000)
Races - Native Hawaiian and Other Pacific Islander alone (%)
Races - Native Hawaiian and Other Pacific Islander alone (% change since 2000)
Races - Two or more races(%)
Races - Two or more races(% change since 2000)
Races - Other race alone (%)
Races - Other race alone (% change since 2000)
Racial diversity
Place of birth - Born in state of residence (%)
Place of birth - Born in state of residence (%) - White
Place of birth - Born in state of residence (%) - Black or African American
Place of birth - Born in state of residence (%) - Asian
Place of birth - Born in state of residence (%) - Hispanic or Latino
Place of birth - Born in state of residence (%) - American Indian and Alaska Native
Place of birth - Born in state of residence (%) - Multirace
Place of birth - Born in state of residence (%) - Other Race
Place of birth - Born in other state (%)
Place of birth - Born in other state (%) - White
Place of birth - Born in other state (%) - Black or African American
Place of birth - Born in other state (%) - Asian
Place of birth - Born in other state (%) - Hispanic or Latino
Place of birth - Born in other state (%) - American Indian and Alaska Native
Place of birth - Born in other state (%) - Multirace
Place of birth - Born in other state (%) - Other Race
Place of birth - Native, outside of US (%)
Place of birth - Native, outside of US (%) - White
Place of birth - Native, outside of US (%) - Black or African American
Place of birth - Native, outside of US (%) - Asian
Place of birth - Native, outside of US (%) - Hispanic or Latino
Place of birth - Native, outside of US (%) - American Indian and Alaska Native
Place of birth - Native, outside of US (%) - Multirace
Place of birth - Native, outside of US (%) - Other Race
Place of birth - Foreign born (%)
Place of birth - Foreign born (%) - White
Place of birth - Foreign born (%) - Black or African American
Place of birth - Foreign born (%) - Asian
Place of birth - Foreign born (%) - Hispanic or Latino
Place of birth - Foreign born (%) - American Indian and Alaska Native
Place of birth - Foreign born (%) - Multirace
Place of birth - Foreign born (%) - Other Race
Residents speaking English at home (%)
Residents speaking English at home - Born in the United States (%)
Residents speaking English at home - Native, born elsewhere (%)
Residents speaking English at home - Foreign born (%)
Residents speaking Spanish at home (%)
Residents speaking Spanish at home - Born in the United States (%)
Residents speaking Spanish at home - Native, born elsewhere (%)
Residents speaking Spanish at home - Foreign born (%)
Residents speaking other language at home (%)
Residents speaking other language at home - Born in the United States (%)
Residents speaking other language at home - Native, born elsewhere (%)
Residents speaking other language at home - Foreign born (%)
Marital status - Never married (%)
Marital status - Now married (%)
Marital status - Separated (%)
Marital status - Widowed (%)
Marital status - Divorced (%)
Ancestries Reported - Arab (%)
Ancestries Reported - Czech (%)
Ancestries Reported - Danish (%)
Ancestries Reported - Dutch (%)
Ancestries Reported - English (%)
Ancestries Reported - French (%)
Ancestries Reported - French Canadian (%)
Ancestries Reported - German (%)
Ancestries Reported - Greek (%)
Ancestries Reported - Hungarian (%)
Ancestries Reported - Irish (%)
Ancestries Reported - Italian (%)
Ancestries Reported - Lithuanian (%)
Ancestries Reported - Norwegian (%)
Ancestries Reported - Polish (%)
Ancestries Reported - Portuguese (%)
Ancestries Reported - Russian (%)
Ancestries Reported - Scotch-Irish (%)
Ancestries Reported - Scottish (%)
Ancestries Reported - Slovak (%)
Ancestries Reported - Subsaharan African (%)
Ancestries Reported - Swedish (%)
Ancestries Reported - Swiss (%)
Ancestries Reported - Ukrainian (%)
Ancestries Reported - United States (%)
Ancestries Reported - Welsh (%)
Ancestries Reported - West Indian (%)
Ancestries Reported - Other (%)
Geographical mobility - Same house 1 year ago (%)
Geographical mobility - Same house 1 year ago (%) - White
Geographical mobility - Same house 1 year ago (%) - Black or African American
Geographical mobility - Same house 1 year ago (%) - Asian
Geographical mobility - Same house 1 year ago (%) - Hispanic or Latino
Geographical mobility - Same house 1 year ago (%) - American Indian and Alaska Native
Geographical mobility - Same house 1 year ago (%) - Multirace
Geographical mobility - Same house 1 year ago (%) - Other Race
Geographical mobility - Moved within same county (%)
Geographical mobility - Moved within same county (%) - White
Geographical mobility - Moved within same county (%) - Black or African American
Geographical mobility - Moved within same county (%) - Asian
Geographical mobility - Moved within same county (%) - Hispanic or Latino
Geographical mobility - Moved within same county (%) - American Indian and Alaska Native
Geographical mobility - Moved within same county (%) - Multirace
Geographical mobility - Moved within same county (%) - Other Race
Geographical mobility - Moved from different county within same state (%)
Geographical mobility - Moved from different county within same state (%) - White
Geographical mobility - Moved from different county within same state (%) - Black or African American
Geographical mobility - Moved from different county within same state (%) - Asian
Geographical mobility - Moved from different county within same state (%) - Hispanic or Latino
Geographical mobility - Moved from different county within same state (%) - American Indian and Alaska Native
Geographical mobility - Moved from different county within same state (%) - Multirace
Geographical mobility - Moved from different county within same state (%) - Other Race
Geographical mobility - Moved from different state (%)
Geographical mobility - Moved from different state (%) - White
Geographical mobility - Moved from different state (%) - Black or African American
Geographical mobility - Moved from different state (%) - Asian
Geographical mobility - Moved from different state (%) - Hispanic or Latino
Geographical mobility - Moved from different state (%) - American Indian and Alaska Native
Geographical mobility - Moved from different state (%) - Multirace
Geographical mobility - Moved from different state (%) - Other Race
Geographical mobility - Moved from abroad (%)
Geographical mobility - Moved from abroad (%) - White
Geographical mobility - Moved from abroad (%) - Black or African American
Geographical mobility - Moved from abroad (%) - Asian
Geographical mobility - Moved from abroad (%) - Hispanic or Latino
Geographical mobility - Moved from abroad (%) - American Indian and Alaska Native
Geographical mobility - Moved from abroad (%) - Multirace
Geographical mobility - Moved from abroad (%) - Other Race
Place of birth for the foreign-born population - Ireland (%)
Place of birth for the foreign-born population - Denmark (%)
Place of birth for the foreign-born population - Norway (%)
Place of birth for the foreign-born population - Sweden (%)
Place of birth for the foreign-born population - United Kingdom (%)
Place of birth for the foreign-born population - England (%)
Place of birth for the foreign-born population - Scotland (%)
Place of birth for the foreign-born population - Other Northern Europe (%)
Place of birth for the foreign-born population - Austria (%)
Place of birth for the foreign-born population - Belgium (%)
Place of birth for the foreign-born population - France (%)
Place of birth for the foreign-born population - Germany (%)
Place of birth for the foreign-born population - Netherlands (%)
Place of birth for the foreign-born population - Switzerland (%)
Place of birth for the foreign-born population - Other Western Europe (%)
Place of birth for the foreign-born population - Greece (%)
Place of birth for the foreign-born population - Italy (%)
Place of birth for the foreign-born population - Portugal (%)
Place of birth for the foreign-born population - Spain (%)
Place of birth for the foreign-born population - Other Southern Europe (%)
Place of birth for the foreign-born population - Albania (%)
Place of birth for the foreign-born population - Belarus (%)
Place of birth for the foreign-born population - Bosnia and Herzegovina (%)
Place of birth for the foreign-born population - Bulgaria (%)
Place of birth for the foreign-born population - Croatia (%)
Place of birth for the foreign-born population - Czechoslovakia (%)
Place of birth for the foreign-born population - Hungary (%)
Place of birth for the foreign-born population - Latvia (%)
Place of birth for the foreign-born population - Lithuania (%)
Place of birth for the foreign-born population - North Macedonia (Macedonia) (%)
Place of birth for the foreign-born population - Moldova (%)
Place of birth for the foreign-born population - Poland (%)
Place of birth for the foreign-born population - Romania (%)
Place of birth for the foreign-born population - Russia (%)
Place of birth for the foreign-born population - Serbia (%)
Place of birth for the foreign-born population - Ukraine (%)
Place of birth for the foreign-born population - Other Eastern Europe (%)
Place of birth for the foreign-born population - China (%)
Place of birth for the foreign-born population - Hong Kong (%)
Place of birth for the foreign-born population - Taiwan (%)
Place of birth for the foreign-born population - Japan (%)
Place of birth for the foreign-born population - Korea (%)
Place of birth for the foreign-born population - Other Eastern Asia (%)
Place of birth for the foreign-born population - Afghanistan (%)
Place of birth for the foreign-born population - Bangladesh (%)
Place of birth for the foreign-born population - India (%)
Place of birth for the foreign-born population - Iran (%)
Place of birth for the foreign-born population - Kazakhstan (%)
Place of birth for the foreign-born population - Nepal (%)
Place of birth for the foreign-born population - Pakistan (%)
Place of birth for the foreign-born population - Sri Lanka (%)
Place of birth for the foreign-born population - Uzbekistan (%)
Place of birth for the foreign-born population - Other South Central Asia (%)
Place of birth for the foreign-born population - Burma (%)
Place of birth for the foreign-born population - Cambodia (%)
Place of birth for the foreign-born population - Indonesia (%)
Place of birth for the foreign-born population - Laos (%)
Place of birth for the foreign-born population - Malaysia (%)
Place of birth for the foreign-born population - Philippines (%)
Place of birth for the foreign-born population - Singapore (%)
Place of birth for the foreign-born population - Thailand (%)
Place of birth for the foreign-born population - Vietnam (%)
Place of birth for the foreign-born population - Other South Eastern Asia (%)
Place of birth for the foreign-born population - Armenia (%)
Place of birth for the foreign-born population - Iraq (%)
Place of birth for the foreign-born population - Israel (%)
Place of birth for the foreign-born population - Jordan (%)
Place of birth for the foreign-born population - Kuwait (%)
Place of birth for the foreign-born population - Lebanon (%)
Place of birth for the foreign-born population - Saudi Arabia (%)
Place of birth for the foreign-born population - Syria (%)
Place of birth for the foreign-born population - Turkey (%)
Place of birth for the foreign-born population - Yemen (%)
Place of birth for the foreign-born population - Other Western Asia (%)
Place of birth for the foreign-born population - Eritrea (%)
Place of birth for the foreign-born population - Ethiopia (%)
Place of birth for the foreign-born population - Kenya (%)
Place of birth for the foreign-born population - Somalia (%)
Place of birth for the foreign-born population - Uganda (%)
Place of birth for the foreign-born population - Zimbabwe (%)
Place of birth for the foreign-born population - Other Eastern Africa (%)
Place of birth for the foreign-born population - Cameroon (%)
Place of birth for the foreign-born population - Congo (%)
Place of birth for the foreign-born population - Democratic Republic of Congo (Zaire) (%)
Place of birth for the foreign-born population - Other Middle Africa (%)
Place of birth for the foreign-born population - Egypt (%)
Place of birth for the foreign-born population - Morocco (%)
Place of birth for the foreign-born population - Sudan (%)
Place of birth for the foreign-born population - Other Northern Africa (%)
Place of birth for the foreign-born population - South Africa (%)
Place of birth for the foreign-born population - Other Southern Africa (%)
Place of birth for the foreign-born population - Cabo Verde (%)
Place of birth for the foreign-born population - Ghana (%)
Place of birth for the foreign-born population - Liberia (%)
Place of birth for the foreign-born population - Nigeria (%)
Place of birth for the foreign-born population - Senegal (%)
Place of birth for the foreign-born population - Sierra Leone (%)
Place of birth for the foreign-born population - Other Western Africa (%)
Place of birth for the foreign-born population - Australia (%)
Place of birth for the foreign-born population - New Zealand (%)
Place of birth for the foreign-born population - Fiji (%)
Place of birth for the foreign-born population - Micronesia (%)
Place of birth for the foreign-born population - Bahamas (%)
Place of birth for the foreign-born population - Barbados (%)
Place of birth for the foreign-born population - Cuba (%)
Place of birth for the foreign-born population - Dominica (%)
Place of birth for the foreign-born population - Dominican Republic (%)
Place of birth for the foreign-born population - Grenada (%)
Place of birth for the foreign-born population - Haiti (%)
Place of birth for the foreign-born population - Jamaica (%)
Place of birth for the foreign-born population - St. Vincent and the Grenadines (%)
Place of birth for the foreign-born population - Trinidad and Tobago (%)
Place of birth for the foreign-born population - West Indies (%)
Place of birth for the foreign-born population - Other Caribbean (%)
Place of birth for the foreign-born population - Belize (%)
Place of birth for the foreign-born population - Costa Rica (%)
Place of birth for the foreign-born population - El Salvador (%)
Place of birth for the foreign-born population - Guatemala (%)
Place of birth for the foreign-born population - Honduras (%)
Place of birth for the foreign-born population - Mexico (%)
Place of birth for the foreign-born population - Nicaragua (%)
Place of birth for the foreign-born population - Panama (%)
Place of birth for the foreign-born population - Other Central America (%)
Place of birth for the foreign-born population - Argentina (%)
Place of birth for the foreign-born population - Bolivia (%)
Place of birth for the foreign-born population - Brazil (%)
Place of birth for the foreign-born population - Chile (%)
Place of birth for the foreign-born population - Colombia (%)
Place of birth for the foreign-born population - Ecuador (%)
Place of birth for the foreign-born population - Guyana (%)
Place of birth for the foreign-born population - Peru (%)
Place of birth for the foreign-born population - Uruguay (%)
Place of birth for the foreign-born population - Venezuela (%)
Place of birth for the foreign-born population - Other South America (%)
Place of birth for the foreign-born population - Canada (%)
Place of birth for the foreign-born population - Other Northern America (%)
Place of birth for the foreign-born population - Other (%)
Latest news about races in Bremerton, WA collected exclusively by city-data.com from local newspapers, TV, and radio stations
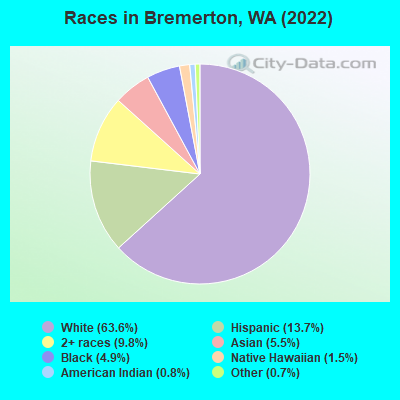
According to 2022 data, the most numerous races in Bremerton, WA are White alone (28,186 residents), Hispanic (6,073 residents), and Asian alone (2,452 residents). 88.3% of Bremerton residents speak English at home. 8.0% of Bremerton, WA residents are foreign-born (3.7% born in Asia, 2.1% born in Latin America), which is 86.8% less than the foreign-born rate of 15.0% across the entire state of Washington.
Race distribution in Bremerton
2000 2022
26,950 72.3% White alone 2,723 7.3% Black alone 2,457 6.6% Hispanic 2,037 5.5% Two or more races 2,005 5.4% Asian alone 646 1.7% American Indian alone 314 0.8% Native Hawaiian and Other 127 0.3% Other race alone
28,186 63.6% White alone 6,073 13.7% Hispanic 4,326 9.8% Two or more races 2,452 5.5% Asian alone 2,189 4.9% Black alone 656 1.5% Native Hawaiian and Other 333 0.8% American Indian alone 317 0.7% Other race alone
2000 2022
4,652,490 78.9% White alone 441,509 7.5% Hispanic 319,401 5.4% Asian alone 184,631 3.1% Black alone 175,926 3.0% Two or more races 85,396 1.4% American Indian alone 22,779 0.4% Native Hawaiian and Other 11,989 0.2% Other race alone
4,941,456 63.5% White alone 1,093,313 14.0% Hispanic 755,832 9.7% Asian alone 523,448 6.7% Two or more races 299,537 3.8% Black alone 69,024 0.9% American Indian alone 52,231 0.7% Native Hawaiian and Other 50,945 0.7% Other race alone
Income and house value in Bremerton Median household income in 2022 $71,038 White non-Hispanic householders$65,223 Black householders$51,368 American Indian and Alaska Native householders$108,240 Asian householders$39,707 Some other race householders$67,044 Two or more races householders$48,255 Hispanic or Latino race householdersMedian 2022 house value $442,189 White Non-Hispanic householders$482,850 Black or African American householders$375,267 American Indian or Alaska Native householders $400,680 Asian householders$338,842 Native Hawaiian and other Pacific Islander householders$352,395 Some other race householders$413,811 Two or more races householders$331,641 Hispanic or Latino householders
Median age by race in Bremerton
34.6 Median age for White residents32.9 39.0 44.2 Median age for Black or African American residents46.5 38.7 32.4 Median age for American Indian / Alaska Native residents32.0 36.8 41.0 Median age for Asian residents40.5 48.1 27.1 Median age for Native Hawaiian / Pacific Islander residents27.1 40.2 26.5 Median age for Other race residents26.3 26.8 26.2 Median age for Two or more races residents25.0 28.9 35.9 Median age for White alone residents33.8 39.9 25.5 Median age for Hispanic or Latino residents24.7 26.6
Owner/renter occupied households by race in Bremerton
House owners and renters - White residents 6,624 49.7% Owner occupied6,703 50.3% Renter occupiedHouse owners and renters - Black or African American residents 150 18.4% Owner occupied665 81.6% Renter occupiedHouse owners and renters - American Indian / Alaska Native residents 69 37.2% Owner occupied117 62.8% Renter occupiedHouse owners and renters - Asian residents 519 62.9% Owner occupied306 37.1% Renter occupiedHouse owners and renters - Native Hawaiian / Pacific Islander residents 133 73.2% Owner occupied49 26.8% Renter occupiedHouse owners and renters - Other race residents 223 29.0% Owner occupied544 71.0% Renter occupiedHouse owners and renters - Two or more races residents 976 43.7% Owner occupied1,258 56.3% Renter occupiedHouse owners and renters - White alone residents 6,423 50.1% Owner occupied6,386 49.9% Renter occupiedHouse owners and renters - Hispanic or Latino residents 720 37.9% Owner occupied1,180 62.1% Renter occupied
Language usage in Bremerton
English speakers - Total 88.3% of residents of Bremerton speak English at home.
5.7% of residents speak Spanish at home 1,261 52.5% Speak English very well1,142 47.5% Speak English less than very well6.4% of residents speak other language at home 1,903 70.6% Speak English very well794 29.4% Speak English less than very well
English speakers - Born in the United States 94.8% of residents of Bremerton speak English at home.
4.4% of residents speak Spanish at home 783 85.8% Speak English very well130 14.2% Speak English less than very well1.1% of residents speak other language at home 221 96.5% Speak English very well8 3.5% Speak English less than very well
English speakers - Native, born elsewhere 80.9% of residents of Bremerton speak English at home.
10.1% of residents speak Spanish at home 90 81.1% Speak English very well21 18.9% Speak English less than very well9.7% of residents speak other language at home 107 100.0% Speak English very well
English speakers - Foreign-born 21.9% of residents of Bremerton speak English at home.
32.6% of residents speak Spanish at home 99 8.0% Speak English very well1,136 92.0% Speak English less than very well52.3% of residents speak other language at home 1,249 63.0% Speak English very well734 37.0% Speak English less than very well
White (Caucasian) - Speak only English Native:
97.4% (27,253)Foreign-born:
55.7% (336)
White (Caucasian) - Speak another language Native:
2.6% (738)Foreign-born:
41.6% (251)
Black or African American - Speak only English Native:
100.0% (2,172)Foreign-born:
45.6% (85)
Black or African American - Speak another language Native:
0.5% (10)Foreign-born:
57.5% (107)
Asian - Speak only English Native:
79.8% (677)Foreign-born:
21.8% (327)
Asian - Speak another language Native:
18.3% (155)Foreign-born:
78.0% (1,173)
Native Hawaiian / Pacific Islander - Speak only English Native:
79.7% (424)Foreign-born:
19.9% (48)
Native Hawaiian / Pacific Islander - Speak another language Native:
14.9% (79)Foreign-born:
79.4% (193)
Other race - Speak only English Native:
68.8% (973)Foreign-born:
1.3% (12)
Other race - Speak another language Native:
30.6% (433)Foreign-born:
100.0% (901)
Two or more races - Speak only English Native:
91.3% (4,780)Foreign-born:
8.3% (21)
Two or more races - Speak another language Native:
7.8% (406)Foreign-born:
96.8% (249)
White alone - Speak only English Native:
98.8% (26,120)Foreign-born:
54.0% (301)
White alone - Speak another language Native:
1.2% (327)Foreign-born:
41.9% (234)
Hispanic or Latino - Speak only English Native:
71.3% (2,922)Foreign-born:
4.0% (50)
Hispanic or Latino - Speak another language Native:
28.9% (1,183)Foreign-born:
99.0% (1,222)
Foreign-born residents in Bremerton 3,561 residents are foreign born (3.7% Asia , 2.1% Latin America ).
This city:
8.0%Washington:
14.9%
Marital status for residents in Bremerton Marital status - White (Caucasian) population 15 years and over
Males 47.4% Never married36.4% Now married1.4% Separated2.8% Widowed12.0% DivorcedFemales 28.7% Never married36.3% Now married3.3% Separated9.1% Widowed22.5% DivorcedWomen who gave birth in the past 12 months Now married:
66.2% (350)Unmarried:
33.8% (179)
Women who did not give birth in the past 12 months Now married:
38.8% (2,486)Unmarried:
61.2% (3,927)
Marital status - Black or African American population 15 years and over
Males 40.0% Never married37.9% Now married1.5% Separated0.5% Widowed20.2% DivorcedFemales 44.2% Never married24.5% Now married4.9% Separated9.9% Widowed16.4% DivorcedWomen who gave birth in the past 12 months Now married:
100.0% (11)Unmarried:
0.0% (0)
Women who did not give birth in the past 12 months Now married:
18.7% (87)Unmarried:
81.3% (379)
Marital status - American Indian / Alaska Native population 15 years and over
Males 50.2% Never married27.8% Now married2.2% Separated0.0% Widowed19.9% DivorcedFemales 23.5% Never married48.5% Now married11.0% Separated0.0% Widowed17.0% DivorcedWomen who did not give birth in the past 12 months Now married:
51.8% (103)Unmarried:
48.2% (96)
Marital status - Asian population 15 years and over
Males 49.9% Never married42.0% Now married1.4% Separated0.9% Widowed5.8% DivorcedFemales 25.2% Never married55.6% Now married0.0% Separated12.1% Widowed7.2% DivorcedWomen who gave birth in the past 12 months Now married:
0.0% (0)Unmarried:
100.0% (25)
Women who did not give birth in the past 12 months Now married:
59.2% (361)Unmarried:
40.8% (249)
Marital status - Native Hawaiian / Pacific Islander population 15 years and over
Males 52.6% Never married14.4% Now married0.0% Separated0.0% Widowed32.9% DivorcedFemales 34.0% Never married60.5% Now married0.0% Separated0.0% Widowed5.6% DivorcedWomen who did not give birth in the past 12 months Now married:
54.4% (93)Unmarried:
45.6% (78)
Marital status - Other race population 15 years and over
Males 48.8% Never married40.8% Now married2.0% Separated0.0% Widowed8.5% DivorcedFemales 33.3% Never married62.2% Now married0.0% Separated3.0% Widowed1.5% DivorcedWomen who gave birth in the past 12 months Now married:
100.0% (20)Unmarried:
0.0% (0)
Women who did not give birth in the past 12 months Now married:
59.0% (437)Unmarried:
41.0% (303)
Marital status - Two or more races population 15 years and over
Males 69.2% Never married18.4% Now married0.0% Separated3.8% Widowed8.5% DivorcedFemales 47.5% Never married29.8% Now married2.0% Separated10.3% Widowed10.5% DivorcedWomen who gave birth in the past 12 months Now married:
55.2% (172)Unmarried:
44.8% (140)
Women who did not give birth in the past 12 months Now married:
27.3% (447)Unmarried:
72.7% (1,188)
Marital status - White alone, not Hispanic / Latino population 15 years and over
Males 46.6% Never married36.4% Now married1.5% Separated2.9% Widowed12.7% DivorcedFemales 29.0% Never married36.0% Now married3.3% Separated9.6% Widowed22.1% DivorcedWomen who gave birth in the past 12 months Now married:
65.1% (330)Unmarried:
34.9% (177)
Women who did not give birth in the past 12 months Now married:
38.7% (2,321)Unmarried:
61.3% (3,671)
Marital status - Hispanic or Latino population 15 years and over
Males 54.6% Never married34.7% Now married1.1% Separated3.3% Widowed6.2% DivorcedFemales 34.4% Never married46.6% Now married3.0% Separated0.7% Widowed15.3% DivorcedWomen who gave birth in the past 12 months Now married:
97.8% (135)Unmarried:
2.2% (3)
Women who did not give birth in the past 12 months Now married:
45.3% (733)Unmarried:
54.7% (886)
Ancestries in Bremerton
1,821 9.6% German1,696 8.9% European1,555 8.2% English1,204 6.3% American1,065 5.6% Irish525 2.8% Norwegian350 1.8% Italian260 1.4% Swedish207 1.1% Scottish164 0.9% Scandinavian152 0.8% Dutch118 0.6% Northern European118 0.6% French105 0.6% British93 0.5% Polish81 0.4% Scotch-Irish76 0.4% French Canadian72 0.4% Danish57 0.3% Icelander54 0.3% Moroccan52 0.3% African47 0.2% Eastern European46 0.2% Austrian46 0.2% Portuguese46 0.2% Welsh45 0.2% Russian45 0.2% Canadian44 0.2% Croatian28 0.1% Ghanaian27 0.1% Finnish23 0.1% Jamaican20 0.1% Guyanese19 0.1% Greek17 0.09% Swiss15 0.08% Hungarian15 0.08% Czechoslovakian11 0.06% Iranian11 0.06% Czech10 0.05% Barbadian9 0.05% Romanian7 0.04% Ukrainian6 0.03% Slovak5 0.03% Lebanese3 0.02% Brazilian3 0.02% Slavic3 0.02% Trinidadian and Tobagonian1 0.01% Somali1 0.01% Bermudan
Geographical mobility in Bremerton Same house 1 year ago 21,777 73.6% White (Caucasian)1,657 67.3% Black or African American400 86.3% American Indian / Alaska Native2,202 90.0% Asian486 59.7% Native Hawaiian / Pacific Islander1,925 84.3% Other race4,350 71.6% Two or more races20,503 73.6% White alone, not Hispanic / Latino4,260 73.3% Hispanic or LatinoMoved within same county 5,172 17.5% White / Caucasian230 9.4% Black or African American35 7.5% American Indian / Alaska Native145 5.9% Asian50 6.1% Native Hawaiian / Pacific Islander160 7.0% Other race760 12.5% Two or more races5,070 18.2% White alone, not Hispanic / Latino597 10.3% Hispanic or LatinoMoved within same state 863 2.9% White / Caucasian170 6.9% Black or African American6 1.3% American Indian / Alaska Native59 2.4% Asian12 1.5% Native Hawaiian / Pacific Islander73 3.2% Other race311 5.1% Two or more races840 3.0% White alone, not Hispanic / Latino175 3.0% Hispanic or LatinoMoved from different state 2,419 8.2% White / Caucasian387 15.7% Black or African American16 3.4% American Indian / Alaska Native103 4.2% Asian32 3.9% Native Hawaiian / Pacific Islander111 4.9% Other race602 9.9% Two or more races2,083 7.5% White alone, not Hispanic / Latino683 11.8% Hispanic or LatinoMoved from abroad 61 0.2% White18 0.7% Black or African American186 22.8% Native Hawaiian / Pacific Islander24 1.0% Other race56 0.9% Two or more races58 0.2% White alone, not Hispanic / Latino40 0.7% Hispanic or Latino
Children Nativity (place of birth) in Bremerton
Children under 6 years - Living with two parents Both parents native 1,426 99.8% Native4 0.2% Foreign-bornBoth parents foreign-born 88 78.5% Native24 21.5% Foreign-bornOne native, one foreign-born parent 159 96.4% Native6 3.6% Foreign-bornChildren under 6 years - Living with one parent Native parent 998 100.0% NativeForeign-born parent 68 100.0% NativeChildren 6 to 17 years - Living with two parents Both parents native 1,637 100.0% NativeBoth parents foreign-born 96 32.6% Native199 67.4% Foreign-bornOne native, one foreign-born parent 169 100.0% NativeChildren 6 to 17 years - Living with one parent Native parent 1,793 100.0% NativeForeign-born parent 205 62.9% Native121 37.1% Foreign-born
Grandparents responsible for own grandchildren in Bremerton
Grandparents (30 to 59 years) White / Caucasian 38 27.2% Responsible for grandchildren102 72.8% Not responsible for grandchildrenBlack or African American 26 100.0% Not responsible for grandchildrenAmerican Indian / Alaska Native 6 29.8% Responsible for grandchildren15 70.2% Not responsible for grandchildrenAsian 13 73.4% Responsible for grandchildren5 26.6% Not responsible for grandchildrenNative Hawaiian / Pacific Islander 43 100.0% Not responsible for grandchildrenOther race 9 18.7% Responsible for grandchildren41 81.3% Not responsible for grandchildrenTwo or more races 28 100.0% Responsible for grandchildrenWhite alone, not Hispanic / Latino 39 28.7% Responsible for grandchildren98 71.3% Not responsible for grandchildrenHispanic or Latino 13 19.8% Responsible for grandchildren52 80.2% Not responsible for grandchildrenGrandparents (60 years and over) White / Caucasian 7 2.7% Responsible for grandchildren260 97.3% Not responsible for grandchildrenAsian 4 30.2% Responsible for grandchildren10 69.8% Not responsible for grandchildrenOther race 7 100.0% Not responsible for grandchildrenWhite alone, not Hispanic / Latino 7 2.7% Responsible for grandchildren253 97.3% Not responsible for grandchildren