Races in Boynton Beach, Florida (FL) Detailed Stats
Data:
Races - White alone (%)
Races - White alone (% change since 2000)
Races - Black alone (%)
Races - Black alone (% change since 2000)
Races - American Indian alone (%)
Races - American Indian alone (% change since 2000)
Races - Asian alone (%)
Races - Asian alone (% change since 2000)
Races - Hispanic (%)
Races - Hispanic (% change since 2000)
Races - Native Hawaiian and Other Pacific Islander alone (%)
Races - Native Hawaiian and Other Pacific Islander alone (% change since 2000)
Races - Two or more races(%)
Races - Two or more races(% change since 2000)
Races - Other race alone (%)
Races - Other race alone (% change since 2000)
Racial diversity
Place of birth - Born in state of residence (%)
Place of birth - Born in state of residence (%) - White
Place of birth - Born in state of residence (%) - Black or African American
Place of birth - Born in state of residence (%) - Asian
Place of birth - Born in state of residence (%) - Hispanic or Latino
Place of birth - Born in state of residence (%) - American Indian and Alaska Native
Place of birth - Born in state of residence (%) - Multirace
Place of birth - Born in state of residence (%) - Other Race
Place of birth - Born in other state (%)
Place of birth - Born in other state (%) - White
Place of birth - Born in other state (%) - Black or African American
Place of birth - Born in other state (%) - Asian
Place of birth - Born in other state (%) - Hispanic or Latino
Place of birth - Born in other state (%) - American Indian and Alaska Native
Place of birth - Born in other state (%) - Multirace
Place of birth - Born in other state (%) - Other Race
Place of birth - Native, outside of US (%)
Place of birth - Native, outside of US (%) - White
Place of birth - Native, outside of US (%) - Black or African American
Place of birth - Native, outside of US (%) - Asian
Place of birth - Native, outside of US (%) - Hispanic or Latino
Place of birth - Native, outside of US (%) - American Indian and Alaska Native
Place of birth - Native, outside of US (%) - Multirace
Place of birth - Native, outside of US (%) - Other Race
Place of birth - Foreign born (%)
Place of birth - Foreign born (%) - White
Place of birth - Foreign born (%) - Black or African American
Place of birth - Foreign born (%) - Asian
Place of birth - Foreign born (%) - Hispanic or Latino
Place of birth - Foreign born (%) - American Indian and Alaska Native
Place of birth - Foreign born (%) - Multirace
Place of birth - Foreign born (%) - Other Race
Residents speaking English at home (%)
Residents speaking English at home - Born in the United States (%)
Residents speaking English at home - Native, born elsewhere (%)
Residents speaking English at home - Foreign born (%)
Residents speaking Spanish at home (%)
Residents speaking Spanish at home - Born in the United States (%)
Residents speaking Spanish at home - Native, born elsewhere (%)
Residents speaking Spanish at home - Foreign born (%)
Residents speaking other language at home (%)
Residents speaking other language at home - Born in the United States (%)
Residents speaking other language at home - Native, born elsewhere (%)
Residents speaking other language at home - Foreign born (%)
Marital status - Never married (%)
Marital status - Now married (%)
Marital status - Separated (%)
Marital status - Widowed (%)
Marital status - Divorced (%)
Ancestries Reported - Arab (%)
Ancestries Reported - Czech (%)
Ancestries Reported - Danish (%)
Ancestries Reported - Dutch (%)
Ancestries Reported - English (%)
Ancestries Reported - French (%)
Ancestries Reported - French Canadian (%)
Ancestries Reported - German (%)
Ancestries Reported - Greek (%)
Ancestries Reported - Hungarian (%)
Ancestries Reported - Irish (%)
Ancestries Reported - Italian (%)
Ancestries Reported - Lithuanian (%)
Ancestries Reported - Norwegian (%)
Ancestries Reported - Polish (%)
Ancestries Reported - Portuguese (%)
Ancestries Reported - Russian (%)
Ancestries Reported - Scotch-Irish (%)
Ancestries Reported - Scottish (%)
Ancestries Reported - Slovak (%)
Ancestries Reported - Subsaharan African (%)
Ancestries Reported - Swedish (%)
Ancestries Reported - Swiss (%)
Ancestries Reported - Ukrainian (%)
Ancestries Reported - United States (%)
Ancestries Reported - Welsh (%)
Ancestries Reported - West Indian (%)
Ancestries Reported - Other (%)
Geographical mobility - Same house 1 year ago (%)
Geographical mobility - Same house 1 year ago (%) - White
Geographical mobility - Same house 1 year ago (%) - Black or African American
Geographical mobility - Same house 1 year ago (%) - Asian
Geographical mobility - Same house 1 year ago (%) - Hispanic or Latino
Geographical mobility - Same house 1 year ago (%) - American Indian and Alaska Native
Geographical mobility - Same house 1 year ago (%) - Multirace
Geographical mobility - Same house 1 year ago (%) - Other Race
Geographical mobility - Moved within same county (%)
Geographical mobility - Moved within same county (%) - White
Geographical mobility - Moved within same county (%) - Black or African American
Geographical mobility - Moved within same county (%) - Asian
Geographical mobility - Moved within same county (%) - Hispanic or Latino
Geographical mobility - Moved within same county (%) - American Indian and Alaska Native
Geographical mobility - Moved within same county (%) - Multirace
Geographical mobility - Moved within same county (%) - Other Race
Geographical mobility - Moved from different county within same state (%)
Geographical mobility - Moved from different county within same state (%) - White
Geographical mobility - Moved from different county within same state (%) - Black or African American
Geographical mobility - Moved from different county within same state (%) - Asian
Geographical mobility - Moved from different county within same state (%) - Hispanic or Latino
Geographical mobility - Moved from different county within same state (%) - American Indian and Alaska Native
Geographical mobility - Moved from different county within same state (%) - Multirace
Geographical mobility - Moved from different county within same state (%) - Other Race
Geographical mobility - Moved from different state (%)
Geographical mobility - Moved from different state (%) - White
Geographical mobility - Moved from different state (%) - Black or African American
Geographical mobility - Moved from different state (%) - Asian
Geographical mobility - Moved from different state (%) - Hispanic or Latino
Geographical mobility - Moved from different state (%) - American Indian and Alaska Native
Geographical mobility - Moved from different state (%) - Multirace
Geographical mobility - Moved from different state (%) - Other Race
Geographical mobility - Moved from abroad (%)
Geographical mobility - Moved from abroad (%) - White
Geographical mobility - Moved from abroad (%) - Black or African American
Geographical mobility - Moved from abroad (%) - Asian
Geographical mobility - Moved from abroad (%) - Hispanic or Latino
Geographical mobility - Moved from abroad (%) - American Indian and Alaska Native
Geographical mobility - Moved from abroad (%) - Multirace
Geographical mobility - Moved from abroad (%) - Other Race
Place of birth for the foreign-born population - Ireland (%)
Place of birth for the foreign-born population - Denmark (%)
Place of birth for the foreign-born population - Norway (%)
Place of birth for the foreign-born population - Sweden (%)
Place of birth for the foreign-born population - United Kingdom (%)
Place of birth for the foreign-born population - England (%)
Place of birth for the foreign-born population - Scotland (%)
Place of birth for the foreign-born population - Other Northern Europe (%)
Place of birth for the foreign-born population - Austria (%)
Place of birth for the foreign-born population - Belgium (%)
Place of birth for the foreign-born population - France (%)
Place of birth for the foreign-born population - Germany (%)
Place of birth for the foreign-born population - Netherlands (%)
Place of birth for the foreign-born population - Switzerland (%)
Place of birth for the foreign-born population - Other Western Europe (%)
Place of birth for the foreign-born population - Greece (%)
Place of birth for the foreign-born population - Italy (%)
Place of birth for the foreign-born population - Portugal (%)
Place of birth for the foreign-born population - Spain (%)
Place of birth for the foreign-born population - Other Southern Europe (%)
Place of birth for the foreign-born population - Albania (%)
Place of birth for the foreign-born population - Belarus (%)
Place of birth for the foreign-born population - Bosnia and Herzegovina (%)
Place of birth for the foreign-born population - Bulgaria (%)
Place of birth for the foreign-born population - Croatia (%)
Place of birth for the foreign-born population - Czechoslovakia (%)
Place of birth for the foreign-born population - Hungary (%)
Place of birth for the foreign-born population - Latvia (%)
Place of birth for the foreign-born population - Lithuania (%)
Place of birth for the foreign-born population - North Macedonia (Macedonia) (%)
Place of birth for the foreign-born population - Moldova (%)
Place of birth for the foreign-born population - Poland (%)
Place of birth for the foreign-born population - Romania (%)
Place of birth for the foreign-born population - Russia (%)
Place of birth for the foreign-born population - Serbia (%)
Place of birth for the foreign-born population - Ukraine (%)
Place of birth for the foreign-born population - Other Eastern Europe (%)
Place of birth for the foreign-born population - China (%)
Place of birth for the foreign-born population - Hong Kong (%)
Place of birth for the foreign-born population - Taiwan (%)
Place of birth for the foreign-born population - Japan (%)
Place of birth for the foreign-born population - Korea (%)
Place of birth for the foreign-born population - Other Eastern Asia (%)
Place of birth for the foreign-born population - Afghanistan (%)
Place of birth for the foreign-born population - Bangladesh (%)
Place of birth for the foreign-born population - India (%)
Place of birth for the foreign-born population - Iran (%)
Place of birth for the foreign-born population - Kazakhstan (%)
Place of birth for the foreign-born population - Nepal (%)
Place of birth for the foreign-born population - Pakistan (%)
Place of birth for the foreign-born population - Sri Lanka (%)
Place of birth for the foreign-born population - Uzbekistan (%)
Place of birth for the foreign-born population - Other South Central Asia (%)
Place of birth for the foreign-born population - Burma (%)
Place of birth for the foreign-born population - Cambodia (%)
Place of birth for the foreign-born population - Indonesia (%)
Place of birth for the foreign-born population - Laos (%)
Place of birth for the foreign-born population - Malaysia (%)
Place of birth for the foreign-born population - Philippines (%)
Place of birth for the foreign-born population - Singapore (%)
Place of birth for the foreign-born population - Thailand (%)
Place of birth for the foreign-born population - Vietnam (%)
Place of birth for the foreign-born population - Other South Eastern Asia (%)
Place of birth for the foreign-born population - Armenia (%)
Place of birth for the foreign-born population - Iraq (%)
Place of birth for the foreign-born population - Israel (%)
Place of birth for the foreign-born population - Jordan (%)
Place of birth for the foreign-born population - Kuwait (%)
Place of birth for the foreign-born population - Lebanon (%)
Place of birth for the foreign-born population - Saudi Arabia (%)
Place of birth for the foreign-born population - Syria (%)
Place of birth for the foreign-born population - Turkey (%)
Place of birth for the foreign-born population - Yemen (%)
Place of birth for the foreign-born population - Other Western Asia (%)
Place of birth for the foreign-born population - Eritrea (%)
Place of birth for the foreign-born population - Ethiopia (%)
Place of birth for the foreign-born population - Kenya (%)
Place of birth for the foreign-born population - Somalia (%)
Place of birth for the foreign-born population - Uganda (%)
Place of birth for the foreign-born population - Zimbabwe (%)
Place of birth for the foreign-born population - Other Eastern Africa (%)
Place of birth for the foreign-born population - Cameroon (%)
Place of birth for the foreign-born population - Congo (%)
Place of birth for the foreign-born population - Democratic Republic of Congo (Zaire) (%)
Place of birth for the foreign-born population - Other Middle Africa (%)
Place of birth for the foreign-born population - Egypt (%)
Place of birth for the foreign-born population - Morocco (%)
Place of birth for the foreign-born population - Sudan (%)
Place of birth for the foreign-born population - Other Northern Africa (%)
Place of birth for the foreign-born population - South Africa (%)
Place of birth for the foreign-born population - Other Southern Africa (%)
Place of birth for the foreign-born population - Cabo Verde (%)
Place of birth for the foreign-born population - Ghana (%)
Place of birth for the foreign-born population - Liberia (%)
Place of birth for the foreign-born population - Nigeria (%)
Place of birth for the foreign-born population - Senegal (%)
Place of birth for the foreign-born population - Sierra Leone (%)
Place of birth for the foreign-born population - Other Western Africa (%)
Place of birth for the foreign-born population - Australia (%)
Place of birth for the foreign-born population - New Zealand (%)
Place of birth for the foreign-born population - Fiji (%)
Place of birth for the foreign-born population - Micronesia (%)
Place of birth for the foreign-born population - Bahamas (%)
Place of birth for the foreign-born population - Barbados (%)
Place of birth for the foreign-born population - Cuba (%)
Place of birth for the foreign-born population - Dominica (%)
Place of birth for the foreign-born population - Dominican Republic (%)
Place of birth for the foreign-born population - Grenada (%)
Place of birth for the foreign-born population - Haiti (%)
Place of birth for the foreign-born population - Jamaica (%)
Place of birth for the foreign-born population - St. Vincent and the Grenadines (%)
Place of birth for the foreign-born population - Trinidad and Tobago (%)
Place of birth for the foreign-born population - West Indies (%)
Place of birth for the foreign-born population - Other Caribbean (%)
Place of birth for the foreign-born population - Belize (%)
Place of birth for the foreign-born population - Costa Rica (%)
Place of birth for the foreign-born population - El Salvador (%)
Place of birth for the foreign-born population - Guatemala (%)
Place of birth for the foreign-born population - Honduras (%)
Place of birth for the foreign-born population - Mexico (%)
Place of birth for the foreign-born population - Nicaragua (%)
Place of birth for the foreign-born population - Panama (%)
Place of birth for the foreign-born population - Other Central America (%)
Place of birth for the foreign-born population - Argentina (%)
Place of birth for the foreign-born population - Bolivia (%)
Place of birth for the foreign-born population - Brazil (%)
Place of birth for the foreign-born population - Chile (%)
Place of birth for the foreign-born population - Colombia (%)
Place of birth for the foreign-born population - Ecuador (%)
Place of birth for the foreign-born population - Guyana (%)
Place of birth for the foreign-born population - Peru (%)
Place of birth for the foreign-born population - Uruguay (%)
Place of birth for the foreign-born population - Venezuela (%)
Place of birth for the foreign-born population - Other South America (%)
Place of birth for the foreign-born population - Canada (%)
Place of birth for the foreign-born population - Other Northern America (%)
Place of birth for the foreign-born population - Other (%)
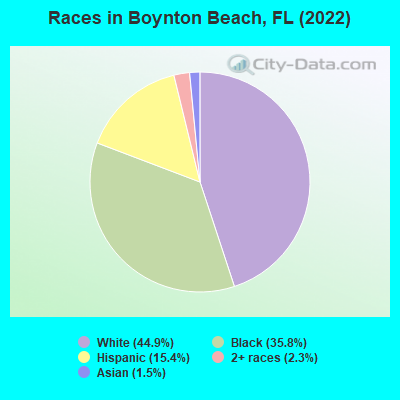
According to 2022 data, the most numerous races in Boynton Beach, FL are White alone (36,323 residents), Hispanic (12,431 residents), and Black alone (28,950 residents). 61.6% of Boynton Beach residents speak English at home. 29.4% of Boynton Beach, FL residents are foreign-born (23.2% born in Latin America), which is 28.7% greater than the foreign-born rate of 21.0% across the entire state of Florida.
Race distribution in Boynton Beach
2000 2022
10,458,509 65.4% White alone 2,682,715 16.8% Hispanic 2,264,268 14.2% Black alone 261,693 1.6% Asian alone 236,954 1.5% Two or more races 42,358 0.3% American Indian alone 28,994 0.2% Other race alone 6,887 0.04% Native Hawaiian and Other
11,309,403 50.8% White alone 6,025,039 27.1% Hispanic 3,241,015 14.6% Black alone 861,630 3.9% Two or more races 623,692 2.8% Asian alone 152,054 0.7% Other race alone 22,504 0.1% American Indian alone 9,486 0.04% Native Hawaiian and Other
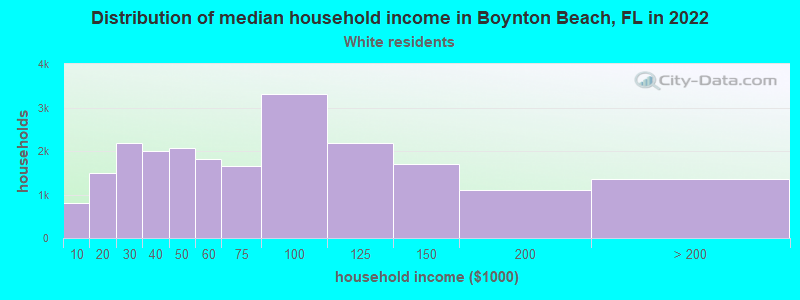
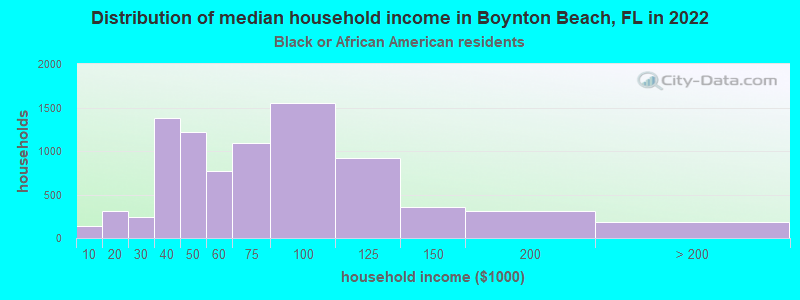
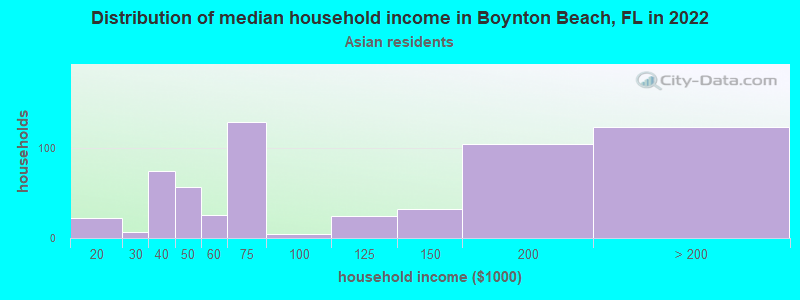
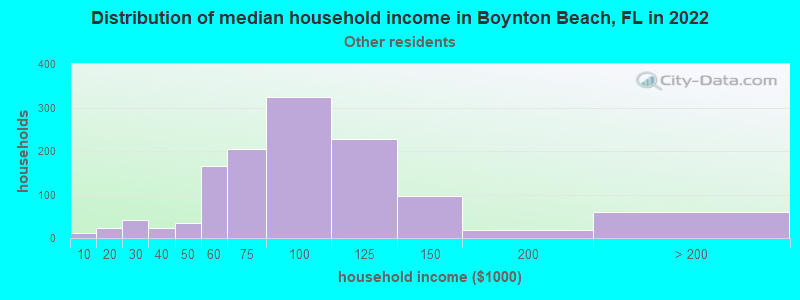
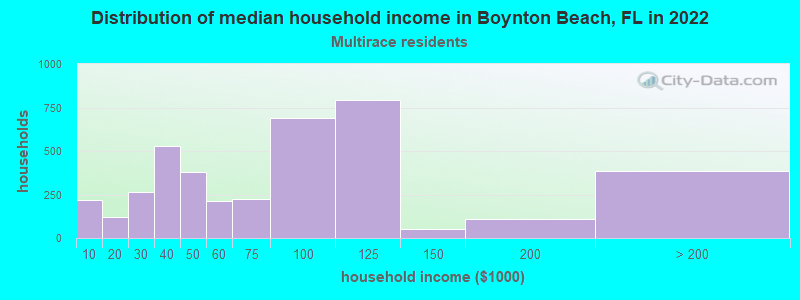
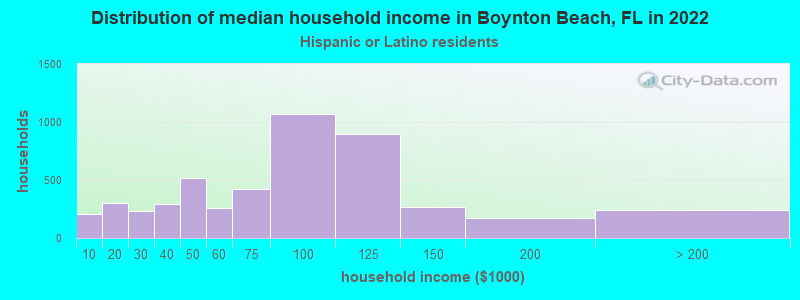
Income and house value in Boynton Beach Median household income in 2022 $64,292 White non-Hispanic householders$62,856 Black householders$86,195 Asian householders$85,515 Some other race householders$99,549 Two or more races householders$72,159 Hispanic or Latino race householdersMedian 2022 house value $397,439 White Non-Hispanic householders$284,430 Black or African American householders$361,170 American Indian or Alaska Native householders $677,671 Asian householders$429,509 Native Hawaiian and other Pacific Islander householders$377,968 Some other race householders$281,376 Two or more races householders$348,571 Hispanic or Latino householders
Median age by race in Boynton Beach
58.6 Median age for White residents60.2 56.9 34.1 Median age for Black or African American residents34.4 32.6 -666,666,666.0 Median age for American Indian / Alaska Native residents-666,666,666.0 -666,666,666.0 50.8 Median age for Asian residents52.1 46.5 -666,666,666.0 Median age for Native Hawaiian / Pacific Islander residents-666,666,666.0 -666,666,666.0 36.3 Median age for Other race residents32.3 39.5 42.7 Median age for Two or more races residents37.0 45.6 59.5 Median age for White alone residents60.7 58.3 39.8 Median age for Hispanic or Latino residents37.9 40.4
Owner/renter occupied households by race in Boynton Beach
House owners and renters - White residents 15,355 70.7% Owner occupied6,353 29.3% Renter occupiedHouse owners and renters - Black or African American residents 5,053 59.4% Owner occupied3,449 40.6% Renter occupiedHouse owners and renters - Asian residents 342 63.5% Owner occupied197 36.5% Renter occupiedHouse owners and renters - Other race residents 342 29.0% Owner occupied838 71.0% Renter occupiedHouse owners and renters - Two or more races residents 2,831 75.8% Owner occupied904 24.2% Renter occupiedHouse owners and renters - White alone residents 14,903 71.1% Owner occupied6,053 28.9% Renter occupiedHouse owners and renters - Hispanic or Latino residents 3,163 72.9% Owner occupied1,173 27.1% Renter occupied
Language usage in Boynton Beach
English speakers - Total 61.6% of residents of Boynton Beach speak English at home.
12.1% of residents speak Spanish at home 5,674 60.1% Speak English very well3,768 39.9% Speak English less than very well26.3% of residents speak other language at home 14,916 73.0% Speak English very well5,513 27.0% Speak English less than very well
English speakers - Born in the United States 89.9% of residents of Boynton Beach speak English at home.
5.3% of residents speak Spanish at home 1,642 96.1% Speak English very well66 3.9% Speak English less than very well4.7% of residents speak other language at home 1,452 96.3% Speak English very well56 3.7% Speak English less than very well
English speakers - Native, born elsewhere 46.4% of residents of Boynton Beach speak English at home.
49.2% of residents speak Spanish at home 814 62.4% Speak English very well490 37.6% Speak English less than very well4.3% of residents speak other language at home 115 100.0% Speak English very well
English speakers - Foreign-born 20.0% of residents of Boynton Beach speak English at home.
19.1% of residents speak Spanish at home 1,346 30.2% Speak English very well3,105 69.8% Speak English less than very well61.0% of residents speak other language at home 8,931 62.8% Speak English very well5,295 37.2% Speak English less than very well
White (Caucasian) - Speak only English Native:
89.0% (30,509)Foreign-born:
43.3% (1,586)
White (Caucasian) - Speak another language Native:
11.0% (3,764)Foreign-born:
56.7% (2,075)
Black or African American - Speak only English Native:
68.3% (9,734)Foreign-born:
14.7% (1,973)
Black or African American - Speak another language Native:
31.7% (4,508)Foreign-born:
85.3% (11,489)
Asian - Speak only English Native:
88.0% (298)Foreign-born:
17.0% (215)
Asian - Speak another language Native:
16.9% (57)Foreign-born:
82.8% (1,051)
Other race - Speak another language Native:
47.8% (916)Foreign-born:
100.0% (965)
Two or more races - Speak only English Native:
43.1% (1,520)Foreign-born:
19.2% (858)
Two or more races - Speak another language Native:
56.9% (2,006)Foreign-born:
80.8% (3,611)
White alone - Speak only English Native:
91.8% (29,553)Foreign-born:
42.9% (1,520)
White alone - Speak another language Native:
8.2% (2,651)Foreign-born:
57.1% (2,023)
Hispanic or Latino - Speak only English Native:
42.2% (2,984)Foreign-born:
2.7% (127)
Hispanic or Latino - Speak another language Native:
57.8% (4,095)Foreign-born:
97.3% (4,536)
Foreign-born residents in Boynton Beach 23,952 residents are foreign born (23.2% Latin America ).
This city:
29.4%Florida:
21.1%
Marital status for residents in Boynton Beach Marital status - White (Caucasian) population 15 years and over
Males 27.1% Never married47.9% Now married1.8% Separated5.4% Widowed17.8% DivorcedFemales 34.2% Never married30.8% Now married1.1% Separated16.0% Widowed17.9% DivorcedWomen who gave birth in the past 12 months Now married:
85.1% (99)Unmarried:
14.9% (17)
Women who did not give birth in the past 12 months Now married:
37.9% (2,236)Unmarried:
62.1% (3,669)
Marital status - Black or African American population 15 years and over
Males 38.2% Never married55.4% Now married0.0% Separated0.6% Widowed5.9% DivorcedFemales 48.4% Never married36.2% Now married1.4% Separated7.9% Widowed6.0% DivorcedWomen who gave birth in the past 12 months Now married:
10.6% (60)Unmarried:
89.4% (508)
Women who did not give birth in the past 12 months Now married:
26.7% (1,980)Unmarried:
73.3% (5,441)
Marital status - American Indian / Alaska Native population 15 years and over
Males 0.0% Never married0.0% Now married0.0% Separated100.0% Widowed0.0% DivorcedFemales 0.0% Never married92.9% Now married0.0% Separated7.1% Widowed0.0% DivorcedWomen who did not give birth in the past 12 months Now married:
87.5% (11)Unmarried:
12.5% (2)
Marital status - Asian population 15 years and over
Males 29.3% Never married62.5% Now married1.6% Separated0.9% Widowed5.8% DivorcedFemales 15.0% Never married73.6% Now married0.0% Separated4.0% Widowed7.3% DivorcedWomen who gave birth in the past 12 months Now married:
100.0% (27)Unmarried:
0.0% (0)
Women who did not give birth in the past 12 months Now married:
83.6% (398)Unmarried:
16.4% (78)
Marital status - Other race population 15 years and over
Males 45.1% Never married33.3% Now married3.1% Separated2.0% Widowed16.4% DivorcedFemales 45.5% Never married37.7% Now married0.0% Separated7.8% Widowed9.0% DivorcedWomen who gave birth in the past 12 months Now married:
100.0% (16)Unmarried:
0.0% (0)
Women who did not give birth in the past 12 months Now married:
11.6% (81)Unmarried:
88.4% (613)
Marital status - Two or more races population 15 years and over
Males 42.9% Never married36.6% Now married1.0% Separated0.9% Widowed18.5% DivorcedFemales 40.6% Never married26.7% Now married1.7% Separated3.9% Widowed27.1% DivorcedWomen who gave birth in the past 12 months Now married:
53.8% (59)Unmarried:
46.2% (50)
Women who did not give birth in the past 12 months Now married:
22.5% (745)Unmarried:
77.5% (2,565)
Marital status - White alone, not Hispanic / Latino population 15 years and over
Males 26.7% Never married46.9% Now married1.9% Separated5.7% Widowed18.8% DivorcedFemales 34.2% Never married30.5% Now married0.7% Separated16.6% Widowed18.0% DivorcedWomen who gave birth in the past 12 months Now married:
93.3% (81)Unmarried:
6.7% (6)
Women who did not give birth in the past 12 months Now married:
36.5% (2,112)Unmarried:
63.5% (3,679)
Marital status - Hispanic or Latino population 15 years and over
Males 51.9% Never married42.4% Now married0.8% Separated0.0% Widowed4.9% DivorcedFemales 31.4% Never married45.2% Now married2.6% Separated5.1% Widowed15.7% DivorcedWomen who gave birth in the past 12 months Now married:
77.3% (52)Unmarried:
22.7% (15)
Women who did not give birth in the past 12 months Now married:
28.7% (1,003)Unmarried:
71.3% (2,490)
Ancestries in Boynton Beach
13,668 25.9% Haitian4,351 8.2% American3,092 5.9% Italian3,003 5.7% Irish2,165 4.1% African1,519 2.9% German1,146 2.2% Jamaican1,117 2.1% English956 1.8% Polish613 1.2% European433 0.8% Brazilian385 0.7% Russian310 0.6% Eastern European264 0.5% French240 0.5% Portuguese231 0.4% Scottish204 0.4% Trinidadian and Tobagonian203 0.4% French Canadian193 0.4% South African185 0.4% Hungarian165 0.3% Danish155 0.3% Canadian102 0.2% Croatian101 0.2% British99 0.2% West Indian93 0.2% Romanian86 0.2% Swedish80 0.2% Northern European75 0.1% Czech71 0.1% Greek62 0.1% Scotch-Irish56 0.1% Lebanese54 0.1% Bahamian51 0.10% Czechoslovakian48 0.09% Dutch41 0.08% Lithuanian40 0.08% Swiss40 0.08% Nigerian36 0.07% Ukrainian31 0.06% Latvian29 0.05% Belgian28 0.05% Norwegian27 0.05% Moroccan24 0.05% Guyanese19 0.04% Pennsylvania German17 0.03% Welsh15 0.03% Finnish14 0.03% Bulgarian12 0.02% Slovak11 0.02% Slavic10 0.02% Scandinavian10 0.02% Syrian9 0.02% Israeli9 0.02% Austrian5 0.01% Serbian4 0.01% British West Indian3 0.01% Turkish
Geographical mobility in Boynton Beach Same house 1 year ago 31,342 81.0% White (Caucasian)25,770 94.4% Black or African American32 100.0% American Indian / Alaska Native1,444 87.0% Asian2,166 54.2% Other race10,415 87.3% Two or more races29,250 80.5% White alone, not Hispanic / Latino11,650 80.0% Hispanic or LatinoMoved within same county 4,701 12.1% White / Caucasian1,297 4.7% Black or African American135 8.1% Asian449 11.2% Other race725 6.1% Two or more races4,649 12.8% White alone, not Hispanic / Latino1,405 9.6% Hispanic or LatinoMoved within same state 1,368 3.5% White / Caucasian158 0.6% Black or African American631 15.8% Other race80 0.7% Two or more races1,306 3.6% White alone, not Hispanic / Latino403 2.8% Hispanic or LatinoMoved from different state 1,152 3.0% White / Caucasian140 0.5% Black or African American558 13.9% Other race629 5.3% Two or more races973 2.7% White alone, not Hispanic / Latino613 4.2% Hispanic or LatinoMoved from abroad 145 0.4% White157 0.6% Black or African American367 9.2% Other race96 0.8% Two or more races145 0.4% White alone, not Hispanic / Latino589 4.0% Hispanic or Latino
Children Nativity (place of birth) in Boynton Beach
Children under 6 years - Living with two parents Both parents native 1,253 99.8% Native2 0.2% Foreign-bornBoth parents foreign-born 630 83.0% Native129 17.0% Foreign-bornOne native, one foreign-born parent 335 100.0% NativeChildren under 6 years - Living with one parent Native parent 1,360 100.0% NativeForeign-born parent 613 87.2% Native90 12.8% Foreign-bornChildren 6 to 17 years - Living with two parents Both parents native 1,914 100.0% NativeBoth parents foreign-born 1,480 69.3% Native656 30.7% Foreign-bornOne native, one foreign-born parent 520 100.0% NativeChildren 6 to 17 years - Living with one parent Native parent 1,409 100.0% NativeForeign-born parent 1,960 56.3% Native1,519 43.7% Foreign-born
Place of birth for residents in Boynton Beach 19,839 Americas19,194 Latin America13,407 Caribbean3,626 South America2,405 Europe2,159 Central America1,392 Asia778 Northern Europe759 Eastern Europe645 Northern America546 South Central Asia477 South Eastern Asia457 Western Europe409 Southern Europe315 Africa269 Eastern Asia157 Southern Africa115 China82 Western Asia67 Western Africa48 Eastern Africa42 Northern Africa10,568 Haiti1,327 Venezuela1,087 Jamaica987 Colombia828 Cuba777 Mexico645 Canada599 Guatemala588 Dominican Republic554 El Salvador550 Brazil329 Germany286 Bangladesh279 Peru274 England266 Trinidad and Tobago228 India213 Ireland211 Poland204 Philippines200 United Kingdom186 Vietnam179 Spain169 Honduras157 South Africa153 Italy135 Korea129 Russia126 Uruguay107 Romania105 Ecuador105 China84 France83 Denmark81 Argentina78 Czechoslovakia73 Guyana67 Nigeria61 Croatia56 Chile54 Lebanon47 Thailand45 Portugal42 Panama40 Ukraine37 Bahamas33 Malaysia31 Greece28 Zimbabwe27 Bolivia26 Hungary24 Morocco22 Belgium19 Netherlands18 Japan18 Pakistan17 Sudan15 Israel15 Nicaragua12 Turkey12 Afghanistan11 Latvia10 Hong Kong9 Grenada7 Sweden6 Indonesia3 Serbia
Grandparents responsible for own grandchildren in Boynton Beach
Grandparents (30 to 59 years) White / Caucasian 30 32.9% Responsible for grandchildren60 67.1% Not responsible for grandchildrenBlack or African American 157 100.0% Not responsible for grandchildrenOther race 38 84.3% Responsible for grandchildren7 15.7% Not responsible for grandchildrenTwo or more races 195 100.0% Not responsible for grandchildrenWhite alone, not Hispanic / Latino 35 37.1% Responsible for grandchildren59 62.9% Not responsible for grandchildrenHispanic or Latino 20 11.0% Responsible for grandchildren162 89.0% Not responsible for grandchildrenGrandparents (60 years and over) White / Caucasian 86 32.4% Responsible for grandchildren179 67.6% Not responsible for grandchildrenBlack or African American 222 52.3% Responsible for grandchildren202 47.7% Not responsible for grandchildrenOther race 94 100.0% Not responsible for grandchildrenTwo or more races 229 80.7% Responsible for grandchildren55 19.3% Not responsible for grandchildrenWhite alone, not Hispanic / Latino 103 39.7% Responsible for grandchildren156 60.3% Not responsible for grandchildrenHispanic or Latino 164 50.1% Responsible for grandchildren164 49.9% Not responsible for grandchildren