Races in Bluff City-Piney Flats, Tennessee (TN) Detailed Stats
Ancestries, Foreign-born residents, place of birth
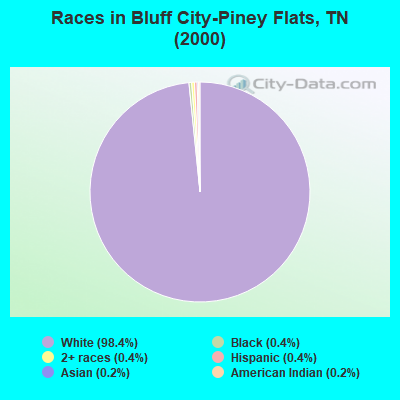
Race distribution in Bluff City-Piney Flats

- 18,95298.4%White alone
- 830.4%Black alone
- 680.4%Hispanic
- 780.4%Two or more races
- 380.2%Asian alone
- 330.2%American Indian alone
- 70.04%Other race alone
- 40.02%Native Hawaiian and Other
Pacific Islander alone
2000
2022
-
- 4,505,93079.2%White alone
- 928,20416.3%Black alone
- 123,8382.2%Hispanic
- 54,8241.0%Two or more races
- 56,0771.0%Asian alone
- 13,8200.2%American Indian alone
- 4,7800.08%Other race alone
- 1,8100.03%Native Hawaiian and Other
Pacific Islander alone

-
- 5,070,02671.9%White alone
- 1,089,73815.5%Black alone
- 442,6296.3%Hispanic
- 279,3814.0%Two or more races
- 131,8171.9%Asian alone
- 26,9720.4%Other race alone
- 6,3870.09%American Indian alone
- 4,3890.06%Native Hawaiian and Other
Pacific Islander alone

Income and house value in Bluff City-Piney Flats
- Median household income in 2022
- $56,276White non-Hispanic householders
- $12,166Black householders
- $147,202Asian householders
- over $200,000Some other race householders
- $33,126Two or more races householders
- $5,219Hispanic or Latino race householders
- Median 2022 house value
- $216,798White Non-Hispanic householders
- $61,291Black or African American householders
- $189,951Asian householders
- $215,278Two or more races householders
- $170,956Hispanic or Latino householders
Household income for White non-Hispanic householders

Household income for Black householders

Household income for Asian householders

Household income for Two or more races householders

Household income for Hispanic or Latino race householders

Zip code: 37618