Races in Bloomingdale, Florida (FL) Detailed Stats
Data:
Races - White alone (%)
Races - White alone (% change since 2000)
Races - Black alone (%)
Races - Black alone (% change since 2000)
Races - American Indian alone (%)
Races - American Indian alone (% change since 2000)
Races - Asian alone (%)
Races - Asian alone (% change since 2000)
Races - Hispanic (%)
Races - Hispanic (% change since 2000)
Races - Native Hawaiian and Other Pacific Islander alone (%)
Races - Native Hawaiian and Other Pacific Islander alone (% change since 2000)
Races - Two or more races(%)
Races - Two or more races(% change since 2000)
Races - Other race alone (%)
Races - Other race alone (% change since 2000)
Racial diversity
Place of birth - Born in state of residence (%)
Place of birth - Born in state of residence (%) - White
Place of birth - Born in state of residence (%) - Black or African American
Place of birth - Born in state of residence (%) - Asian
Place of birth - Born in state of residence (%) - Hispanic or Latino
Place of birth - Born in state of residence (%) - American Indian and Alaska Native
Place of birth - Born in state of residence (%) - Multirace
Place of birth - Born in state of residence (%) - Other Race
Place of birth - Born in other state (%)
Place of birth - Born in other state (%) - White
Place of birth - Born in other state (%) - Black or African American
Place of birth - Born in other state (%) - Asian
Place of birth - Born in other state (%) - Hispanic or Latino
Place of birth - Born in other state (%) - American Indian and Alaska Native
Place of birth - Born in other state (%) - Multirace
Place of birth - Born in other state (%) - Other Race
Place of birth - Native, outside of US (%)
Place of birth - Native, outside of US (%) - White
Place of birth - Native, outside of US (%) - Black or African American
Place of birth - Native, outside of US (%) - Asian
Place of birth - Native, outside of US (%) - Hispanic or Latino
Place of birth - Native, outside of US (%) - American Indian and Alaska Native
Place of birth - Native, outside of US (%) - Multirace
Place of birth - Native, outside of US (%) - Other Race
Place of birth - Foreign born (%)
Place of birth - Foreign born (%) - White
Place of birth - Foreign born (%) - Black or African American
Place of birth - Foreign born (%) - Asian
Place of birth - Foreign born (%) - Hispanic or Latino
Place of birth - Foreign born (%) - American Indian and Alaska Native
Place of birth - Foreign born (%) - Multirace
Place of birth - Foreign born (%) - Other Race
Residents speaking English at home (%)
Residents speaking English at home - Born in the United States (%)
Residents speaking English at home - Native, born elsewhere (%)
Residents speaking English at home - Foreign born (%)
Residents speaking Spanish at home (%)
Residents speaking Spanish at home - Born in the United States (%)
Residents speaking Spanish at home - Native, born elsewhere (%)
Residents speaking Spanish at home - Foreign born (%)
Residents speaking other language at home (%)
Residents speaking other language at home - Born in the United States (%)
Residents speaking other language at home - Native, born elsewhere (%)
Residents speaking other language at home - Foreign born (%)
Marital status - Never married (%)
Marital status - Now married (%)
Marital status - Separated (%)
Marital status - Widowed (%)
Marital status - Divorced (%)
Ancestries Reported - Arab (%)
Ancestries Reported - Czech (%)
Ancestries Reported - Danish (%)
Ancestries Reported - Dutch (%)
Ancestries Reported - English (%)
Ancestries Reported - French (%)
Ancestries Reported - French Canadian (%)
Ancestries Reported - German (%)
Ancestries Reported - Greek (%)
Ancestries Reported - Hungarian (%)
Ancestries Reported - Irish (%)
Ancestries Reported - Italian (%)
Ancestries Reported - Lithuanian (%)
Ancestries Reported - Norwegian (%)
Ancestries Reported - Polish (%)
Ancestries Reported - Portuguese (%)
Ancestries Reported - Russian (%)
Ancestries Reported - Scotch-Irish (%)
Ancestries Reported - Scottish (%)
Ancestries Reported - Slovak (%)
Ancestries Reported - Subsaharan African (%)
Ancestries Reported - Swedish (%)
Ancestries Reported - Swiss (%)
Ancestries Reported - Ukrainian (%)
Ancestries Reported - United States (%)
Ancestries Reported - Welsh (%)
Ancestries Reported - West Indian (%)
Ancestries Reported - Other (%)
Geographical mobility - Same house 1 year ago (%)
Geographical mobility - Same house 1 year ago (%) - White
Geographical mobility - Same house 1 year ago (%) - Black or African American
Geographical mobility - Same house 1 year ago (%) - Asian
Geographical mobility - Same house 1 year ago (%) - Hispanic or Latino
Geographical mobility - Same house 1 year ago (%) - American Indian and Alaska Native
Geographical mobility - Same house 1 year ago (%) - Multirace
Geographical mobility - Same house 1 year ago (%) - Other Race
Geographical mobility - Moved within same county (%)
Geographical mobility - Moved within same county (%) - White
Geographical mobility - Moved within same county (%) - Black or African American
Geographical mobility - Moved within same county (%) - Asian
Geographical mobility - Moved within same county (%) - Hispanic or Latino
Geographical mobility - Moved within same county (%) - American Indian and Alaska Native
Geographical mobility - Moved within same county (%) - Multirace
Geographical mobility - Moved within same county (%) - Other Race
Geographical mobility - Moved from different county within same state (%)
Geographical mobility - Moved from different county within same state (%) - White
Geographical mobility - Moved from different county within same state (%) - Black or African American
Geographical mobility - Moved from different county within same state (%) - Asian
Geographical mobility - Moved from different county within same state (%) - Hispanic or Latino
Geographical mobility - Moved from different county within same state (%) - American Indian and Alaska Native
Geographical mobility - Moved from different county within same state (%) - Multirace
Geographical mobility - Moved from different county within same state (%) - Other Race
Geographical mobility - Moved from different state (%)
Geographical mobility - Moved from different state (%) - White
Geographical mobility - Moved from different state (%) - Black or African American
Geographical mobility - Moved from different state (%) - Asian
Geographical mobility - Moved from different state (%) - Hispanic or Latino
Geographical mobility - Moved from different state (%) - American Indian and Alaska Native
Geographical mobility - Moved from different state (%) - Multirace
Geographical mobility - Moved from different state (%) - Other Race
Geographical mobility - Moved from abroad (%)
Geographical mobility - Moved from abroad (%) - White
Geographical mobility - Moved from abroad (%) - Black or African American
Geographical mobility - Moved from abroad (%) - Asian
Geographical mobility - Moved from abroad (%) - Hispanic or Latino
Geographical mobility - Moved from abroad (%) - American Indian and Alaska Native
Geographical mobility - Moved from abroad (%) - Multirace
Geographical mobility - Moved from abroad (%) - Other Race
Place of birth for the foreign-born population - Ireland (%)
Place of birth for the foreign-born population - Denmark (%)
Place of birth for the foreign-born population - Norway (%)
Place of birth for the foreign-born population - Sweden (%)
Place of birth for the foreign-born population - United Kingdom (%)
Place of birth for the foreign-born population - England (%)
Place of birth for the foreign-born population - Scotland (%)
Place of birth for the foreign-born population - Other Northern Europe (%)
Place of birth for the foreign-born population - Austria (%)
Place of birth for the foreign-born population - Belgium (%)
Place of birth for the foreign-born population - France (%)
Place of birth for the foreign-born population - Germany (%)
Place of birth for the foreign-born population - Netherlands (%)
Place of birth for the foreign-born population - Switzerland (%)
Place of birth for the foreign-born population - Other Western Europe (%)
Place of birth for the foreign-born population - Greece (%)
Place of birth for the foreign-born population - Italy (%)
Place of birth for the foreign-born population - Portugal (%)
Place of birth for the foreign-born population - Spain (%)
Place of birth for the foreign-born population - Other Southern Europe (%)
Place of birth for the foreign-born population - Albania (%)
Place of birth for the foreign-born population - Belarus (%)
Place of birth for the foreign-born population - Bosnia and Herzegovina (%)
Place of birth for the foreign-born population - Bulgaria (%)
Place of birth for the foreign-born population - Croatia (%)
Place of birth for the foreign-born population - Czechoslovakia (%)
Place of birth for the foreign-born population - Hungary (%)
Place of birth for the foreign-born population - Latvia (%)
Place of birth for the foreign-born population - Lithuania (%)
Place of birth for the foreign-born population - North Macedonia (Macedonia) (%)
Place of birth for the foreign-born population - Moldova (%)
Place of birth for the foreign-born population - Poland (%)
Place of birth for the foreign-born population - Romania (%)
Place of birth for the foreign-born population - Russia (%)
Place of birth for the foreign-born population - Serbia (%)
Place of birth for the foreign-born population - Ukraine (%)
Place of birth for the foreign-born population - Other Eastern Europe (%)
Place of birth for the foreign-born population - China (%)
Place of birth for the foreign-born population - Hong Kong (%)
Place of birth for the foreign-born population - Taiwan (%)
Place of birth for the foreign-born population - Japan (%)
Place of birth for the foreign-born population - Korea (%)
Place of birth for the foreign-born population - Other Eastern Asia (%)
Place of birth for the foreign-born population - Afghanistan (%)
Place of birth for the foreign-born population - Bangladesh (%)
Place of birth for the foreign-born population - India (%)
Place of birth for the foreign-born population - Iran (%)
Place of birth for the foreign-born population - Kazakhstan (%)
Place of birth for the foreign-born population - Nepal (%)
Place of birth for the foreign-born population - Pakistan (%)
Place of birth for the foreign-born population - Sri Lanka (%)
Place of birth for the foreign-born population - Uzbekistan (%)
Place of birth for the foreign-born population - Other South Central Asia (%)
Place of birth for the foreign-born population - Burma (%)
Place of birth for the foreign-born population - Cambodia (%)
Place of birth for the foreign-born population - Indonesia (%)
Place of birth for the foreign-born population - Laos (%)
Place of birth for the foreign-born population - Malaysia (%)
Place of birth for the foreign-born population - Philippines (%)
Place of birth for the foreign-born population - Singapore (%)
Place of birth for the foreign-born population - Thailand (%)
Place of birth for the foreign-born population - Vietnam (%)
Place of birth for the foreign-born population - Other South Eastern Asia (%)
Place of birth for the foreign-born population - Armenia (%)
Place of birth for the foreign-born population - Iraq (%)
Place of birth for the foreign-born population - Israel (%)
Place of birth for the foreign-born population - Jordan (%)
Place of birth for the foreign-born population - Kuwait (%)
Place of birth for the foreign-born population - Lebanon (%)
Place of birth for the foreign-born population - Saudi Arabia (%)
Place of birth for the foreign-born population - Syria (%)
Place of birth for the foreign-born population - Turkey (%)
Place of birth for the foreign-born population - Yemen (%)
Place of birth for the foreign-born population - Other Western Asia (%)
Place of birth for the foreign-born population - Eritrea (%)
Place of birth for the foreign-born population - Ethiopia (%)
Place of birth for the foreign-born population - Kenya (%)
Place of birth for the foreign-born population - Somalia (%)
Place of birth for the foreign-born population - Uganda (%)
Place of birth for the foreign-born population - Zimbabwe (%)
Place of birth for the foreign-born population - Other Eastern Africa (%)
Place of birth for the foreign-born population - Cameroon (%)
Place of birth for the foreign-born population - Congo (%)
Place of birth for the foreign-born population - Democratic Republic of Congo (Zaire) (%)
Place of birth for the foreign-born population - Other Middle Africa (%)
Place of birth for the foreign-born population - Egypt (%)
Place of birth for the foreign-born population - Morocco (%)
Place of birth for the foreign-born population - Sudan (%)
Place of birth for the foreign-born population - Other Northern Africa (%)
Place of birth for the foreign-born population - South Africa (%)
Place of birth for the foreign-born population - Other Southern Africa (%)
Place of birth for the foreign-born population - Cabo Verde (%)
Place of birth for the foreign-born population - Ghana (%)
Place of birth for the foreign-born population - Liberia (%)
Place of birth for the foreign-born population - Nigeria (%)
Place of birth for the foreign-born population - Senegal (%)
Place of birth for the foreign-born population - Sierra Leone (%)
Place of birth for the foreign-born population - Other Western Africa (%)
Place of birth for the foreign-born population - Australia (%)
Place of birth for the foreign-born population - New Zealand (%)
Place of birth for the foreign-born population - Fiji (%)
Place of birth for the foreign-born population - Micronesia (%)
Place of birth for the foreign-born population - Bahamas (%)
Place of birth for the foreign-born population - Barbados (%)
Place of birth for the foreign-born population - Cuba (%)
Place of birth for the foreign-born population - Dominica (%)
Place of birth for the foreign-born population - Dominican Republic (%)
Place of birth for the foreign-born population - Grenada (%)
Place of birth for the foreign-born population - Haiti (%)
Place of birth for the foreign-born population - Jamaica (%)
Place of birth for the foreign-born population - St. Vincent and the Grenadines (%)
Place of birth for the foreign-born population - Trinidad and Tobago (%)
Place of birth for the foreign-born population - West Indies (%)
Place of birth for the foreign-born population - Other Caribbean (%)
Place of birth for the foreign-born population - Belize (%)
Place of birth for the foreign-born population - Costa Rica (%)
Place of birth for the foreign-born population - El Salvador (%)
Place of birth for the foreign-born population - Guatemala (%)
Place of birth for the foreign-born population - Honduras (%)
Place of birth for the foreign-born population - Mexico (%)
Place of birth for the foreign-born population - Nicaragua (%)
Place of birth for the foreign-born population - Panama (%)
Place of birth for the foreign-born population - Other Central America (%)
Place of birth for the foreign-born population - Argentina (%)
Place of birth for the foreign-born population - Bolivia (%)
Place of birth for the foreign-born population - Brazil (%)
Place of birth for the foreign-born population - Chile (%)
Place of birth for the foreign-born population - Colombia (%)
Place of birth for the foreign-born population - Ecuador (%)
Place of birth for the foreign-born population - Guyana (%)
Place of birth for the foreign-born population - Peru (%)
Place of birth for the foreign-born population - Uruguay (%)
Place of birth for the foreign-born population - Venezuela (%)
Place of birth for the foreign-born population - Other South America (%)
Place of birth for the foreign-born population - Canada (%)
Place of birth for the foreign-born population - Other Northern America (%)
Place of birth for the foreign-born population - Other (%)
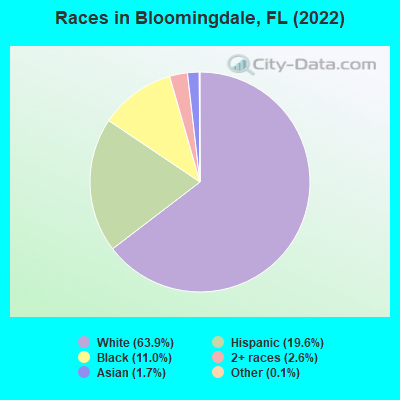
According to 2022 data, the most numerous races in Bloomingdale, FL are White alone (15,881 residents), Hispanic (4,861 residents), and Black alone (2,742 residents). 85.0% of Bloomingdale residents speak English at home. 7.5% of Bloomingdale, FL residents are foreign-born (2.9% born in Latin America, 1.4% born in Asia, 1.4% born in Europe, 1.3% born in North America), which is 178.6% less than the foreign-born rate of 21.0% across the entire state of Florida.
Race distribution in Bloomingdale
2000 2022
10,458,509 65.4% White alone 2,682,715 16.8% Hispanic 2,264,268 14.2% Black alone 261,693 1.6% Asian alone 236,954 1.5% Two or more races 42,358 0.3% American Indian alone 28,994 0.2% Other race alone 6,887 0.04% Native Hawaiian and Other
11,309,403 50.8% White alone 6,025,039 27.1% Hispanic 3,241,015 14.6% Black alone 861,630 3.9% Two or more races 623,692 2.8% Asian alone 152,054 0.7% Other race alone 22,504 0.1% American Indian alone 9,486 0.04% Native Hawaiian and Other
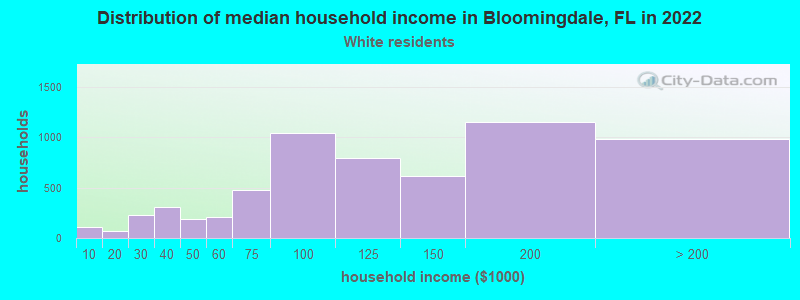
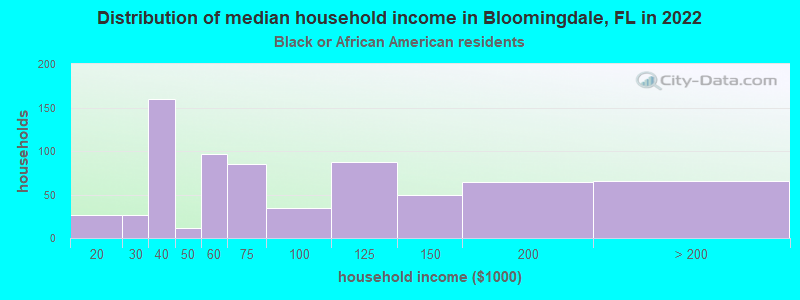
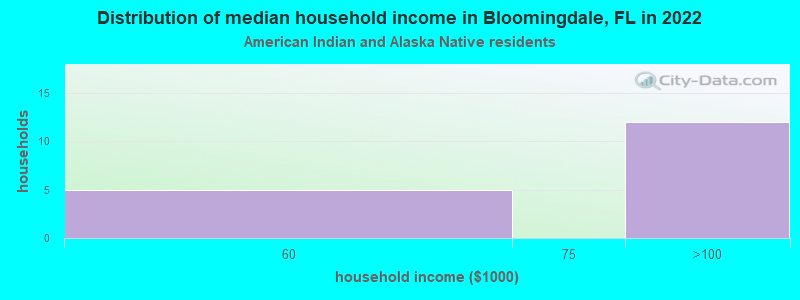
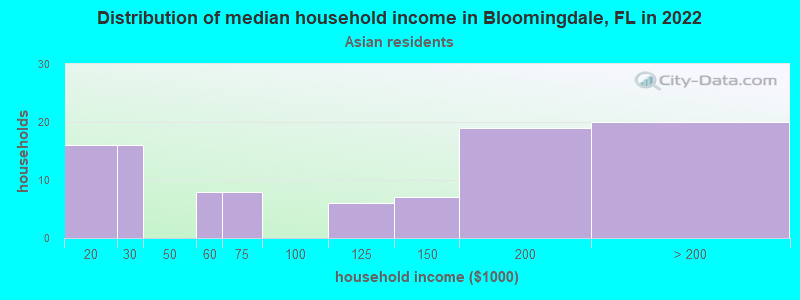
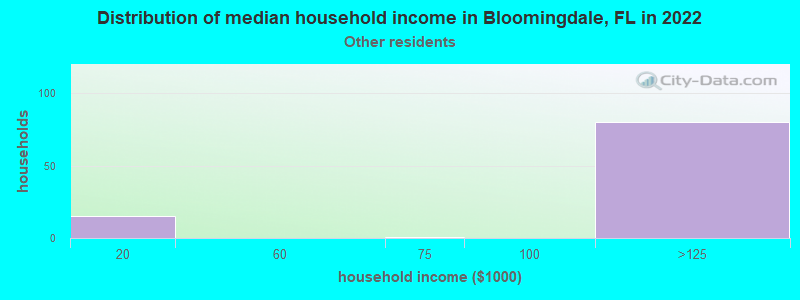
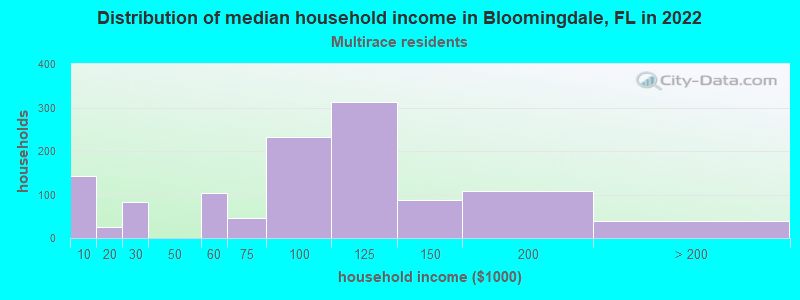
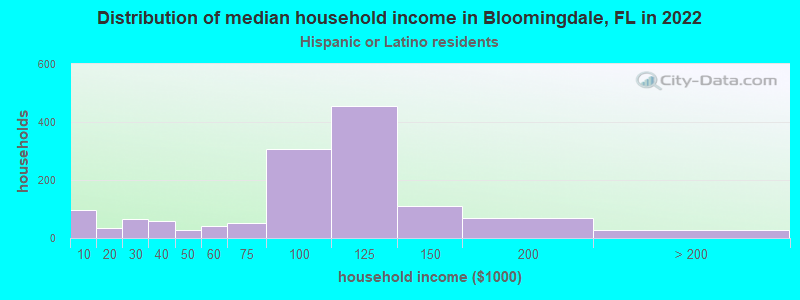
Income and house value in Bloomingdale Median household income in 2022 $117,007 White non-Hispanic householders$66,937 Black householders$120,746 Asian householders$109,886 Some other race householders$100,821 Two or more races householders$105,563 Hispanic or Latino race householdersMedian 2022 house value $427,339 White Non-Hispanic householders$397,117 Black or African American householders$609,324 American Indian or Alaska Native householders $432,539 Asian householders$431,239 Some other race householders$418,890 Two or more races householders$454,637 Hispanic or Latino householders
Median age by race in Bloomingdale
43.2 Median age for White residents43.8 42.7 36.6 Median age for Black or African American residents43.3 28.6 65.6 Median age for American Indian / Alaska Native residents-676,245,210.1 -655,399,060.4 47.9 Median age for Asian residents16.6 51.2 -848,484,847.6 Median age for Native Hawaiian / Pacific Islander residents-776,729,559.0 -490,118,576.6 37.6 Median age for Other race residents27.5 37.5 41.1 Median age for Two or more races residents38.8 55.3 43.4 Median age for White alone residents43.7 43.3 36.9 Median age for Hispanic or Latino residents33.5 38.0
Owner/renter occupied households by race in Bloomingdale
House owners and renters - White residents 5,185 85.4% Owner occupied885 14.6% Renter occupiedHouse owners and renters - Black or African American residents 358 51.2% Owner occupied341 48.8% Renter occupiedHouse owners and renters - American Indian / Alaska Native residents 12 49.8% Owner occupied12 50.2% Renter occupiedHouse owners and renters - Asian residents 91 83.3% Owner occupied18 16.7% Renter occupiedHouse owners and renters - Other race residents 45 60.1% Owner occupied30 39.9% Renter occupiedHouse owners and renters - Two or more races residents 838 69.9% Owner occupied360 30.1% Renter occupiedHouse owners and renters - White alone residents 5,247 86.4% Owner occupied827 13.6% Renter occupiedHouse owners and renters - Hispanic or Latino residents 874 67.5% Owner occupied420 32.5% Renter occupied
Language usage in Bloomingdale
English speakers - Total 85.0% of residents of Bloomingdale speak English at home.
10.2% of residents speak Spanish at home 1,718 70.7% Speak English very well711 29.3% Speak English less than very well4.5% of residents speak other language at home 863 80.4% Speak English very well211 19.6% Speak English less than very well
English speakers - Born in the United States 94.8% of residents of Bloomingdale speak English at home.
4.5% of residents speak Spanish at home 467 88.3% Speak English very well62 11.7% Speak English less than very well0.9% of residents speak other language at home 99 91.7% Speak English very well9 8.3% Speak English less than very well
English speakers - Native, born elsewhere 28.8% of residents of Bloomingdale speak English at home.
69.0% of residents speak Spanish at home 362 48.3% Speak English very well388 51.7% Speak English less than very well2.0% of residents speak other language at home 22 100.0% Speak English very well
English speakers - Foreign-born 34.6% of residents of Bloomingdale speak English at home.
20.1% of residents speak Spanish at home 231 59.1% Speak English very well160 40.9% Speak English less than very well43.4% of residents speak other language at home 672 79.4% Speak English very well174 20.6% Speak English less than very well
White (Caucasian) - Speak only English Native:
96.4% (14,835)Foreign-born:
64.3% (301)
White (Caucasian) - Speak another language Native:
4.9% (752)Foreign-born:
53.7% (251)
Black or African American - Speak only English Native:
96.9% (2,279)Foreign-born:
32.7% (104)
Black or African American - Speak another language Native:
3.2% (76)Foreign-born:
67.5% (215)
Asian - Speak only English Native:
47.1% (57)Foreign-born:
55.8% (165)
Asian - Speak another language Native:
53.4% (64)Foreign-born:
45.2% (134)
Two or more races - Speak only English Native:
72.6% (2,097)Foreign-born:
11.0% (57)
Two or more races - Speak another language Native:
25.7% (741)Foreign-born:
87.4% (453)
White alone - Speak only English Native:
98.4% (14,390)Foreign-born:
40.9% (318)
White alone - Speak another language Native:
1.7% (246)Foreign-born:
59.3% (462)
Hispanic or Latino - Speak only English Native:
57.8% (2,330)Foreign-born:
14.4% (64)
Hispanic or Latino - Speak another language Native:
45.2% (1,821)Foreign-born:
84.7% (378)
Foreign-born residents in Bloomingdale 1,872 residents are foreign born (2.9% Latin America , 1.4% Asia , 1.4% Europe , 1.3% North America ).
This city:
7.5%Florida:
21.1%
Marital status for residents in Bloomingdale Marital status - White (Caucasian) population 15 years and over
Males 25.1% Never married62.5% Now married1.2% Separated2.4% Widowed8.8% DivorcedFemales 21.8% Never married56.3% Now married1.5% Separated8.9% Widowed11.5% DivorcedWomen who gave birth in the past 12 months Now married:
57.3% (43)Unmarried:
42.7% (32)
Women who did not give birth in the past 12 months Now married:
48.0% (1,564)Unmarried:
52.0% (1,691)
Marital status - Black or African American population 15 years and over
Males 40.7% Never married54.0% Now married0.0% Separated0.0% Widowed5.3% DivorcedFemales 36.1% Never married57.2% Now married0.0% Separated1.5% Widowed5.2% DivorcedWomen who gave birth in the past 12 months Now married:
100.0% (9)Unmarried:
0.0% (0)
Women who did not give birth in the past 12 months Now married:
47.8% (343)Unmarried:
52.2% (374)
Marital status - American Indian / Alaska Native population 15 years and over
Males 0.0% Never married0.0% Now married0.0% Separated100.0% Widowed0.0% DivorcedFemales 56.2% Never married0.0% Now married0.0% Separated0.0% Widowed43.8% DivorcedWomen who did not give birth in the past 12 months Now married:
0.0% (0)Unmarried:
100.0% (18)
Marital status - Asian population 15 years and over
Males 42.0% Never married58.0% Now married0.0% Separated0.0% Widowed0.0% DivorcedFemales 17.8% Never married56.5% Now married0.0% Separated12.0% Widowed13.6% DivorcedWomen who did not give birth in the past 12 months Now married:
56.0% (54)Unmarried:
44.0% (43)
Marital status - Other race population 15 years and over
Males 81.8% Never married9.9% Now married0.0% Separated0.8% Widowed7.4% DivorcedFemales 0.0% Never married75.5% Now married0.0% Separated24.5% Widowed0.0% DivorcedWomen who gave birth in the past 12 months Now married:
100.0% (36)Unmarried:
0.0% (0)
Women who did not give birth in the past 12 months Now married:
100.0% (19)Unmarried:
0.0% (0)
Marital status - Two or more races population 15 years and over
Males 53.5% Never married41.2% Now married1.0% Separated0.0% Widowed4.3% DivorcedFemales 35.8% Never married45.4% Now married0.9% Separated8.4% Widowed9.4% DivorcedWomen who did not give birth in the past 12 months Now married:
58.5% (283)Unmarried:
41.5% (201)
Marital status - White alone, not Hispanic / Latino population 15 years and over
Males 23.8% Never married65.6% Now married0.9% Separated2.3% Widowed7.4% DivorcedFemales 19.5% Never married57.5% Now married1.1% Separated10.1% Widowed11.9% DivorcedWomen who gave birth in the past 12 months Now married:
57.3% (51)Unmarried:
42.7% (38)
Women who did not give birth in the past 12 months Now married:
48.0% (1,519)Unmarried:
52.0% (1,646)
Marital status - Hispanic or Latino population 15 years and over
Males 45.2% Never married40.0% Now married2.1% Separated1.8% Widowed10.9% DivorcedFemales 39.6% Never married47.0% Now married2.9% Separated2.4% Widowed8.1% DivorcedWomen who gave birth in the past 12 months Now married:
100.0% (27)Unmarried:
0.0% (0)
Women who did not give birth in the past 12 months Now married:
54.0% (533)Unmarried:
46.0% (454)
Ancestries in Bloomingdale
977 7.8% American885 7.1% German857 6.9% English764 6.1% Irish469 3.8% Italian340 2.7% European312 2.5% Canadian245 2.0% Haitian218 1.7% Polish163 1.3% Scotch-Irish108 0.9% Arab103 0.8% Swedish100 0.8% French95 0.8% Greek95 0.8% Scandinavian81 0.6% Norwegian77 0.6% Scottish76 0.6% Portuguese73 0.6% British60 0.5% Celtic55 0.4% African53 0.4% Jamaican51 0.4% Russian51 0.4% Ukrainian50 0.4% Northern European47 0.4% Eastern European47 0.4% Brazilian46 0.4% Croatian36 0.3% Lebanese34 0.3% French Canadian27 0.2% Hungarian26 0.2% Palestinian25 0.2% Danish25 0.2% Welsh19 0.2% Austrian18 0.1% Czechoslovakian10 0.08% Dutch7 0.06% Israeli6 0.05% Finnish6 0.05% Czech
Geographical mobility in Bloomingdale Same house 1 year ago 13,658 86.1% White (Caucasian)2,664 92.4% Black or African American33 100.0% American Indian / Alaska Native446 100.0% Asian232 84.9% Other race3,107 83.3% Two or more races14,060 88.5% White alone, not Hispanic / Latino3,587 74.7% Hispanic or LatinoMoved within same county 748 4.7% White / Caucasian79 2.7% Black or African American26 9.7% Other race290 7.8% Two or more races607 3.8% White alone, not Hispanic / Latino451 9.4% Hispanic or LatinoMoved within same state 394 2.5% White / Caucasian159 4.3% Two or more races161 1.0% White alone, not Hispanic / Latino485 10.1% Hispanic or LatinoMoved from different state 1,235 7.8% White / Caucasian212 7.3% Black or African American5 2.0% Other race152 4.1% Two or more races1,325 8.3% White alone, not Hispanic / Latino145 3.0% Hispanic or LatinoMoved from abroad 70 0.4% White23 0.1% White alone, not Hispanic / Latino197 4.1% Hispanic or Latino
Children Nativity (place of birth) in Bloomingdale
Children under 6 years - Living with two parents Both parents native 1,355 100.0% NativeBoth parents foreign-born 204 100.0% NativeOne native, one foreign-born parent 68 100.0% NativeChildren under 6 years - Living with one parent Native parent 158 100.0% NativeForeign-born parent 33 100.0% NativeChildren 6 to 17 years - Living with two parents Both parents native 2,447 97.0% Native76 3.0% Foreign-bornBoth parents foreign-born 69 45.1% Native83 54.9% Foreign-bornOne native, one foreign-born parent 146 100.0% NativeChildren 6 to 17 years - Living with one parent Native parent 670 99.8% Native1 0.2% Foreign-bornForeign-born parent 69 65.0% Native37 35.0% Foreign-born
Grandparents responsible for own grandchildren in Bloomingdale
Grandparents (30 to 59 years) White / Caucasian 31 25.2% Responsible for grandchildren91 74.8% Not responsible for grandchildrenBlack or African American 102 100.0% Responsible for grandchildrenTwo or more races 56 100.0% Not responsible for grandchildrenWhite alone, not Hispanic / Latino 37 33.5% Responsible for grandchildren74 66.5% Not responsible for grandchildrenHispanic or Latino 33 100.0% Not responsible for grandchildrenGrandparents (60 years and over) White / Caucasian 43 17.2% Responsible for grandchildren209 82.8% Not responsible for grandchildrenBlack or African American 42 81.2% Responsible for grandchildren10 18.8% Not responsible for grandchildrenTwo or more races 2 100.0% Not responsible for grandchildrenWhite alone, not Hispanic / Latino 53 15.6% Responsible for grandchildren287 84.4% Not responsible for grandchildrenHispanic or Latino 1 100.0% Not responsible for grandchildren