Races in Blaine, Minnesota (MN) Detailed Stats
Data:
Races - White alone (%)
Races - White alone (% change since 2000)
Races - Black alone (%)
Races - Black alone (% change since 2000)
Races - American Indian alone (%)
Races - American Indian alone (% change since 2000)
Races - Asian alone (%)
Races - Asian alone (% change since 2000)
Races - Hispanic (%)
Races - Hispanic (% change since 2000)
Races - Native Hawaiian and Other Pacific Islander alone (%)
Races - Native Hawaiian and Other Pacific Islander alone (% change since 2000)
Races - Two or more races(%)
Races - Two or more races(% change since 2000)
Races - Other race alone (%)
Races - Other race alone (% change since 2000)
Racial diversity
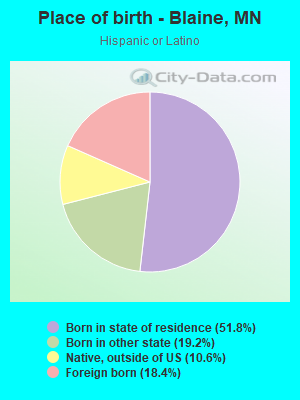
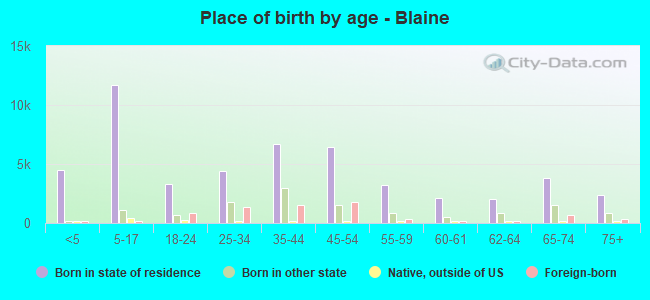
Place of birth - Born in state of residence (%)
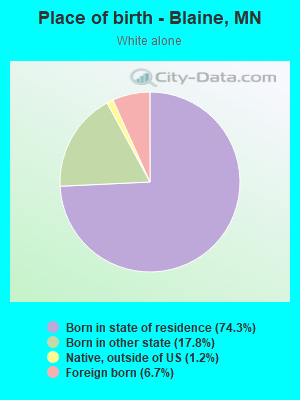
Place of birth - Born in state of residence (%) - White
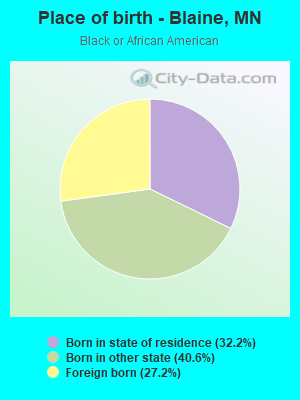
Place of birth - Born in state of residence (%) - Black or African American
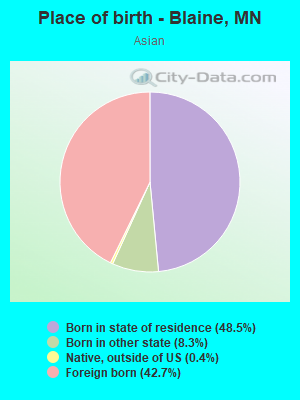
Place of birth - Born in state of residence (%) - Asian
Place of birth - Born in state of residence (%) - Hispanic or Latino
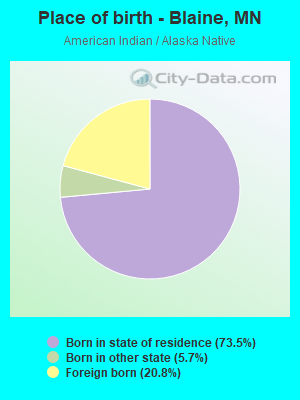
Place of birth - Born in state of residence (%) - American Indian and Alaska Native
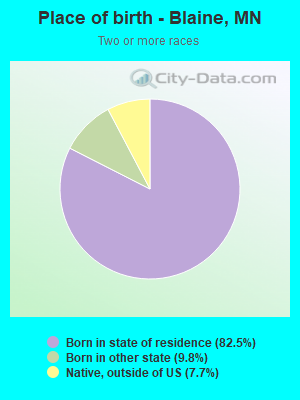
Place of birth - Born in state of residence (%) - Multirace
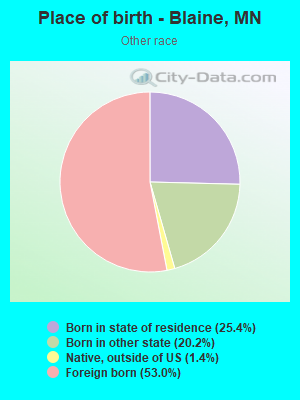
Place of birth - Born in state of residence (%) - Other Race
Place of birth - Born in other state (%)
Place of birth - Born in other state (%) - White
Place of birth - Born in other state (%) - Black or African American
Place of birth - Born in other state (%) - Asian
Place of birth - Born in other state (%) - Hispanic or Latino
Place of birth - Born in other state (%) - American Indian and Alaska Native
Place of birth - Born in other state (%) - Multirace
Place of birth - Born in other state (%) - Other Race
Place of birth - Native, outside of US (%)
Place of birth - Native, outside of US (%) - White
Place of birth - Native, outside of US (%) - Black or African American
Place of birth - Native, outside of US (%) - Asian
Place of birth - Native, outside of US (%) - Hispanic or Latino
Place of birth - Native, outside of US (%) - American Indian and Alaska Native
Place of birth - Native, outside of US (%) - Multirace
Place of birth - Native, outside of US (%) - Other Race
Place of birth - Foreign born (%)
Place of birth - Foreign born (%) - White
Place of birth - Foreign born (%) - Black or African American
Place of birth - Foreign born (%) - Asian
Place of birth - Foreign born (%) - Hispanic or Latino
Place of birth - Foreign born (%) - American Indian and Alaska Native
Place of birth - Foreign born (%) - Multirace
Place of birth - Foreign born (%) - Other Race
Residents speaking English at home (%)
Residents speaking English at home - Born in the United States (%)
Residents speaking English at home - Native, born elsewhere (%)
Residents speaking English at home - Foreign born (%)
Residents speaking Spanish at home (%)
Residents speaking Spanish at home - Born in the United States (%)
Residents speaking Spanish at home - Native, born elsewhere (%)
Residents speaking Spanish at home - Foreign born (%)
Residents speaking other language at home (%)
Residents speaking other language at home - Born in the United States (%)
Residents speaking other language at home - Native, born elsewhere (%)
Residents speaking other language at home - Foreign born (%)
Marital status - Never married (%)
Marital status - Now married (%)
Marital status - Separated (%)
Marital status - Widowed (%)
Marital status - Divorced (%)
Ancestries Reported - Arab (%)
Ancestries Reported - Czech (%)
Ancestries Reported - Danish (%)
Ancestries Reported - Dutch (%)
Ancestries Reported - English (%)
Ancestries Reported - French (%)
Ancestries Reported - French Canadian (%)
Ancestries Reported - German (%)
Ancestries Reported - Greek (%)
Ancestries Reported - Hungarian (%)
Ancestries Reported - Irish (%)
Ancestries Reported - Italian (%)
Ancestries Reported - Lithuanian (%)
Ancestries Reported - Norwegian (%)
Ancestries Reported - Polish (%)
Ancestries Reported - Portuguese (%)
Ancestries Reported - Russian (%)
Ancestries Reported - Scotch-Irish (%)
Ancestries Reported - Scottish (%)
Ancestries Reported - Slovak (%)
Ancestries Reported - Subsaharan African (%)
Ancestries Reported - Swedish (%)
Ancestries Reported - Swiss (%)
Ancestries Reported - Ukrainian (%)
Ancestries Reported - United States (%)
Ancestries Reported - Welsh (%)
Ancestries Reported - West Indian (%)
Ancestries Reported - Other (%)
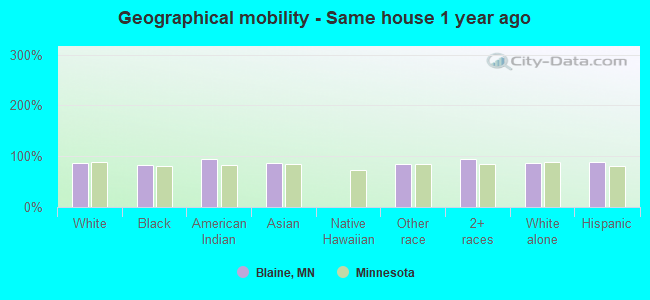
Geographical mobility - Same house 1 year ago (%)
Geographical mobility - Same house 1 year ago (%) - White
Geographical mobility - Same house 1 year ago (%) - Black or African American
Geographical mobility - Same house 1 year ago (%) - Asian
Geographical mobility - Same house 1 year ago (%) - Hispanic or Latino
Geographical mobility - Same house 1 year ago (%) - American Indian and Alaska Native
Geographical mobility - Same house 1 year ago (%) - Multirace
Geographical mobility - Same house 1 year ago (%) - Other Race
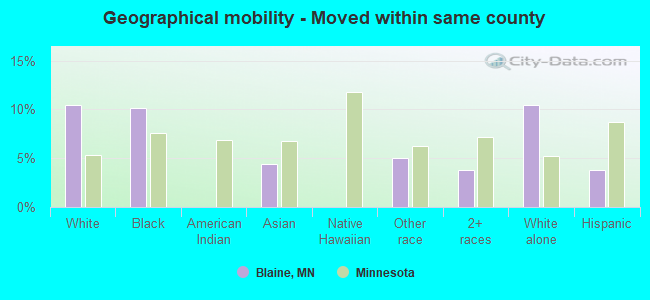
Geographical mobility - Moved within same county (%)
Geographical mobility - Moved within same county (%) - White
Geographical mobility - Moved within same county (%) - Black or African American
Geographical mobility - Moved within same county (%) - Asian
Geographical mobility - Moved within same county (%) - Hispanic or Latino
Geographical mobility - Moved within same county (%) - American Indian and Alaska Native
Geographical mobility - Moved within same county (%) - Multirace
Geographical mobility - Moved within same county (%) - Other Race
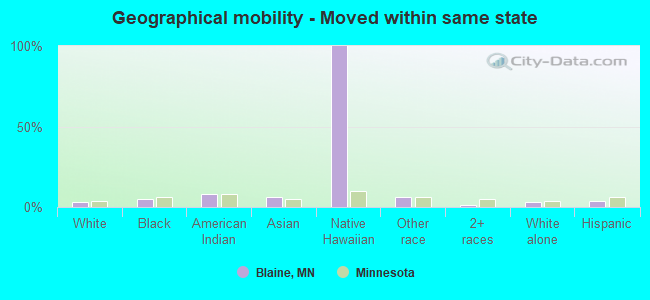
Geographical mobility - Moved from different county within same state (%)
Geographical mobility - Moved from different county within same state (%) - White
Geographical mobility - Moved from different county within same state (%) - Black or African American
Geographical mobility - Moved from different county within same state (%) - Asian
Geographical mobility - Moved from different county within same state (%) - Hispanic or Latino
Geographical mobility - Moved from different county within same state (%) - American Indian and Alaska Native
Geographical mobility - Moved from different county within same state (%) - Multirace
Geographical mobility - Moved from different county within same state (%) - Other Race
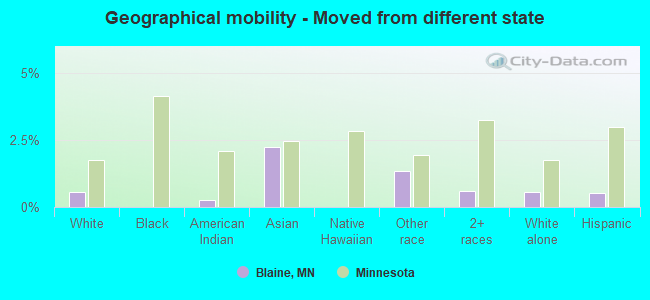
Geographical mobility - Moved from different state (%)
Geographical mobility - Moved from different state (%) - White
Geographical mobility - Moved from different state (%) - Black or African American
Geographical mobility - Moved from different state (%) - Asian
Geographical mobility - Moved from different state (%) - Hispanic or Latino
Geographical mobility - Moved from different state (%) - American Indian and Alaska Native
Geographical mobility - Moved from different state (%) - Multirace
Geographical mobility - Moved from different state (%) - Other Race
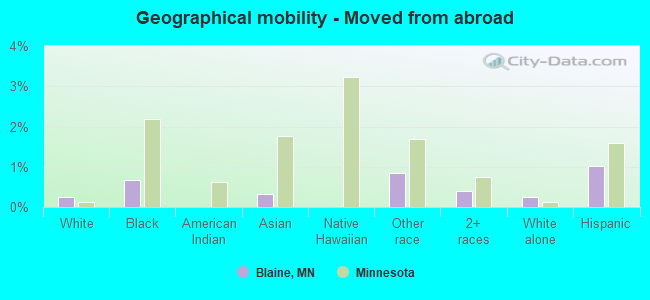
Geographical mobility - Moved from abroad (%)
Geographical mobility - Moved from abroad (%) - White
Geographical mobility - Moved from abroad (%) - Black or African American
Geographical mobility - Moved from abroad (%) - Asian
Geographical mobility - Moved from abroad (%) - Hispanic or Latino
Geographical mobility - Moved from abroad (%) - American Indian and Alaska Native
Geographical mobility - Moved from abroad (%) - Multirace
Geographical mobility - Moved from abroad (%) - Other Race
Place of birth for the foreign-born population - Ireland (%)
Place of birth for the foreign-born population - Denmark (%)
Place of birth for the foreign-born population - Norway (%)
Place of birth for the foreign-born population - Sweden (%)
Place of birth for the foreign-born population - United Kingdom (%)
Place of birth for the foreign-born population - England (%)
Place of birth for the foreign-born population - Scotland (%)
Place of birth for the foreign-born population - Other Northern Europe (%)
Place of birth for the foreign-born population - Austria (%)
Place of birth for the foreign-born population - Belgium (%)
Place of birth for the foreign-born population - France (%)
Place of birth for the foreign-born population - Germany (%)
Place of birth for the foreign-born population - Netherlands (%)
Place of birth for the foreign-born population - Switzerland (%)
Place of birth for the foreign-born population - Other Western Europe (%)
Place of birth for the foreign-born population - Greece (%)
Place of birth for the foreign-born population - Italy (%)
Place of birth for the foreign-born population - Portugal (%)
Place of birth for the foreign-born population - Spain (%)
Place of birth for the foreign-born population - Other Southern Europe (%)
Place of birth for the foreign-born population - Albania (%)
Place of birth for the foreign-born population - Belarus (%)
Place of birth for the foreign-born population - Bosnia and Herzegovina (%)
Place of birth for the foreign-born population - Bulgaria (%)
Place of birth for the foreign-born population - Croatia (%)
Place of birth for the foreign-born population - Czechoslovakia (%)
Place of birth for the foreign-born population - Hungary (%)
Place of birth for the foreign-born population - Latvia (%)
Place of birth for the foreign-born population - Lithuania (%)
Place of birth for the foreign-born population - North Macedonia (Macedonia) (%)
Place of birth for the foreign-born population - Moldova (%)
Place of birth for the foreign-born population - Poland (%)
Place of birth for the foreign-born population - Romania (%)
Place of birth for the foreign-born population - Russia (%)
Place of birth for the foreign-born population - Serbia (%)
Place of birth for the foreign-born population - Ukraine (%)
Place of birth for the foreign-born population - Other Eastern Europe (%)
Place of birth for the foreign-born population - China (%)
Place of birth for the foreign-born population - Hong Kong (%)
Place of birth for the foreign-born population - Taiwan (%)
Place of birth for the foreign-born population - Japan (%)
Place of birth for the foreign-born population - Korea (%)
Place of birth for the foreign-born population - Other Eastern Asia (%)
Place of birth for the foreign-born population - Afghanistan (%)
Place of birth for the foreign-born population - Bangladesh (%)
Place of birth for the foreign-born population - India (%)
Place of birth for the foreign-born population - Iran (%)
Place of birth for the foreign-born population - Kazakhstan (%)
Place of birth for the foreign-born population - Nepal (%)
Place of birth for the foreign-born population - Pakistan (%)
Place of birth for the foreign-born population - Sri Lanka (%)
Place of birth for the foreign-born population - Uzbekistan (%)
Place of birth for the foreign-born population - Other South Central Asia (%)
Place of birth for the foreign-born population - Burma (%)
Place of birth for the foreign-born population - Cambodia (%)
Place of birth for the foreign-born population - Indonesia (%)
Place of birth for the foreign-born population - Laos (%)
Place of birth for the foreign-born population - Malaysia (%)
Place of birth for the foreign-born population - Philippines (%)
Place of birth for the foreign-born population - Singapore (%)
Place of birth for the foreign-born population - Thailand (%)
Place of birth for the foreign-born population - Vietnam (%)
Place of birth for the foreign-born population - Other South Eastern Asia (%)
Place of birth for the foreign-born population - Armenia (%)
Place of birth for the foreign-born population - Iraq (%)
Place of birth for the foreign-born population - Israel (%)
Place of birth for the foreign-born population - Jordan (%)
Place of birth for the foreign-born population - Kuwait (%)
Place of birth for the foreign-born population - Lebanon (%)
Place of birth for the foreign-born population - Saudi Arabia (%)
Place of birth for the foreign-born population - Syria (%)
Place of birth for the foreign-born population - Turkey (%)
Place of birth for the foreign-born population - Yemen (%)
Place of birth for the foreign-born population - Other Western Asia (%)
Place of birth for the foreign-born population - Eritrea (%)
Place of birth for the foreign-born population - Ethiopia (%)
Place of birth for the foreign-born population - Kenya (%)
Place of birth for the foreign-born population - Somalia (%)
Place of birth for the foreign-born population - Uganda (%)
Place of birth for the foreign-born population - Zimbabwe (%)
Place of birth for the foreign-born population - Other Eastern Africa (%)
Place of birth for the foreign-born population - Cameroon (%)
Place of birth for the foreign-born population - Congo (%)
Place of birth for the foreign-born population - Democratic Republic of Congo (Zaire) (%)
Place of birth for the foreign-born population - Other Middle Africa (%)
Place of birth for the foreign-born population - Egypt (%)
Place of birth for the foreign-born population - Morocco (%)
Place of birth for the foreign-born population - Sudan (%)
Place of birth for the foreign-born population - Other Northern Africa (%)
Place of birth for the foreign-born population - South Africa (%)
Place of birth for the foreign-born population - Other Southern Africa (%)
Place of birth for the foreign-born population - Cabo Verde (%)
Place of birth for the foreign-born population - Ghana (%)
Place of birth for the foreign-born population - Liberia (%)
Place of birth for the foreign-born population - Nigeria (%)
Place of birth for the foreign-born population - Senegal (%)
Place of birth for the foreign-born population - Sierra Leone (%)
Place of birth for the foreign-born population - Other Western Africa (%)
Place of birth for the foreign-born population - Australia (%)
Place of birth for the foreign-born population - New Zealand (%)
Place of birth for the foreign-born population - Fiji (%)
Place of birth for the foreign-born population - Micronesia (%)
Place of birth for the foreign-born population - Bahamas (%)
Place of birth for the foreign-born population - Barbados (%)
Place of birth for the foreign-born population - Cuba (%)
Place of birth for the foreign-born population - Dominica (%)
Place of birth for the foreign-born population - Dominican Republic (%)
Place of birth for the foreign-born population - Grenada (%)
Place of birth for the foreign-born population - Haiti (%)
Place of birth for the foreign-born population - Jamaica (%)
Place of birth for the foreign-born population - St. Vincent and the Grenadines (%)
Place of birth for the foreign-born population - Trinidad and Tobago (%)
Place of birth for the foreign-born population - West Indies (%)
Place of birth for the foreign-born population - Other Caribbean (%)
Place of birth for the foreign-born population - Belize (%)
Place of birth for the foreign-born population - Costa Rica (%)
Place of birth for the foreign-born population - El Salvador (%)
Place of birth for the foreign-born population - Guatemala (%)
Place of birth for the foreign-born population - Honduras (%)
Place of birth for the foreign-born population - Mexico (%)
Place of birth for the foreign-born population - Nicaragua (%)
Place of birth for the foreign-born population - Panama (%)
Place of birth for the foreign-born population - Other Central America (%)
Place of birth for the foreign-born population - Argentina (%)
Place of birth for the foreign-born population - Bolivia (%)
Place of birth for the foreign-born population - Brazil (%)
Place of birth for the foreign-born population - Chile (%)
Place of birth for the foreign-born population - Colombia (%)
Place of birth for the foreign-born population - Ecuador (%)
Place of birth for the foreign-born population - Guyana (%)
Place of birth for the foreign-born population - Peru (%)
Place of birth for the foreign-born population - Uruguay (%)
Place of birth for the foreign-born population - Venezuela (%)
Place of birth for the foreign-born population - Other South America (%)
Place of birth for the foreign-born population - Canada (%)
Place of birth for the foreign-born population - Other Northern America (%)
Place of birth for the foreign-born population - Other (%)
Latest news about races in Blaine, MN collected exclusively by city-data.com from local newspapers, TV, and radio stations
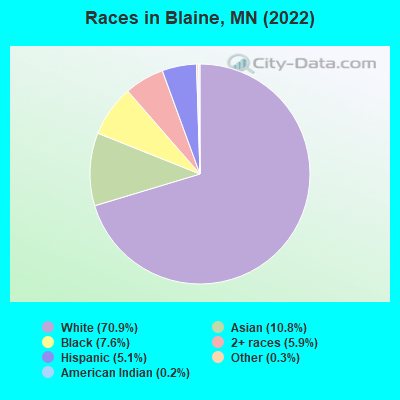
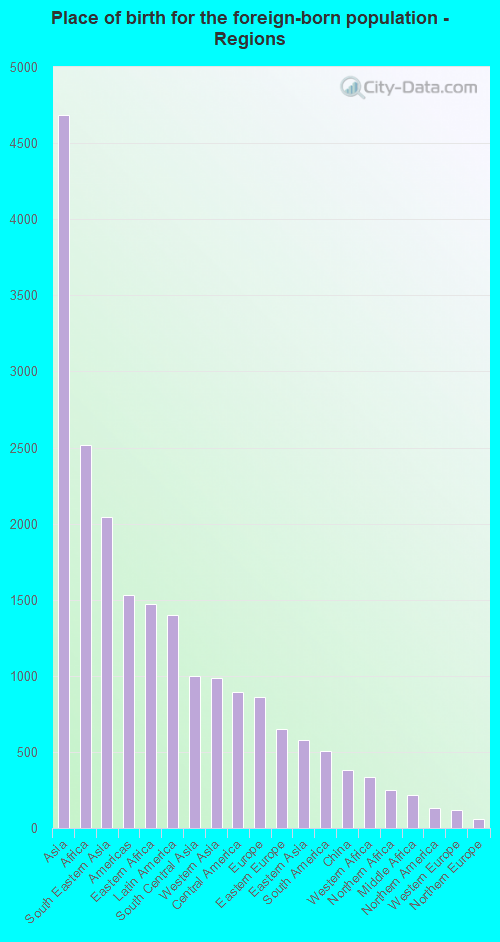
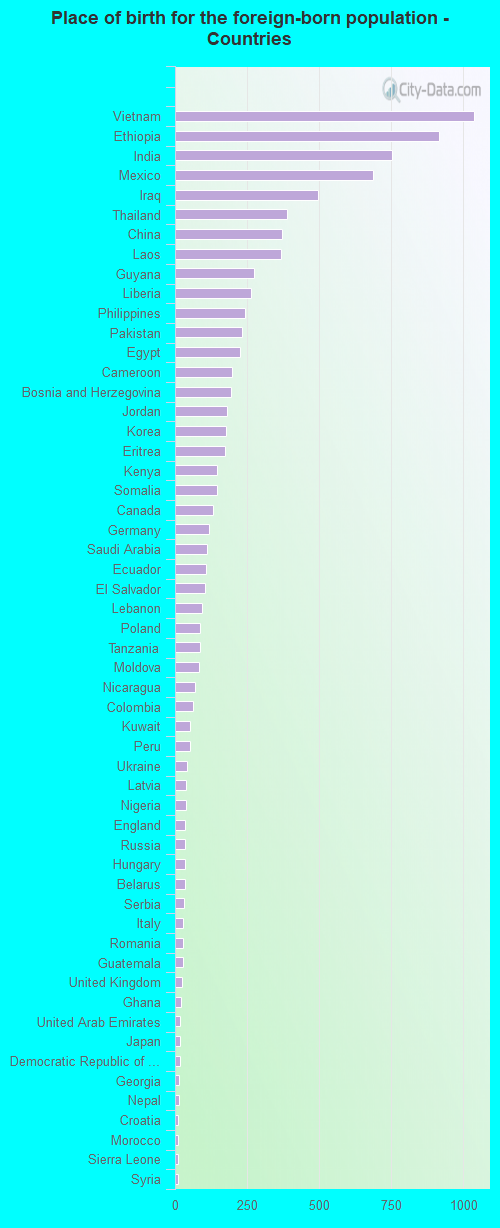
According to 2022 data, the most numerous races in Blaine, MN are White alone (50,332 residents), Black alone (5,360 residents), and Hispanic (3,640 residents). 79.4% of Blaine residents speak English at home. 13.5% of Blaine, MN residents are foreign-born (6.5% born in Asia, 3.5% born in Africa, 1.9% born in Latin America), which is 40.8% greater than the foreign-born rate of 8.0% across the entire state of Minnesota.
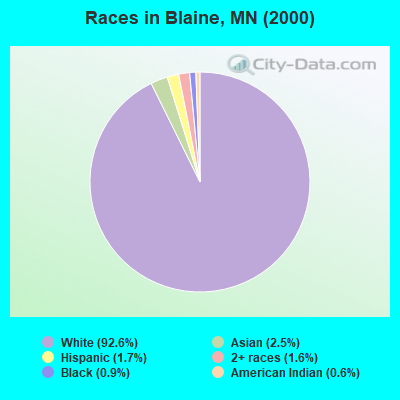
Race distribution in Blaine
2000 2022
4,337,143 88.2% White alone 168,813 3.4% Black alone 143,382 2.9% Hispanic 141,083 2.9% Asian alone 70,304 1.4% Two or more races 52,009 1.1% American Indian alone 5,031 0.1% Other race alone 1,714 0.03% Native Hawaiian and Other
4,356,347 76.2% White alone 395,179 6.9% Black alone 333,830 5.8% Hispanic 294,800 5.2% Asian alone 259,649 4.5% Two or more races 42,125 0.7% American Indian alone 32,976 0.6% Other race alone 2,278 0.04% Native Hawaiian and Other
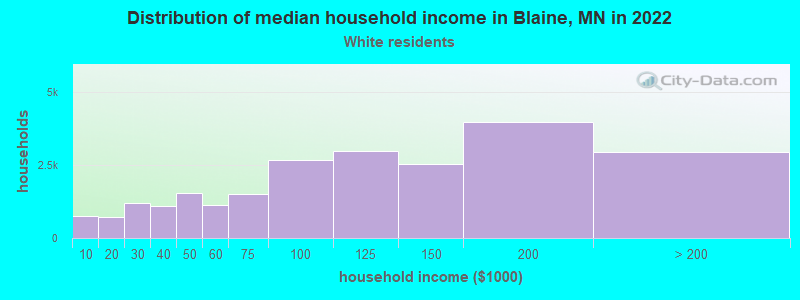
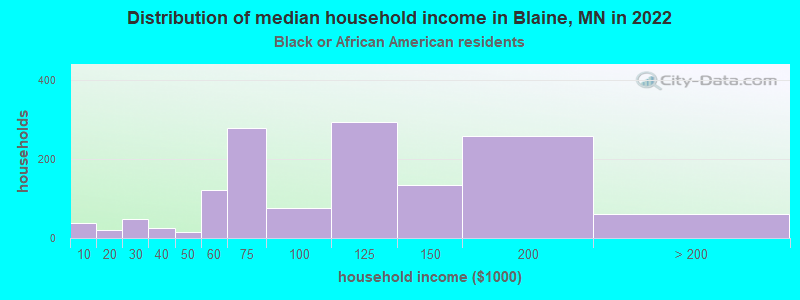
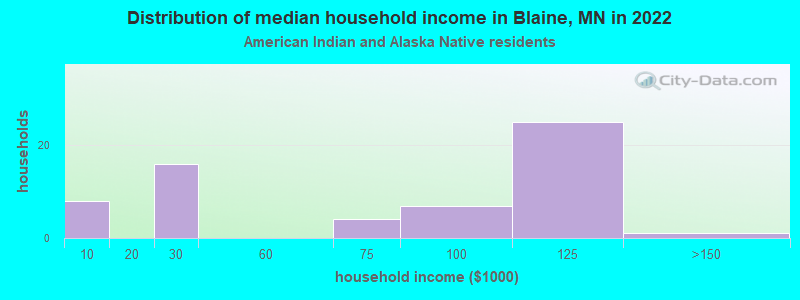
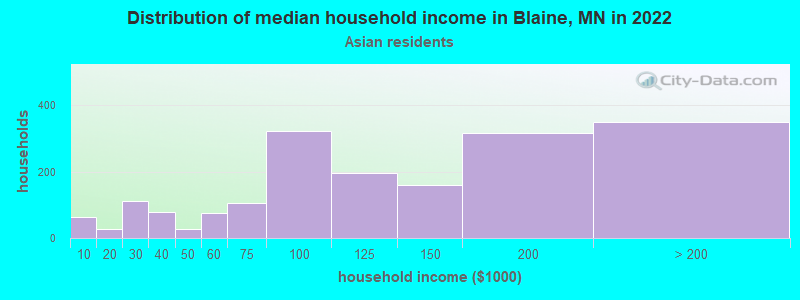
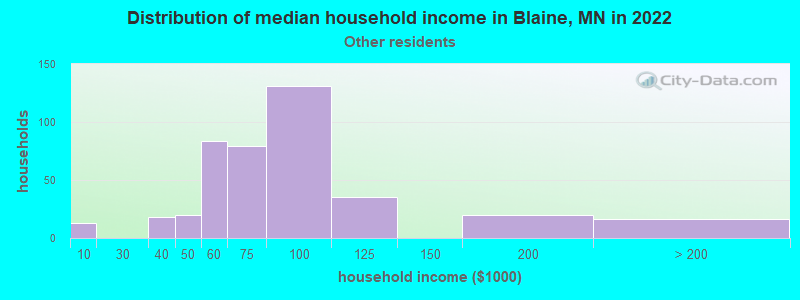
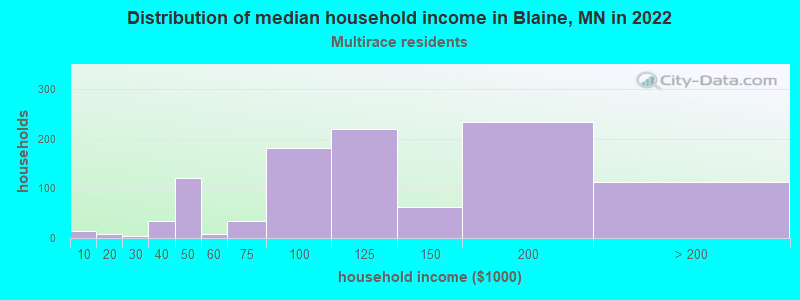
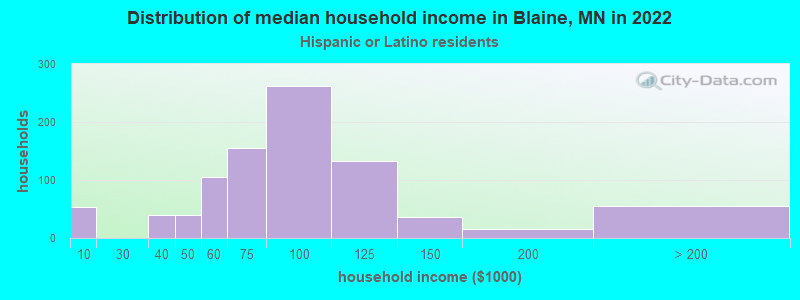
Income and house value in Blaine Median household income in 2022 $106,526 White non-Hispanic householders$112,121 Black householders$93,734 Asian householders$77,352 Some other race householders$106,185 Two or more races householders$95,464 Hispanic or Latino race householdersMedian 2022 house value $368,095 White Non-Hispanic householders$416,529 Black or African American householders$315,259 American Indian or Alaska Native householders $489,620 Asian householders$341,384 Some other race householders$338,742 Two or more races householders$318,194 Hispanic or Latino householders
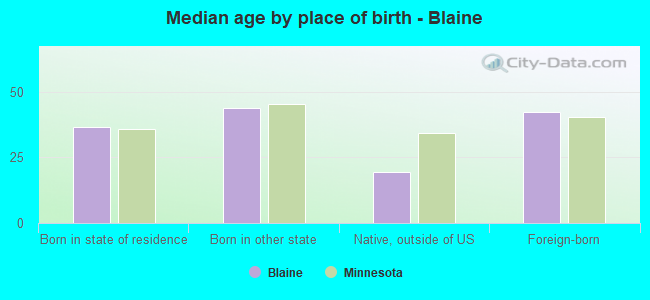
Median age by race in Blaine
42.1 Median age for White residents42.9 40.2 38.2 Median age for Black or African American residents34.7 40.2 51.4 Median age for American Indian / Alaska Native residents-666,666,666.0 54.0 28.2 Median age for Asian residents30.4 25.3 -666,666,666.0 Median age for Native Hawaiian / Pacific Islander residents-666,666,666.0 -666,666,666.0 37.0 Median age for Other race residents29.6 44.3 23.2 Median age for Two or more races residents21.3 23.3 42.2 Median age for White alone residents43.0 40.3 23.7 Median age for Hispanic or Latino residents29.1 23.7
Owner/renter occupied households by race in Blaine
House owners and renters - White residents 20,242 87.8% Owner occupied2,816 12.2% Renter occupiedHouse owners and renters - Black or African American residents 602 65.4% Owner occupied318 34.6% Renter occupiedHouse owners and renters - American Indian / Alaska Native residents 21 49.7% Owner occupied21 50.3% Renter occupiedHouse owners and renters - Asian residents 1,035 77.5% Owner occupied300 22.5% Renter occupiedHouse owners and renters - Other race residents 441 77.1% Owner occupied131 22.9% Renter occupiedHouse owners and renters - Two or more races residents 421 59.3% Owner occupied289 40.7% Renter occupiedHouse owners and renters - White alone residents 20,097 87.7% Owner occupied2,816 12.3% Renter occupiedHouse owners and renters - Hispanic or Latino residents 471 88.7% Owner occupied60 11.3% Renter occupied
Language usage in Blaine
English speakers - Total 79.4% of residents of Blaine speak English at home.
3.8% of residents speak Spanish at home 1,516 59.3% Speak English very well1,042 40.7% Speak English less than very well18.2% of residents speak other language at home 7,281 60.3% Speak English very well4,803 39.7% Speak English less than very well
English speakers - Born in the United States 90.3% of residents of Blaine speak English at home.
3.7% of residents speak Spanish at home 405 100.0% Speak English very well6.4% of residents speak other language at home 660 94.2% Speak English very well41 5.8% Speak English less than very well
English speakers - Native, born elsewhere 44.1% of residents of Blaine speak English at home.
14.0% of residents speak Spanish at home 85 92.4% Speak English very well7 7.6% Speak English less than very well49.8% of residents speak other language at home 327 100.0% Speak English very well
English speakers - Foreign-born 14.5% of residents of Blaine speak English at home.
10.8% of residents speak Spanish at home 256 22.2% Speak English very well899 77.8% Speak English less than very well75.2% of residents speak other language at home 3,686 46.0% Speak English very well4,319 54.0% Speak English less than very well
White (Caucasian) - Speak only English Native:
96.9% (49,829)Foreign-born:
10.9% (438)
White (Caucasian) - Speak another language Native:
3.1% (1,572)Foreign-born:
89.1% (3,577)
Black or African American - Speak only English Native:
67.3% (1,752)Foreign-born:
17.1% (423)
Black or African American - Speak another language Native:
35.3% (919)Foreign-born:
82.9% (2,051)
American Indian / Alaska Native - Speak another language Native:
16.8% (45)Foreign-born:
100.0% (70)
Asian - Speak only English Native:
21.7% (533)Foreign-born:
12.6% (278)
Asian - Speak another language Native:
78.3% (1,925)Foreign-born:
87.4% (1,936)
Other race - Speak only English Native:
41.2% (366)Foreign-born:
7.5% (89)
Other race - Speak another language Native:
57.4% (510)Foreign-born:
81.4% (966)
Two or more races - Speak only English Native:
98.5% (4,135)Foreign-born:
35.1% (96)
Two or more races - Speak another language Native:
3.2% (134)Foreign-born:
39.2% (107)
White alone - Speak only English Native:
97.3% (49,626)Foreign-born:
11.1% (438)
White alone - Speak another language Native:
2.7% (1,384)Foreign-born:
88.9% (3,495)
Hispanic or Latino - Speak only English Native:
44.2% (804)Foreign-born:
18.1% (271)
Hispanic or Latino - Speak another language Native:
55.1% (1,001)Foreign-born:
79.8% (1,194)
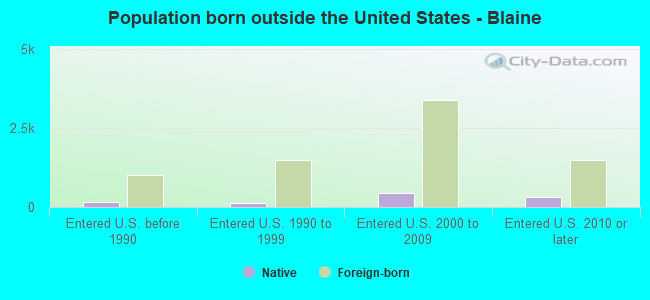
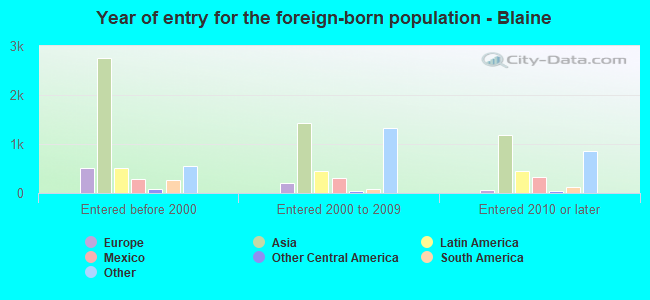
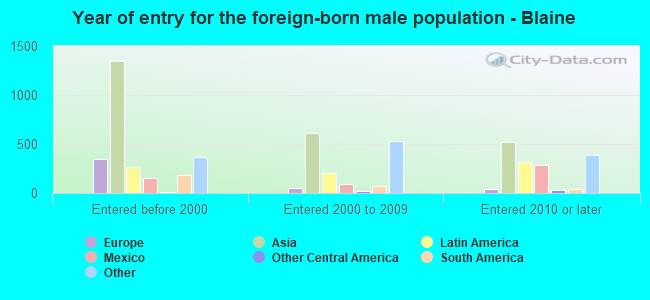
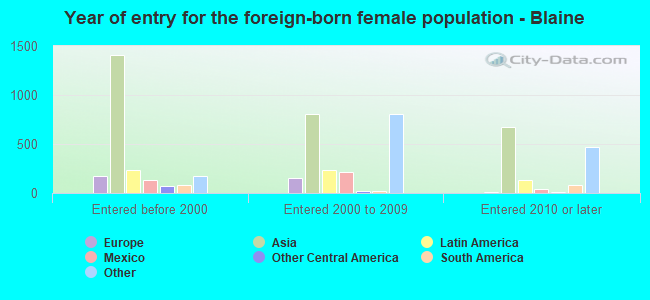
Foreign-born residents in Blaine 9,598 residents are foreign born (6.5% Asia , 3.5% Africa , 1.9% Latin America ).
This city:
13.5%Minnesota:
8.5%
Marital status for residents in Blaine Marital status - White (Caucasian) population 15 years and over
Males 31.7% Never married55.2% Now married0.0% Separated1.5% Widowed11.6% DivorcedFemales 28.8% Never married53.5% Now married0.9% Separated5.0% Widowed11.8% DivorcedWomen who gave birth in the past 12 months Now married:
91.8% (506)Unmarried:
8.2% (45)
Women who did not give birth in the past 12 months Now married:
47.8% (6,010)Unmarried:
52.2% (6,568)
Marital status - Black or African American population 15 years and over
Males 32.8% Never married60.2% Now married2.8% Separated0.0% Widowed4.2% DivorcedFemales 44.2% Never married41.0% Now married5.1% Separated2.9% Widowed6.8% DivorcedWomen who gave birth in the past 12 months Now married:
82.2% (94)Unmarried:
17.8% (20)
Women who did not give birth in the past 12 months Now married:
39.3% (564)Unmarried:
60.7% (870)
Marital status - American Indian / Alaska Native population 15 years and over
Males 35.2% Never married19.6% Now married0.0% Separated0.0% Widowed45.3% DivorcedFemales 80.6% Never married18.3% Now married1.1% Separated0.0% Widowed0.0% DivorcedWomen who did not give birth in the past 12 months Now married:
1.6% (1)Unmarried:
98.4% (63)
Marital status - Asian population 15 years and over
Males 35.9% Never married60.1% Now married1.3% Separated0.0% Widowed2.7% DivorcedFemales 31.3% Never married52.1% Now married1.1% Separated7.2% Widowed8.3% DivorcedWomen who gave birth in the past 12 months Now married:
96.5% (135)Unmarried:
3.5% (5)
Women who did not give birth in the past 12 months Now married:
46.5% (981)Unmarried:
53.5% (1,129)
Marital status - Other race population 15 years and over
Males 47.6% Never married44.6% Now married1.7% Separated0.0% Widowed6.1% DivorcedFemales 39.2% Never married54.4% Now married0.0% Separated3.6% Widowed2.8% DivorcedWomen who did not give birth in the past 12 months Now married:
46.6% (315)Unmarried:
53.4% (361)
Marital status - Two or more races population 15 years and over
Males 66.4% Never married25.5% Now married0.0% Separated2.4% Widowed5.7% DivorcedFemales 51.7% Never married42.0% Now married0.0% Separated1.7% Widowed4.6% DivorcedWomen who gave birth in the past 12 months Now married:
48.6% (25)Unmarried:
51.4% (26)
Women who did not give birth in the past 12 months Now married:
35.1% (439)Unmarried:
64.9% (812)
Marital status - White alone, not Hispanic / Latino population 15 years and over
Males 31.6% Never married55.3% Now married0.0% Separated1.5% Widowed11.7% DivorcedFemales 28.7% Never married53.6% Now married0.9% Separated5.0% Widowed11.9% DivorcedWomen who gave birth in the past 12 months Now married:
91.8% (506)Unmarried:
8.2% (45)
Women who did not give birth in the past 12 months Now married:
48.0% (5,968)Unmarried:
52.0% (6,467)
Marital status - Hispanic or Latino population 15 years and over
Males 44.2% Never married50.4% Now married0.9% Separated0.0% Widowed4.4% DivorcedFemales 41.7% Never married51.1% Now married0.5% Separated0.8% Widowed5.9% DivorcedWomen who gave birth in the past 12 months Now married:
100.0% (53)Unmarried:
0.0% (0)
Women who did not give birth in the past 12 months Now married:
43.3% (484)Unmarried:
56.7% (633)
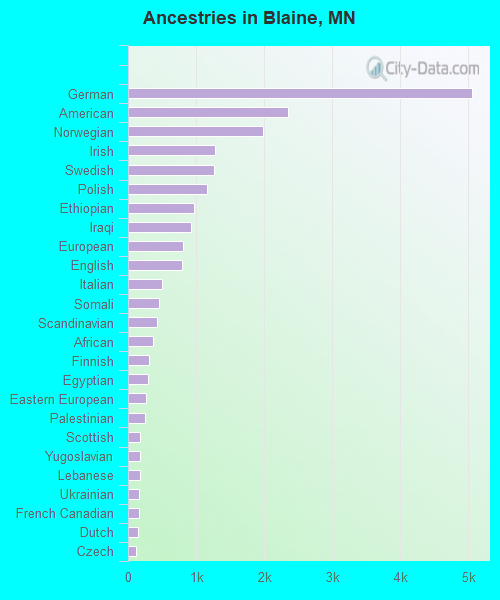
Ancestries in Blaine
5,050 15.6% German2,350 7.3% American1,976 6.1% Norwegian1,276 4.0% Irish1,258 3.9% Swedish1,154 3.6% Polish963 3.0% Ethiopian925 2.9% Iraqi803 2.5% European795 2.5% English498 1.5% Italian455 1.4% Somali420 1.3% Scandinavian360 1.1% African309 1.0% Finnish299 0.9% Egyptian265 0.8% Eastern European249 0.8% Palestinian175 0.5% Scottish171 0.5% Yugoslavian170 0.5% Lebanese158 0.5% Ukrainian156 0.5% French Canadian141 0.4% Dutch124 0.4% Czech124 0.4% French115 0.4% Scotch-Irish108 0.3% Kenyan100 0.3% Danish95 0.3% Northern European88 0.3% Jordanian87 0.3% Welsh82 0.3% Liberian77 0.2% Hungarian54 0.2% Nigerian54 0.2% West Indian51 0.2% Lithuanian47 0.1% Romanian37 0.1% Latvian33 0.1% Croatian30 0.09% Austrian29 0.09% Russian29 0.09% Swiss27 0.08% Slovene27 0.08% Guyanese20 0.06% Greek19 0.06% Ghanaian18 0.06% Arab13 0.04% Syrian10 0.03% Sierra Leonean9 0.03% Czechoslovakian7 0.02% British5 0.02% Serbian4 0.01% Slavic
Geographical mobility in Blaine Same house 1 year ago 50,197 86.0% White (Caucasian)4,337 82.1% Black or African American305 94.3% American Indian / Alaska Native5,743 87.2% Asian1,894 85.1% Other race4,637 94.3% Two or more races49,732 85.9% White alone, not Hispanic / Latino3,198 88.9% Hispanic or LatinoMoved within same county 6,082 10.4% White / Caucasian535 10.1% Black or African American292 4.4% Asian112 5.0% Other race186 3.8% Two or more races6,074 10.5% White alone, not Hispanic / Latino137 3.8% Hispanic or LatinoMoved within same state 1,628 2.8% White / Caucasian278 5.3% Black or African American25 7.7% American Indian / Alaska Native404 6.1% Asian6 100.0% Native Hawaiian / Pacific Islander134 6.0% Other race58 1.2% Two or more races1,628 2.8% White alone, not Hispanic / Latino151 4.2% Hispanic or LatinoMoved from different state 332 0.6% White / Caucasian1 0.3% American Indian / Alaska Native146 2.2% Asian30 1.3% Other race30 0.6% Two or more races332 0.6% White alone, not Hispanic / Latino19 0.5% Hispanic or LatinoMoved from abroad 148 0.3% White36 0.7% Black or African American21 0.3% Asian19 0.9% Other race20 0.4% Two or more races148 0.3% White alone, not Hispanic / Latino37 1.0% Hispanic or Latino
Children Nativity (place of birth) in Blaine
Children under 6 years - Living with two parents Both parents native 3,072 100.0% NativeBoth parents foreign-born 745 95.3% Native36 4.7% Foreign-bornOne native, one foreign-born parent 283 100.0% NativeChildren under 6 years - Living with one parent Native parent 593 100.0% NativeForeign-born parent 559 97.0% Native17 3.0% Foreign-bornChildren 6 to 17 years - Living with two parents Both parents native 4,782 99.4% Native28 0.6% Foreign-bornBoth parents foreign-born 1,865 74.4% Native642 25.6% Foreign-bornOne native, one foreign-born parent 883 98.5% Native13 1.5% Foreign-bornChildren 6 to 17 years - Living with one parent Native parent 2,611 100.0% NativeForeign-born parent 967 51.2% Native922 48.8% Foreign-born
Grandparents responsible for own grandchildren in Blaine
Grandparents (30 to 59 years) White / Caucasian 59 32.6% Responsible for grandchildren123 67.4% Not responsible for grandchildrenBlack or African American 89 100.0% Not responsible for grandchildrenAmerican Indian / Alaska Native 1 65.2% Responsible for grandchildren1 34.8% Not responsible for grandchildrenAsian 20 100.0% Not responsible for grandchildrenOther race 21 100.0% Not responsible for grandchildrenTwo or more races 7 100.0% Not responsible for grandchildrenWhite alone, not Hispanic / Latino 59 31.1% Responsible for grandchildren131 68.9% Not responsible for grandchildrenHispanic or Latino 4 100.0% Not responsible for grandchildrenGrandparents (60 years and over) White / Caucasian 35 12.0% Responsible for grandchildren258 88.0% Not responsible for grandchildrenBlack or African American 10 8.7% Responsible for grandchildren106 91.3% Not responsible for grandchildrenAsian 22 11.2% Responsible for grandchildren178 88.8% Not responsible for grandchildrenOther race 41 100.0% Not responsible for grandchildrenTwo or more races 74 100.0% Not responsible for grandchildrenWhite alone, not Hispanic / Latino 35 12.0% Responsible for grandchildren258 88.0% Not responsible for grandchildrenHispanic or Latino 86 100.0% Not responsible for grandchildren