Races in Bismarck, North Dakota (ND) Detailed Stats
Data:
Races - White alone (%)
Races - White alone (% change since 2000)
Races - Black alone (%)
Races - Black alone (% change since 2000)
Races - American Indian alone (%)
Races - American Indian alone (% change since 2000)
Races - Asian alone (%)
Races - Asian alone (% change since 2000)
Races - Hispanic (%)
Races - Hispanic (% change since 2000)
Races - Native Hawaiian and Other Pacific Islander alone (%)
Races - Native Hawaiian and Other Pacific Islander alone (% change since 2000)
Races - Two or more races(%)
Races - Two or more races(% change since 2000)
Races - Other race alone (%)
Races - Other race alone (% change since 2000)
Racial diversity
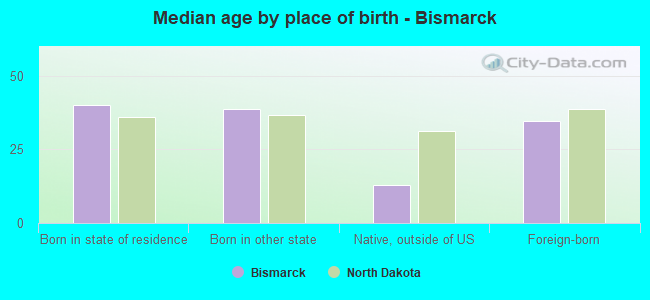
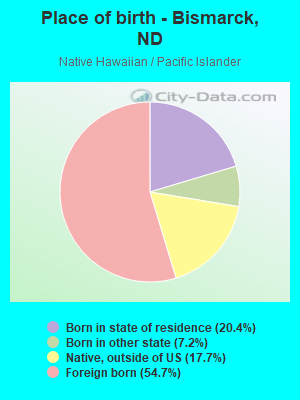
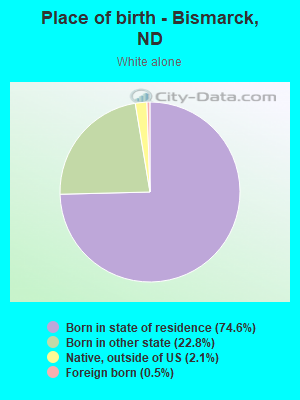
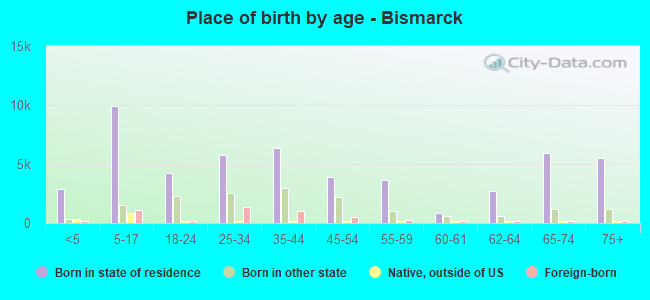
Place of birth - Born in state of residence (%)
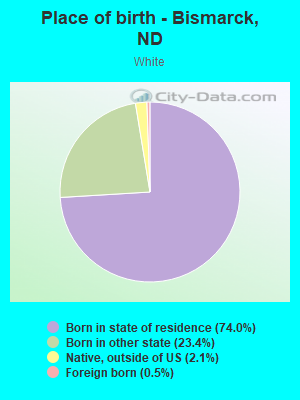
Place of birth - Born in state of residence (%) - White
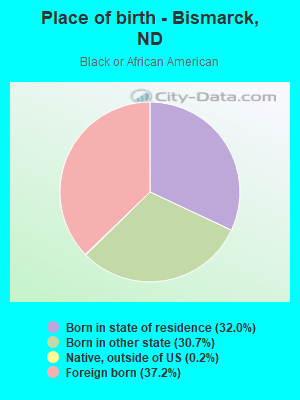
Place of birth - Born in state of residence (%) - Black or African American
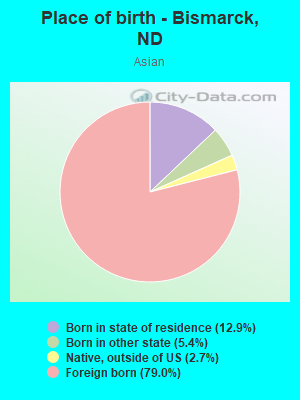
Place of birth - Born in state of residence (%) - Asian
Place of birth - Born in state of residence (%) - Hispanic or Latino
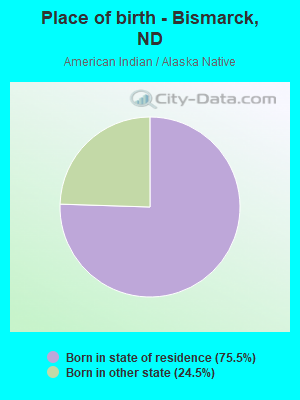
Place of birth - Born in state of residence (%) - American Indian and Alaska Native
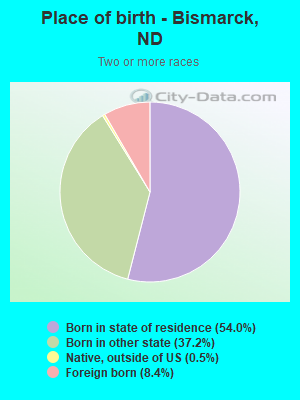
Place of birth - Born in state of residence (%) - Multirace
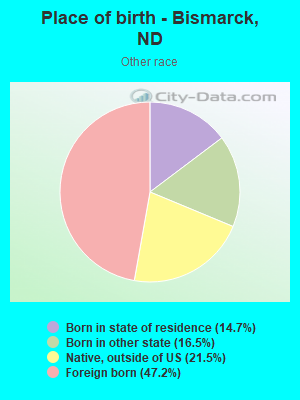
Place of birth - Born in state of residence (%) - Other Race
Place of birth - Born in other state (%)
Place of birth - Born in other state (%) - White
Place of birth - Born in other state (%) - Black or African American
Place of birth - Born in other state (%) - Asian
Place of birth - Born in other state (%) - Hispanic or Latino
Place of birth - Born in other state (%) - American Indian and Alaska Native
Place of birth - Born in other state (%) - Multirace
Place of birth - Born in other state (%) - Other Race
Place of birth - Native, outside of US (%)
Place of birth - Native, outside of US (%) - White
Place of birth - Native, outside of US (%) - Black or African American
Place of birth - Native, outside of US (%) - Asian
Place of birth - Native, outside of US (%) - Hispanic or Latino
Place of birth - Native, outside of US (%) - American Indian and Alaska Native
Place of birth - Native, outside of US (%) - Multirace
Place of birth - Native, outside of US (%) - Other Race
Place of birth - Foreign born (%)
Place of birth - Foreign born (%) - White
Place of birth - Foreign born (%) - Black or African American
Place of birth - Foreign born (%) - Asian
Place of birth - Foreign born (%) - Hispanic or Latino
Place of birth - Foreign born (%) - American Indian and Alaska Native
Place of birth - Foreign born (%) - Multirace
Place of birth - Foreign born (%) - Other Race
Residents speaking English at home (%)
Residents speaking English at home - Born in the United States (%)
Residents speaking English at home - Native, born elsewhere (%)
Residents speaking English at home - Foreign born (%)
Residents speaking Spanish at home (%)
Residents speaking Spanish at home - Born in the United States (%)
Residents speaking Spanish at home - Native, born elsewhere (%)
Residents speaking Spanish at home - Foreign born (%)
Residents speaking other language at home (%)
Residents speaking other language at home - Born in the United States (%)
Residents speaking other language at home - Native, born elsewhere (%)
Residents speaking other language at home - Foreign born (%)
Marital status - Never married (%)
Marital status - Now married (%)
Marital status - Separated (%)
Marital status - Widowed (%)
Marital status - Divorced (%)
Ancestries Reported - Arab (%)
Ancestries Reported - Czech (%)
Ancestries Reported - Danish (%)
Ancestries Reported - Dutch (%)
Ancestries Reported - English (%)
Ancestries Reported - French (%)
Ancestries Reported - French Canadian (%)
Ancestries Reported - German (%)
Ancestries Reported - Greek (%)
Ancestries Reported - Hungarian (%)
Ancestries Reported - Irish (%)
Ancestries Reported - Italian (%)
Ancestries Reported - Lithuanian (%)
Ancestries Reported - Norwegian (%)
Ancestries Reported - Polish (%)
Ancestries Reported - Portuguese (%)
Ancestries Reported - Russian (%)
Ancestries Reported - Scotch-Irish (%)
Ancestries Reported - Scottish (%)
Ancestries Reported - Slovak (%)
Ancestries Reported - Subsaharan African (%)
Ancestries Reported - Swedish (%)
Ancestries Reported - Swiss (%)
Ancestries Reported - Ukrainian (%)
Ancestries Reported - United States (%)
Ancestries Reported - Welsh (%)
Ancestries Reported - West Indian (%)
Ancestries Reported - Other (%)
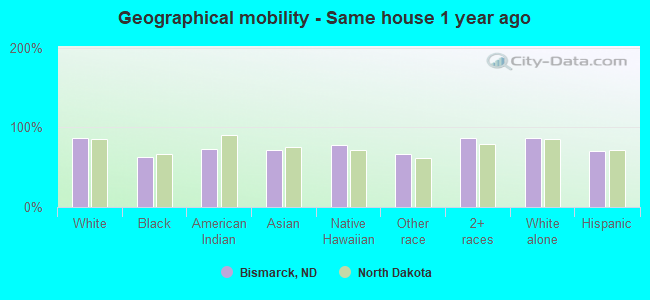
Geographical mobility - Same house 1 year ago (%)
Geographical mobility - Same house 1 year ago (%) - White
Geographical mobility - Same house 1 year ago (%) - Black or African American
Geographical mobility - Same house 1 year ago (%) - Asian
Geographical mobility - Same house 1 year ago (%) - Hispanic or Latino
Geographical mobility - Same house 1 year ago (%) - American Indian and Alaska Native
Geographical mobility - Same house 1 year ago (%) - Multirace
Geographical mobility - Same house 1 year ago (%) - Other Race
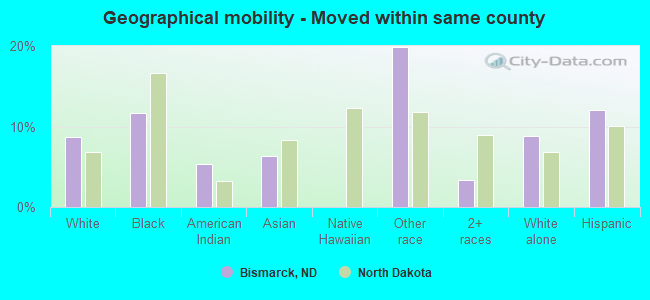
Geographical mobility - Moved within same county (%)
Geographical mobility - Moved within same county (%) - White
Geographical mobility - Moved within same county (%) - Black or African American
Geographical mobility - Moved within same county (%) - Asian
Geographical mobility - Moved within same county (%) - Hispanic or Latino
Geographical mobility - Moved within same county (%) - American Indian and Alaska Native
Geographical mobility - Moved within same county (%) - Multirace
Geographical mobility - Moved within same county (%) - Other Race
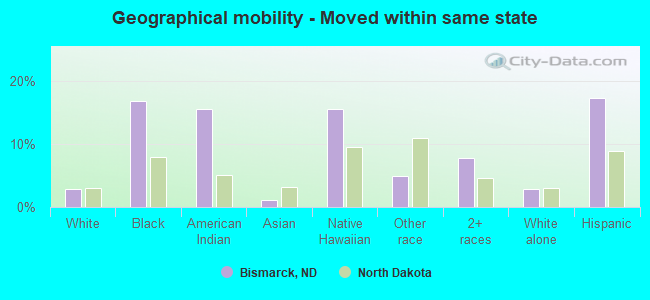
Geographical mobility - Moved from different county within same state (%)
Geographical mobility - Moved from different county within same state (%) - White
Geographical mobility - Moved from different county within same state (%) - Black or African American
Geographical mobility - Moved from different county within same state (%) - Asian
Geographical mobility - Moved from different county within same state (%) - Hispanic or Latino
Geographical mobility - Moved from different county within same state (%) - American Indian and Alaska Native
Geographical mobility - Moved from different county within same state (%) - Multirace
Geographical mobility - Moved from different county within same state (%) - Other Race
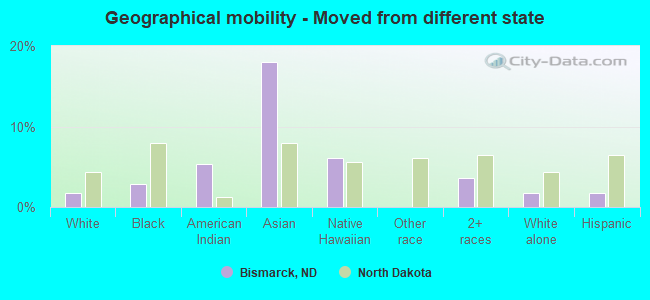
Geographical mobility - Moved from different state (%)
Geographical mobility - Moved from different state (%) - White
Geographical mobility - Moved from different state (%) - Black or African American
Geographical mobility - Moved from different state (%) - Asian
Geographical mobility - Moved from different state (%) - Hispanic or Latino
Geographical mobility - Moved from different state (%) - American Indian and Alaska Native
Geographical mobility - Moved from different state (%) - Multirace
Geographical mobility - Moved from different state (%) - Other Race
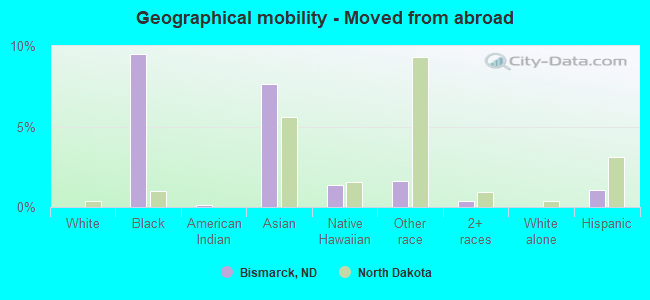
Geographical mobility - Moved from abroad (%)
Geographical mobility - Moved from abroad (%) - White
Geographical mobility - Moved from abroad (%) - Black or African American
Geographical mobility - Moved from abroad (%) - Asian
Geographical mobility - Moved from abroad (%) - Hispanic or Latino
Geographical mobility - Moved from abroad (%) - American Indian and Alaska Native
Geographical mobility - Moved from abroad (%) - Multirace
Geographical mobility - Moved from abroad (%) - Other Race
Place of birth for the foreign-born population - Ireland (%)
Place of birth for the foreign-born population - Denmark (%)
Place of birth for the foreign-born population - Norway (%)
Place of birth for the foreign-born population - Sweden (%)
Place of birth for the foreign-born population - United Kingdom (%)
Place of birth for the foreign-born population - England (%)
Place of birth for the foreign-born population - Scotland (%)
Place of birth for the foreign-born population - Other Northern Europe (%)
Place of birth for the foreign-born population - Austria (%)
Place of birth for the foreign-born population - Belgium (%)
Place of birth for the foreign-born population - France (%)
Place of birth for the foreign-born population - Germany (%)
Place of birth for the foreign-born population - Netherlands (%)
Place of birth for the foreign-born population - Switzerland (%)
Place of birth for the foreign-born population - Other Western Europe (%)
Place of birth for the foreign-born population - Greece (%)
Place of birth for the foreign-born population - Italy (%)
Place of birth for the foreign-born population - Portugal (%)
Place of birth for the foreign-born population - Spain (%)
Place of birth for the foreign-born population - Other Southern Europe (%)
Place of birth for the foreign-born population - Albania (%)
Place of birth for the foreign-born population - Belarus (%)
Place of birth for the foreign-born population - Bosnia and Herzegovina (%)
Place of birth for the foreign-born population - Bulgaria (%)
Place of birth for the foreign-born population - Croatia (%)
Place of birth for the foreign-born population - Czechoslovakia (%)
Place of birth for the foreign-born population - Hungary (%)
Place of birth for the foreign-born population - Latvia (%)
Place of birth for the foreign-born population - Lithuania (%)
Place of birth for the foreign-born population - North Macedonia (Macedonia) (%)
Place of birth for the foreign-born population - Moldova (%)
Place of birth for the foreign-born population - Poland (%)
Place of birth for the foreign-born population - Romania (%)
Place of birth for the foreign-born population - Russia (%)
Place of birth for the foreign-born population - Serbia (%)
Place of birth for the foreign-born population - Ukraine (%)
Place of birth for the foreign-born population - Other Eastern Europe (%)
Place of birth for the foreign-born population - China (%)
Place of birth for the foreign-born population - Hong Kong (%)
Place of birth for the foreign-born population - Taiwan (%)
Place of birth for the foreign-born population - Japan (%)
Place of birth for the foreign-born population - Korea (%)
Place of birth for the foreign-born population - Other Eastern Asia (%)
Place of birth for the foreign-born population - Afghanistan (%)
Place of birth for the foreign-born population - Bangladesh (%)
Place of birth for the foreign-born population - India (%)
Place of birth for the foreign-born population - Iran (%)
Place of birth for the foreign-born population - Kazakhstan (%)
Place of birth for the foreign-born population - Nepal (%)
Place of birth for the foreign-born population - Pakistan (%)
Place of birth for the foreign-born population - Sri Lanka (%)
Place of birth for the foreign-born population - Uzbekistan (%)
Place of birth for the foreign-born population - Other South Central Asia (%)
Place of birth for the foreign-born population - Burma (%)
Place of birth for the foreign-born population - Cambodia (%)
Place of birth for the foreign-born population - Indonesia (%)
Place of birth for the foreign-born population - Laos (%)
Place of birth for the foreign-born population - Malaysia (%)
Place of birth for the foreign-born population - Philippines (%)
Place of birth for the foreign-born population - Singapore (%)
Place of birth for the foreign-born population - Thailand (%)
Place of birth for the foreign-born population - Vietnam (%)
Place of birth for the foreign-born population - Other South Eastern Asia (%)
Place of birth for the foreign-born population - Armenia (%)
Place of birth for the foreign-born population - Iraq (%)
Place of birth for the foreign-born population - Israel (%)
Place of birth for the foreign-born population - Jordan (%)
Place of birth for the foreign-born population - Kuwait (%)
Place of birth for the foreign-born population - Lebanon (%)
Place of birth for the foreign-born population - Saudi Arabia (%)
Place of birth for the foreign-born population - Syria (%)
Place of birth for the foreign-born population - Turkey (%)
Place of birth for the foreign-born population - Yemen (%)
Place of birth for the foreign-born population - Other Western Asia (%)
Place of birth for the foreign-born population - Eritrea (%)
Place of birth for the foreign-born population - Ethiopia (%)
Place of birth for the foreign-born population - Kenya (%)
Place of birth for the foreign-born population - Somalia (%)
Place of birth for the foreign-born population - Uganda (%)
Place of birth for the foreign-born population - Zimbabwe (%)
Place of birth for the foreign-born population - Other Eastern Africa (%)
Place of birth for the foreign-born population - Cameroon (%)
Place of birth for the foreign-born population - Congo (%)
Place of birth for the foreign-born population - Democratic Republic of Congo (Zaire) (%)
Place of birth for the foreign-born population - Other Middle Africa (%)
Place of birth for the foreign-born population - Egypt (%)
Place of birth for the foreign-born population - Morocco (%)
Place of birth for the foreign-born population - Sudan (%)
Place of birth for the foreign-born population - Other Northern Africa (%)
Place of birth for the foreign-born population - South Africa (%)
Place of birth for the foreign-born population - Other Southern Africa (%)
Place of birth for the foreign-born population - Cabo Verde (%)
Place of birth for the foreign-born population - Ghana (%)
Place of birth for the foreign-born population - Liberia (%)
Place of birth for the foreign-born population - Nigeria (%)
Place of birth for the foreign-born population - Senegal (%)
Place of birth for the foreign-born population - Sierra Leone (%)
Place of birth for the foreign-born population - Other Western Africa (%)
Place of birth for the foreign-born population - Australia (%)
Place of birth for the foreign-born population - New Zealand (%)
Place of birth for the foreign-born population - Fiji (%)
Place of birth for the foreign-born population - Micronesia (%)
Place of birth for the foreign-born population - Bahamas (%)
Place of birth for the foreign-born population - Barbados (%)
Place of birth for the foreign-born population - Cuba (%)
Place of birth for the foreign-born population - Dominica (%)
Place of birth for the foreign-born population - Dominican Republic (%)
Place of birth for the foreign-born population - Grenada (%)
Place of birth for the foreign-born population - Haiti (%)
Place of birth for the foreign-born population - Jamaica (%)
Place of birth for the foreign-born population - St. Vincent and the Grenadines (%)
Place of birth for the foreign-born population - Trinidad and Tobago (%)
Place of birth for the foreign-born population - West Indies (%)
Place of birth for the foreign-born population - Other Caribbean (%)
Place of birth for the foreign-born population - Belize (%)
Place of birth for the foreign-born population - Costa Rica (%)
Place of birth for the foreign-born population - El Salvador (%)
Place of birth for the foreign-born population - Guatemala (%)
Place of birth for the foreign-born population - Honduras (%)
Place of birth for the foreign-born population - Mexico (%)
Place of birth for the foreign-born population - Nicaragua (%)
Place of birth for the foreign-born population - Panama (%)
Place of birth for the foreign-born population - Other Central America (%)
Place of birth for the foreign-born population - Argentina (%)
Place of birth for the foreign-born population - Bolivia (%)
Place of birth for the foreign-born population - Brazil (%)
Place of birth for the foreign-born population - Chile (%)
Place of birth for the foreign-born population - Colombia (%)
Place of birth for the foreign-born population - Ecuador (%)
Place of birth for the foreign-born population - Guyana (%)
Place of birth for the foreign-born population - Peru (%)
Place of birth for the foreign-born population - Uruguay (%)
Place of birth for the foreign-born population - Venezuela (%)
Place of birth for the foreign-born population - Other South America (%)
Place of birth for the foreign-born population - Canada (%)
Place of birth for the foreign-born population - Other Northern America (%)
Place of birth for the foreign-born population - Other (%)
Latest news about races in Bismarck, ND collected exclusively by city-data.com from local newspapers, TV, and radio stations
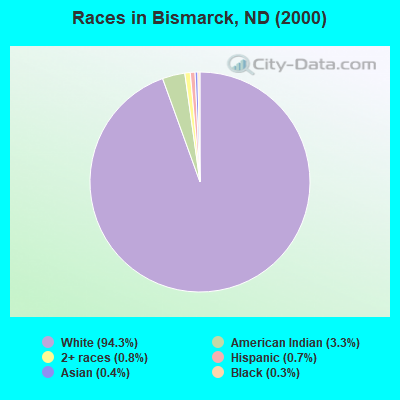
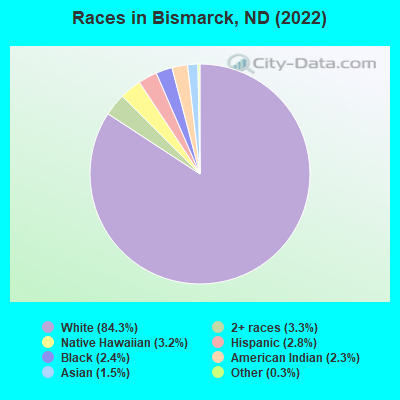
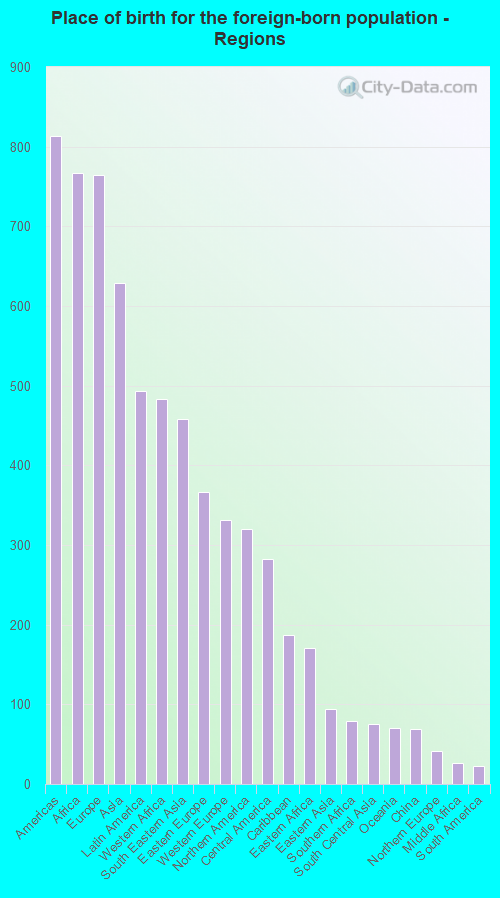
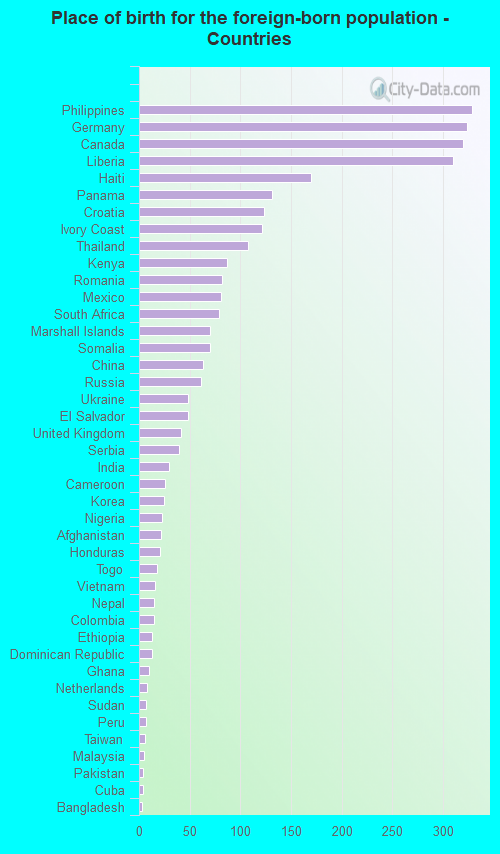
According to 2022 data, the most numerous races in Bismarck, ND are White alone (62,762 residents), Hispanic (2,117 residents), and American Indian alone (1,677 residents). 94.2% of Bismarck residents speak English at home. 4.1% of Bismarck, ND residents are foreign-born (1.0% born in Africa, 1.0% born in Europe, 0.8% born in Asia, 0.7% born in Latin America, 0.4% born in North America), which is 2.4% greater than the foreign-born rate of 4.0% across the entire state of North Dakota.
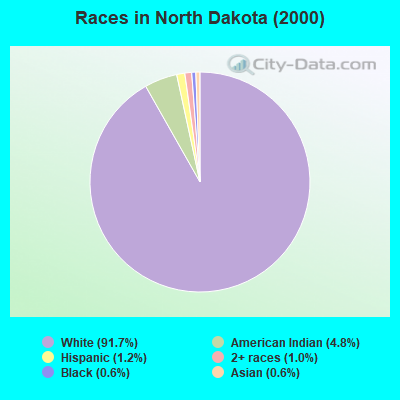
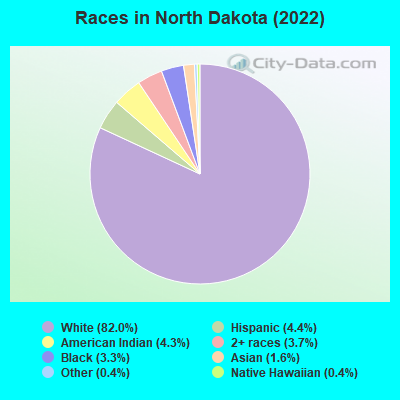
Race distribution in Bismarck
2000 2022
589,149 91.7% White alone 30,772 4.8% American Indian alone 7,786 1.2% Hispanic 6,666 1.0% Two or more races 3,761 0.6% Black alone 3,566 0.6% Asian alone 282 0.04% Other race alone 218 0.03% Native Hawaiian and Other
639,297 82.0% White alone 34,233 4.4% Hispanic 33,252 4.3% American Indian alone 28,831 3.7% Two or more races 25,426 3.3% Black alone 12,271 1.6% Asian alone 3,206 0.4% Other race alone 2,745 0.4% Native Hawaiian and Other
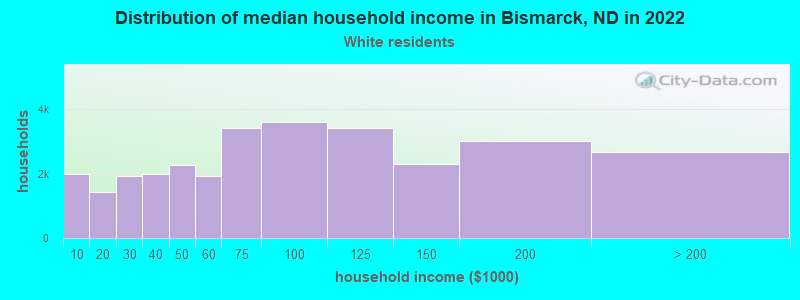
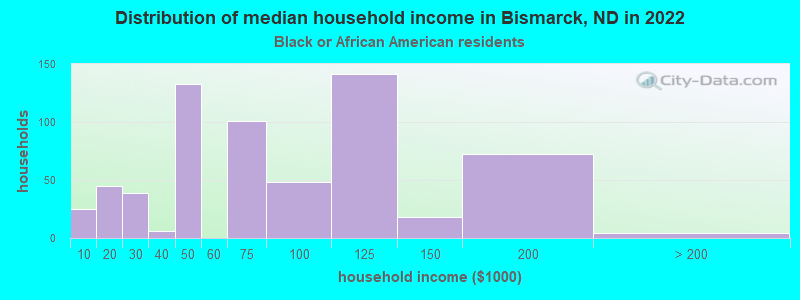
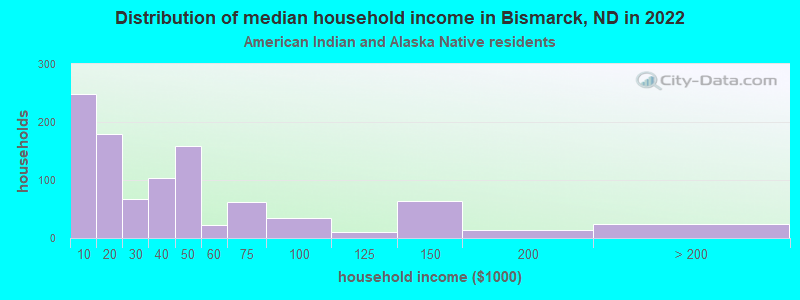
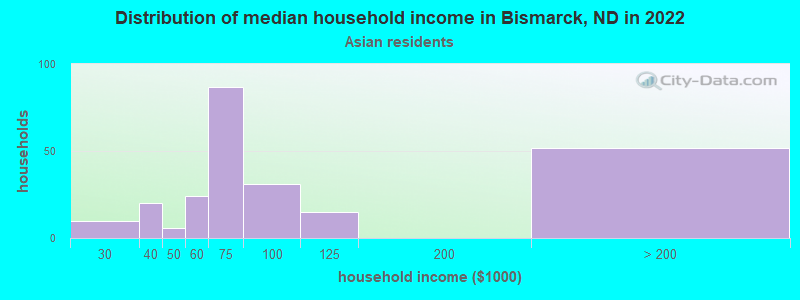
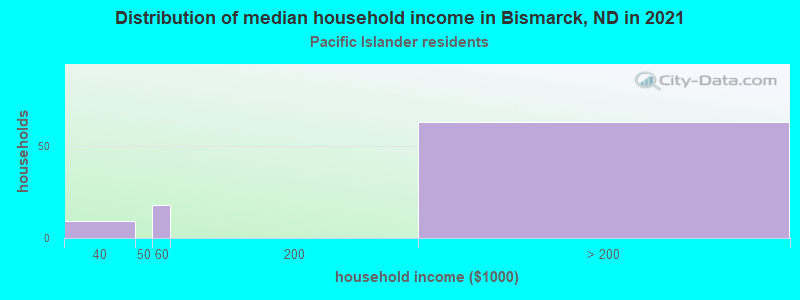
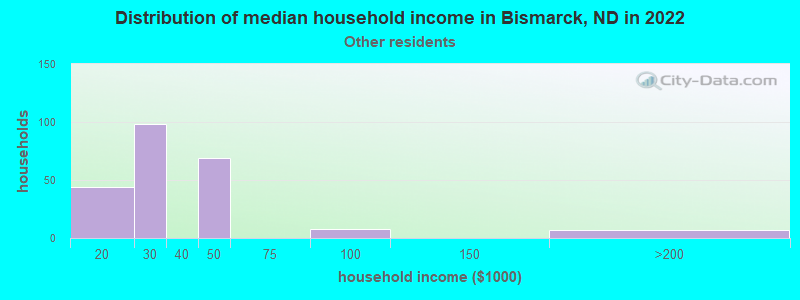
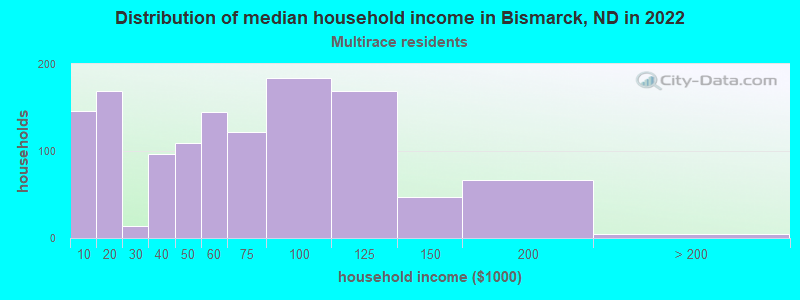
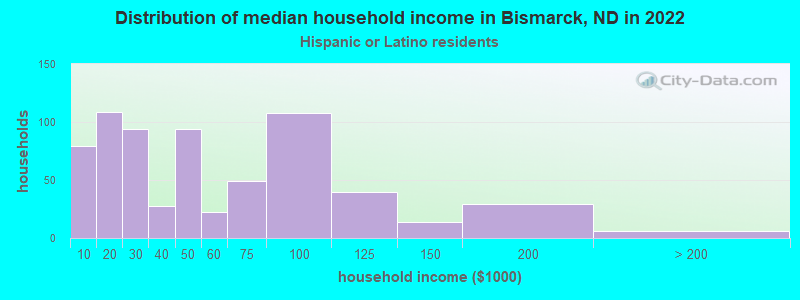
Income and house value in Bismarck Median household income in 2022 $75,086 White non-Hispanic householders$33,372 American Indian and Alaska Native householders$71,760 Asian householders$15,459 Some other race householders$56,201 Two or more races householders$34,417 Hispanic or Latino race householdersMedian 2022 house value $336,855 White Non-Hispanic householders$155,631 Black or African American householders$151,481 American Indian or Alaska Native householders $416,745 Asian householders$403,603 Some other race householders$259,385 Two or more races householders$328,554 Hispanic or Latino householders
Median age by race in Bismarck
42.1 Median age for White residents41.6 42.5 36.5 Median age for Black or African American residents36.3 -666,666,666.0 20.7 Median age for American Indian / Alaska Native residents23.0 20.4 34.4 Median age for Asian residents34.5 34.4 30.6 Median age for Native Hawaiian / Pacific Islander residents19.3 31.1 53.7 Median age for Other race residents-666,666,666.0 53.8 21.1 Median age for Two or more races residents24.5 10.7 42.6 Median age for White alone residents42.1 44.0 25.2 Median age for Hispanic or Latino residents18.1 26.9
Owner/renter occupied households by race in Bismarck
House owners and renters - White residents 20,919 70.1% Owner occupied8,927 29.9% Renter occupiedHouse owners and renters - Black or African American residents 192 31.3% Owner occupied423 68.7% Renter occupiedHouse owners and renters - American Indian / Alaska Native residents 278 29.6% Owner occupied662 70.4% Renter occupiedHouse owners and renters - Asian residents 39 13.3% Owner occupied255 86.7% Renter occupiedHouse owners and renters - Native Hawaiian / Pacific Islander residents 129 100.0% Renter occupiedHouse owners and renters - Other race residents 51 24.6% Owner occupied157 75.4% Renter occupiedHouse owners and renters - Two or more races residents 205 22.3% Owner occupied713 77.7% Renter occupiedHouse owners and renters - White alone residents 20,796 71.0% Owner occupied8,485 29.0% Renter occupiedHouse owners and renters - Hispanic or Latino residents 123 12.8% Owner occupied840 87.2% Renter occupied
Language usage in Bismarck
English speakers - Total 94.2% of residents of Bismarck speak English at home.
1.6% of residents speak Spanish at home 620 55.8% Speak English very well492 44.2% Speak English less than very well4.3% of residents speak other language at home 2,169 71.9% Speak English very well847 28.1% Speak English less than very well
English speakers - Born in the United States 96.4% of residents of Bismarck speak English at home.
2.3% of residents speak Spanish at home 342 91.9% Speak English very well30 8.1% Speak English less than very well1.3% of residents speak other language at home 210 96.8% Speak English very well7 3.2% Speak English less than very well
English speakers - Native, born elsewhere 85.2% of residents of Bismarck speak English at home.
4.0% of residents speak Spanish at home 57 100.0% Speak English less than very well10.8% of residents speak other language at home 152 100.0% Speak English very well
English speakers - Foreign-born 55.3% of residents of Bismarck speak English at home.
8.8% of residents speak Spanish at home 165 42.0% Speak English very well228 58.0% Speak English less than very well35.9% of residents speak other language at home 1,053 65.5% Speak English very well554 34.5% Speak English less than very well
White (Caucasian) - Speak only English Native:
97.9% (57,814)Foreign-born:
38.4% (280)
White (Caucasian) - Speak another language Native:
2.1% (1,248)Foreign-born:
57.7% (421)
Black or African American - Speak only English Native:
100.0% (1,072)Foreign-born:
59.7% (454)
Black or African American - Speak another language Native:
1.1% (12)Foreign-born:
46.4% (353)
Asian - Speak only English Native:
69.5% (73)Foreign-born:
15.8% (89)
Asian - Speak another language Native:
19.6% (21)Foreign-born:
83.3% (470)
Native Hawaiian / Pacific Islander - Speak only English Native:
99.5% (211)Foreign-born:
77.9% (288)
Other race - Speak another language Native:
74.4% (373)Foreign-born:
99.1% (369)
Two or more races - Speak another language Native:
9.3% (272)Foreign-born:
90.0% (310)
White alone - Speak only English Native:
97.9% (57,568)Foreign-born:
40.1% (288)
White alone - Speak another language Native:
2.1% (1,260)Foreign-born:
55.4% (397)
Hispanic or Latino - Speak another language Native:
55.3% (801)Foreign-born:
100.0% (393)
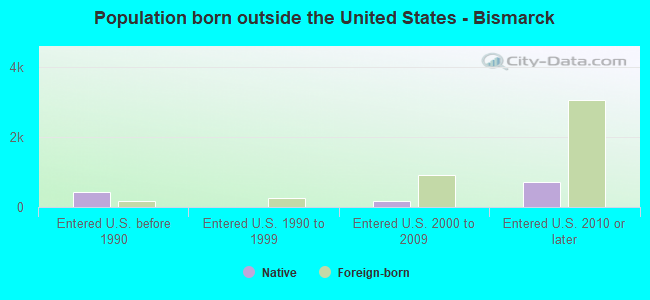
Foreign-born residents in Bismarck 3,046 residents are foreign born (1.0% Africa , 1.0% Europe , 0.8% Asia , 0.7% Latin America , 0.4% North America ).
This city:
4.1%North Dakota:
4.6%
Marital status for residents in Bismarck Marital status - White (Caucasian) population 15 years and over
Males 33.9% Never married55.3% Now married1.1% Separated4.1% Widowed5.6% DivorcedFemales 26.3% Never married53.4% Now married0.4% Separated11.4% Widowed8.6% DivorcedWomen who gave birth in the past 12 months Now married:
91.1% (533)Unmarried:
8.9% (52)
Women who did not give birth in the past 12 months Now married:
50.3% (6,581)Unmarried:
49.7% (6,515)
Marital status - Black or African American population 15 years and over
Males 47.8% Never married42.7% Now married0.0% Separated0.0% Widowed9.4% DivorcedFemales 41.9% Never married31.1% Now married0.0% Separated0.0% Widowed26.9% DivorcedWomen who gave birth in the past 12 months Now married:
100.0% (22)Unmarried:
0.0% (0)
Women who did not give birth in the past 12 months Now married:
43.3% (133)Unmarried:
56.7% (175)
Marital status - American Indian / Alaska Native population 15 years and over
Males 77.3% Never married20.6% Now married0.2% Separated0.0% Widowed1.9% DivorcedFemales 67.0% Never married25.8% Now married0.1% Separated1.1% Widowed6.0% DivorcedWomen who gave birth in the past 12 months Now married:
100.0% (50)Unmarried:
0.0% (0)
Women who did not give birth in the past 12 months Now married:
12.0% (96)Unmarried:
88.0% (703)
Marital status - Asian population 15 years and over
Males 40.8% Never married59.2% Now married0.0% Separated0.0% Widowed0.0% DivorcedFemales 25.8% Never married56.9% Now married13.2% Separated1.8% Widowed2.3% DivorcedWomen who gave birth in the past 12 months Now married:
100.0% (22)Unmarried:
0.0% (0)
Women who did not give birth in the past 12 months Now married:
68.9% (221)Unmarried:
31.1% (100)
Marital status - Native Hawaiian / Pacific Islander population 15 years and over
Males 48.2% Never married51.8% Now married0.0% Separated0.0% Widowed0.0% DivorcedFemales 42.1% Never married37.5% Now married0.0% Separated0.0% Widowed20.4% DivorcedWomen who gave birth in the past 12 months Now married:
100.0% (54)Unmarried:
0.0% (0)
Women who did not give birth in the past 12 months Now married:
10.0% (16)Unmarried:
90.0% (142)
Marital status - Other race population 15 years and over
Males 55.4% Never married24.7% Now married2.2% Separated0.0% Widowed17.7% DivorcedFemales 57.0% Never married14.1% Now married0.0% Separated8.9% Widowed20.0% DivorcedWomen who did not give birth in the past 12 months Now married:
8.0% (23)Unmarried:
92.0% (265)
Marital status - Two or more races population 15 years and over
Males 61.9% Never married29.6% Now married6.1% Separated0.0% Widowed2.4% DivorcedFemales 52.1% Never married32.2% Now married5.6% Separated0.0% Widowed10.1% DivorcedWomen who gave birth in the past 12 months Now married:
41.4% (33)Unmarried:
58.6% (47)
Women who did not give birth in the past 12 months Now married:
25.4% (206)Unmarried:
74.6% (605)
Marital status - White alone, not Hispanic / Latino population 15 years and over
Males 34.0% Never married55.1% Now married1.1% Separated4.1% Widowed5.7% DivorcedFemales 25.1% Never married54.1% Now married0.4% Separated11.6% Widowed8.7% DivorcedWomen who gave birth in the past 12 months Now married:
91.1% (533)Unmarried:
8.9% (52)
Women who did not give birth in the past 12 months Now married:
51.6% (6,458)Unmarried:
48.4% (6,059)
Marital status - Hispanic or Latino population 15 years and over
Males 72.1% Never married21.1% Now married2.0% Separated0.0% Widowed4.9% DivorcedFemales 56.4% Never married20.4% Now married0.8% Separated5.0% Widowed17.4% DivorcedWomen who gave birth in the past 12 months Now married:
0.0% (0)Unmarried:
100.0% (16)
Women who did not give birth in the past 12 months Now married:
9.8% (48)Unmarried:
90.2% (443)
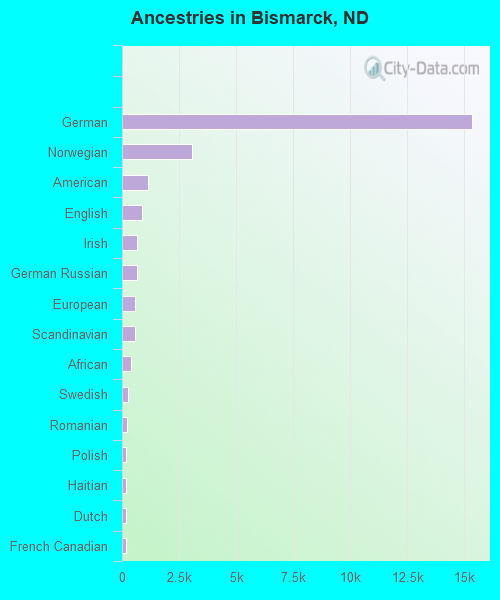
Ancestries in Bismarck
15,328 48.4% German3,074 9.7% Norwegian1,128 3.6% American874 2.8% English664 2.1% Irish639 2.0% German Russian585 1.8% European579 1.8% Scandinavian410 1.3% African279 0.9% Swedish229 0.7% Romanian165 0.5% Polish165 0.5% Haitian161 0.5% Dutch161 0.5% French Canadian133 0.4% French122 0.4% Ukrainian106 0.3% Italian100 0.3% Kenyan99 0.3% Czech89 0.3% Russian82 0.3% Icelander78 0.2% Croatian77 0.2% British68 0.2% Lebanese58 0.2% Danish51 0.2% Serbian47 0.1% Finnish45 0.1% Hungarian42 0.1% Scotch-Irish34 0.1% Scottish34 0.1% Yugoslavian32 0.1% Northern European31 0.10% Liberian29 0.09% Nigerian28 0.09% Afghan18 0.06% Jamaican16 0.05% Austrian16 0.05% Portuguese16 0.05% Ethiopian16 0.05% Canadian14 0.04% Slovene11 0.03% Albanian11 0.03% Ghanaian9 0.03% Swiss8 0.03% Pennsylvania German7 0.02% Sudanese
Geographical mobility in Bismarck Same house 1 year ago 55,041 86.7% White (Caucasian)1,178 62.4% Black or African American2,073 72.9% American Indian / Alaska Native511 71.7% Asian461 78.0% Native Hawaiian / Pacific Islander573 66.3% Other race2,719 86.4% Two or more races54,052 86.5% White alone, not Hispanic / Latino1,447 70.9% Hispanic or LatinoMoved within same county 5,500 8.7% White / Caucasian221 11.7% Black or African American152 5.3% American Indian / Alaska Native45 6.3% Asian171 19.8% Other race105 3.3% Two or more races5,488 8.8% White alone, not Hispanic / Latino246 12.0% Hispanic or LatinoMoved within same state 1,824 2.9% White / Caucasian316 16.7% Black or African American439 15.5% American Indian / Alaska Native8 1.1% Asian91 15.5% Native Hawaiian / Pacific Islander42 4.9% Other race246 7.8% Two or more races1,824 2.9% White alone, not Hispanic / Latino353 17.3% Hispanic or LatinoMoved from different state 1,096 1.7% White / Caucasian55 2.9% Black or African American151 5.3% American Indian / Alaska Native128 18.0% Asian36 6.1% Native Hawaiian / Pacific Islander114 3.6% Two or more races1,096 1.8% White alone, not Hispanic / Latino35 1.7% Hispanic or LatinoMoved from abroad 179 9.5% Black or African American4 0.1% American Indian / Alaska Native54 7.6% Asian8 1.4% Native Hawaiian / Pacific Islander14 1.6% Other race12 0.4% Two or more races21 1.0% Hispanic or Latino
Children Nativity (place of birth) in Bismarck
Children under 6 years - Living with two parents Both parents native 3,222 100.0% NativeBoth parents foreign-born 314 82.3% Native67 17.7% Foreign-bornOne native, one foreign-born parent 131 100.0% NativeChildren under 6 years - Living with one parent Native parent 884 100.0% NativeForeign-born parent 34 100.0% NativeChildren 6 to 17 years - Living with two parents Both parents native 6,842 99.9% Native8 0.1% Foreign-bornBoth parents foreign-born 87 30.4% Native199 69.6% Foreign-bornOne native, one foreign-born parent 228 91.3% Native22 8.7% Foreign-bornChildren 6 to 17 years - Living with one parent Native parent 2,788 99.6% Native10 0.4% Foreign-bornForeign-born parent 278 66.6% Native139 33.4% Foreign-born
Grandparents responsible for own grandchildren in Bismarck
Grandparents (30 to 59 years) White / Caucasian 74 74.7% Responsible for grandchildren25 25.3% Not responsible for grandchildrenBlack or African American 30 100.0% Not responsible for grandchildrenAmerican Indian / Alaska Native 18 87.8% Responsible for grandchildren2 12.2% Not responsible for grandchildrenNative Hawaiian / Pacific Islander 19 55.2% Responsible for grandchildren16 44.8% Not responsible for grandchildrenWhite alone, not Hispanic / Latino 74 71.4% Responsible for grandchildren30 28.6% Not responsible for grandchildrenGrandparents (60 years and over) White / Caucasian 102 25.8% Responsible for grandchildren293 74.2% Not responsible for grandchildrenAmerican Indian / Alaska Native 127 79.2% Responsible for grandchildren33 20.8% Not responsible for grandchildrenWhite alone, not Hispanic / Latino 103 25.6% Responsible for grandchildren299 74.4% Not responsible for grandchildren