Races in Bill Arp, Georgia (GA) Detailed Stats
Ancestries, Foreign-born residents, place of birth
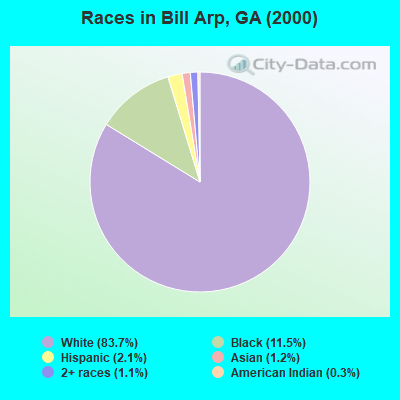
Race distribution in Bill Arp

- 25,30483.7%White alone
- 3,48311.5%Black alone
- 6282.1%Hispanic
- 3711.2%Asian alone
- 3411.1%Two or more races
- 820.3%American Indian alone
- 300.10%Other race alone
- 80.03%Native Hawaiian and Other
Pacific Islander alone
2000
2022
-
- 5,128,66162.6%White alone
- 2,331,46528.5%Black alone
- 435,2275.3%Hispanic
- 171,5132.1%Asian alone
- 87,3641.1%Two or more races
- 17,6700.2%American Indian alone
- 11,2750.1%Other race alone
- 3,2780.04%Native Hawaiian and Other
Pacific Islander alone

-
- 5,415,65749.6%White alone
- 3,349,24030.7%Black alone
- 1,132,60410.4%Hispanic
- 479,1564.4%Asian alone
- 462,9234.2%Two or more races
- 54,4160.5%Other race alone
- 11,9230.1%American Indian alone
- 6,9570.06%Native Hawaiian and Other
Pacific Islander alone

Income and house value in Bill Arp
- Median household income in 2022
- $87,024White non-Hispanic householders
- $106,517Black householders
- $74,715Asian householders
- $23,138Some other race householders
- $142,889Two or more races householders
- $78,769Hispanic or Latino race householders
- Median 2022 house value
- $310,841White Non-Hispanic householders
- $347,358Black or African American householders
- $283,824American Indian or Alaska Native householders
- $442,659Asian householders
- $278,183Some other race householders
- $251,463Two or more races householders
- $279,964Hispanic or Latino householders
Household income for White non-Hispanic householders

Household income for Black householders

Household income for American Indian and Alaska Native householders

Household income for Asian householders

Household income for Native Hawaiian and other Pacific Islander householders

Household income for Two or more races householders

Household income for Hispanic or Latino race householders

Zip code: 30135