Races in Beverly, Massachusetts (MA) Detailed Stats
Data:
Races - White alone (%)
Races - White alone (% change since 2000)
Races - Black alone (%)
Races - Black alone (% change since 2000)
Races - American Indian alone (%)
Races - American Indian alone (% change since 2000)
Races - Asian alone (%)
Races - Asian alone (% change since 2000)
Races - Hispanic (%)
Races - Hispanic (% change since 2000)
Races - Native Hawaiian and Other Pacific Islander alone (%)
Races - Native Hawaiian and Other Pacific Islander alone (% change since 2000)
Races - Two or more races(%)
Races - Two or more races(% change since 2000)
Races - Other race alone (%)
Races - Other race alone (% change since 2000)
Racial diversity
Place of birth - Born in state of residence (%)
Place of birth - Born in state of residence (%) - White
Place of birth - Born in state of residence (%) - Black or African American
Place of birth - Born in state of residence (%) - Asian
Place of birth - Born in state of residence (%) - Hispanic or Latino
Place of birth - Born in state of residence (%) - American Indian and Alaska Native
Place of birth - Born in state of residence (%) - Multirace
Place of birth - Born in state of residence (%) - Other Race
Place of birth - Born in other state (%)
Place of birth - Born in other state (%) - White
Place of birth - Born in other state (%) - Black or African American
Place of birth - Born in other state (%) - Asian
Place of birth - Born in other state (%) - Hispanic or Latino
Place of birth - Born in other state (%) - American Indian and Alaska Native
Place of birth - Born in other state (%) - Multirace
Place of birth - Born in other state (%) - Other Race
Place of birth - Native, outside of US (%)
Place of birth - Native, outside of US (%) - White
Place of birth - Native, outside of US (%) - Black or African American
Place of birth - Native, outside of US (%) - Asian
Place of birth - Native, outside of US (%) - Hispanic or Latino
Place of birth - Native, outside of US (%) - American Indian and Alaska Native
Place of birth - Native, outside of US (%) - Multirace
Place of birth - Native, outside of US (%) - Other Race
Place of birth - Foreign born (%)
Place of birth - Foreign born (%) - White
Place of birth - Foreign born (%) - Black or African American
Place of birth - Foreign born (%) - Asian
Place of birth - Foreign born (%) - Hispanic or Latino
Place of birth - Foreign born (%) - American Indian and Alaska Native
Place of birth - Foreign born (%) - Multirace
Place of birth - Foreign born (%) - Other Race
Residents speaking English at home (%)
Residents speaking English at home - Born in the United States (%)
Residents speaking English at home - Native, born elsewhere (%)
Residents speaking English at home - Foreign born (%)
Residents speaking Spanish at home (%)
Residents speaking Spanish at home - Born in the United States (%)
Residents speaking Spanish at home - Native, born elsewhere (%)
Residents speaking Spanish at home - Foreign born (%)
Residents speaking other language at home (%)
Residents speaking other language at home - Born in the United States (%)
Residents speaking other language at home - Native, born elsewhere (%)
Residents speaking other language at home - Foreign born (%)
Marital status - Never married (%)
Marital status - Now married (%)
Marital status - Separated (%)
Marital status - Widowed (%)
Marital status - Divorced (%)
Ancestries Reported - Arab (%)
Ancestries Reported - Czech (%)
Ancestries Reported - Danish (%)
Ancestries Reported - Dutch (%)
Ancestries Reported - English (%)
Ancestries Reported - French (%)
Ancestries Reported - French Canadian (%)
Ancestries Reported - German (%)
Ancestries Reported - Greek (%)
Ancestries Reported - Hungarian (%)
Ancestries Reported - Irish (%)
Ancestries Reported - Italian (%)
Ancestries Reported - Lithuanian (%)
Ancestries Reported - Norwegian (%)
Ancestries Reported - Polish (%)
Ancestries Reported - Portuguese (%)
Ancestries Reported - Russian (%)
Ancestries Reported - Scotch-Irish (%)
Ancestries Reported - Scottish (%)
Ancestries Reported - Slovak (%)
Ancestries Reported - Subsaharan African (%)
Ancestries Reported - Swedish (%)
Ancestries Reported - Swiss (%)
Ancestries Reported - Ukrainian (%)
Ancestries Reported - United States (%)
Ancestries Reported - Welsh (%)
Ancestries Reported - West Indian (%)
Ancestries Reported - Other (%)
Geographical mobility - Same house 1 year ago (%)
Geographical mobility - Same house 1 year ago (%) - White
Geographical mobility - Same house 1 year ago (%) - Black or African American
Geographical mobility - Same house 1 year ago (%) - Asian
Geographical mobility - Same house 1 year ago (%) - Hispanic or Latino
Geographical mobility - Same house 1 year ago (%) - American Indian and Alaska Native
Geographical mobility - Same house 1 year ago (%) - Multirace
Geographical mobility - Same house 1 year ago (%) - Other Race
Geographical mobility - Moved within same county (%)
Geographical mobility - Moved within same county (%) - White
Geographical mobility - Moved within same county (%) - Black or African American
Geographical mobility - Moved within same county (%) - Asian
Geographical mobility - Moved within same county (%) - Hispanic or Latino
Geographical mobility - Moved within same county (%) - American Indian and Alaska Native
Geographical mobility - Moved within same county (%) - Multirace
Geographical mobility - Moved within same county (%) - Other Race
Geographical mobility - Moved from different county within same state (%)
Geographical mobility - Moved from different county within same state (%) - White
Geographical mobility - Moved from different county within same state (%) - Black or African American
Geographical mobility - Moved from different county within same state (%) - Asian
Geographical mobility - Moved from different county within same state (%) - Hispanic or Latino
Geographical mobility - Moved from different county within same state (%) - American Indian and Alaska Native
Geographical mobility - Moved from different county within same state (%) - Multirace
Geographical mobility - Moved from different county within same state (%) - Other Race
Geographical mobility - Moved from different state (%)
Geographical mobility - Moved from different state (%) - White
Geographical mobility - Moved from different state (%) - Black or African American
Geographical mobility - Moved from different state (%) - Asian
Geographical mobility - Moved from different state (%) - Hispanic or Latino
Geographical mobility - Moved from different state (%) - American Indian and Alaska Native
Geographical mobility - Moved from different state (%) - Multirace
Geographical mobility - Moved from different state (%) - Other Race
Geographical mobility - Moved from abroad (%)
Geographical mobility - Moved from abroad (%) - White
Geographical mobility - Moved from abroad (%) - Black or African American
Geographical mobility - Moved from abroad (%) - Asian
Geographical mobility - Moved from abroad (%) - Hispanic or Latino
Geographical mobility - Moved from abroad (%) - American Indian and Alaska Native
Geographical mobility - Moved from abroad (%) - Multirace
Geographical mobility - Moved from abroad (%) - Other Race
Place of birth for the foreign-born population - Ireland (%)
Place of birth for the foreign-born population - Denmark (%)
Place of birth for the foreign-born population - Norway (%)
Place of birth for the foreign-born population - Sweden (%)
Place of birth for the foreign-born population - United Kingdom (%)
Place of birth for the foreign-born population - England (%)
Place of birth for the foreign-born population - Scotland (%)
Place of birth for the foreign-born population - Other Northern Europe (%)
Place of birth for the foreign-born population - Austria (%)
Place of birth for the foreign-born population - Belgium (%)
Place of birth for the foreign-born population - France (%)
Place of birth for the foreign-born population - Germany (%)
Place of birth for the foreign-born population - Netherlands (%)
Place of birth for the foreign-born population - Switzerland (%)
Place of birth for the foreign-born population - Other Western Europe (%)
Place of birth for the foreign-born population - Greece (%)
Place of birth for the foreign-born population - Italy (%)
Place of birth for the foreign-born population - Portugal (%)
Place of birth for the foreign-born population - Spain (%)
Place of birth for the foreign-born population - Other Southern Europe (%)
Place of birth for the foreign-born population - Albania (%)
Place of birth for the foreign-born population - Belarus (%)
Place of birth for the foreign-born population - Bosnia and Herzegovina (%)
Place of birth for the foreign-born population - Bulgaria (%)
Place of birth for the foreign-born population - Croatia (%)
Place of birth for the foreign-born population - Czechoslovakia (%)
Place of birth for the foreign-born population - Hungary (%)
Place of birth for the foreign-born population - Latvia (%)
Place of birth for the foreign-born population - Lithuania (%)
Place of birth for the foreign-born population - North Macedonia (Macedonia) (%)
Place of birth for the foreign-born population - Moldova (%)
Place of birth for the foreign-born population - Poland (%)
Place of birth for the foreign-born population - Romania (%)
Place of birth for the foreign-born population - Russia (%)
Place of birth for the foreign-born population - Serbia (%)
Place of birth for the foreign-born population - Ukraine (%)
Place of birth for the foreign-born population - Other Eastern Europe (%)
Place of birth for the foreign-born population - China (%)
Place of birth for the foreign-born population - Hong Kong (%)
Place of birth for the foreign-born population - Taiwan (%)
Place of birth for the foreign-born population - Japan (%)
Place of birth for the foreign-born population - Korea (%)
Place of birth for the foreign-born population - Other Eastern Asia (%)
Place of birth for the foreign-born population - Afghanistan (%)
Place of birth for the foreign-born population - Bangladesh (%)
Place of birth for the foreign-born population - India (%)
Place of birth for the foreign-born population - Iran (%)
Place of birth for the foreign-born population - Kazakhstan (%)
Place of birth for the foreign-born population - Nepal (%)
Place of birth for the foreign-born population - Pakistan (%)
Place of birth for the foreign-born population - Sri Lanka (%)
Place of birth for the foreign-born population - Uzbekistan (%)
Place of birth for the foreign-born population - Other South Central Asia (%)
Place of birth for the foreign-born population - Burma (%)
Place of birth for the foreign-born population - Cambodia (%)
Place of birth for the foreign-born population - Indonesia (%)
Place of birth for the foreign-born population - Laos (%)
Place of birth for the foreign-born population - Malaysia (%)
Place of birth for the foreign-born population - Philippines (%)
Place of birth for the foreign-born population - Singapore (%)
Place of birth for the foreign-born population - Thailand (%)
Place of birth for the foreign-born population - Vietnam (%)
Place of birth for the foreign-born population - Other South Eastern Asia (%)
Place of birth for the foreign-born population - Armenia (%)
Place of birth for the foreign-born population - Iraq (%)
Place of birth for the foreign-born population - Israel (%)
Place of birth for the foreign-born population - Jordan (%)
Place of birth for the foreign-born population - Kuwait (%)
Place of birth for the foreign-born population - Lebanon (%)
Place of birth for the foreign-born population - Saudi Arabia (%)
Place of birth for the foreign-born population - Syria (%)
Place of birth for the foreign-born population - Turkey (%)
Place of birth for the foreign-born population - Yemen (%)
Place of birth for the foreign-born population - Other Western Asia (%)
Place of birth for the foreign-born population - Eritrea (%)
Place of birth for the foreign-born population - Ethiopia (%)
Place of birth for the foreign-born population - Kenya (%)
Place of birth for the foreign-born population - Somalia (%)
Place of birth for the foreign-born population - Uganda (%)
Place of birth for the foreign-born population - Zimbabwe (%)
Place of birth for the foreign-born population - Other Eastern Africa (%)
Place of birth for the foreign-born population - Cameroon (%)
Place of birth for the foreign-born population - Congo (%)
Place of birth for the foreign-born population - Democratic Republic of Congo (Zaire) (%)
Place of birth for the foreign-born population - Other Middle Africa (%)
Place of birth for the foreign-born population - Egypt (%)
Place of birth for the foreign-born population - Morocco (%)
Place of birth for the foreign-born population - Sudan (%)
Place of birth for the foreign-born population - Other Northern Africa (%)
Place of birth for the foreign-born population - South Africa (%)
Place of birth for the foreign-born population - Other Southern Africa (%)
Place of birth for the foreign-born population - Cabo Verde (%)
Place of birth for the foreign-born population - Ghana (%)
Place of birth for the foreign-born population - Liberia (%)
Place of birth for the foreign-born population - Nigeria (%)
Place of birth for the foreign-born population - Senegal (%)
Place of birth for the foreign-born population - Sierra Leone (%)
Place of birth for the foreign-born population - Other Western Africa (%)
Place of birth for the foreign-born population - Australia (%)
Place of birth for the foreign-born population - New Zealand (%)
Place of birth for the foreign-born population - Fiji (%)
Place of birth for the foreign-born population - Micronesia (%)
Place of birth for the foreign-born population - Bahamas (%)
Place of birth for the foreign-born population - Barbados (%)
Place of birth for the foreign-born population - Cuba (%)
Place of birth for the foreign-born population - Dominica (%)
Place of birth for the foreign-born population - Dominican Republic (%)
Place of birth for the foreign-born population - Grenada (%)
Place of birth for the foreign-born population - Haiti (%)
Place of birth for the foreign-born population - Jamaica (%)
Place of birth for the foreign-born population - St. Vincent and the Grenadines (%)
Place of birth for the foreign-born population - Trinidad and Tobago (%)
Place of birth for the foreign-born population - West Indies (%)
Place of birth for the foreign-born population - Other Caribbean (%)
Place of birth for the foreign-born population - Belize (%)
Place of birth for the foreign-born population - Costa Rica (%)
Place of birth for the foreign-born population - El Salvador (%)
Place of birth for the foreign-born population - Guatemala (%)
Place of birth for the foreign-born population - Honduras (%)
Place of birth for the foreign-born population - Mexico (%)
Place of birth for the foreign-born population - Nicaragua (%)
Place of birth for the foreign-born population - Panama (%)
Place of birth for the foreign-born population - Other Central America (%)
Place of birth for the foreign-born population - Argentina (%)
Place of birth for the foreign-born population - Bolivia (%)
Place of birth for the foreign-born population - Brazil (%)
Place of birth for the foreign-born population - Chile (%)
Place of birth for the foreign-born population - Colombia (%)
Place of birth for the foreign-born population - Ecuador (%)
Place of birth for the foreign-born population - Guyana (%)
Place of birth for the foreign-born population - Peru (%)
Place of birth for the foreign-born population - Uruguay (%)
Place of birth for the foreign-born population - Venezuela (%)
Place of birth for the foreign-born population - Other South America (%)
Place of birth for the foreign-born population - Canada (%)
Place of birth for the foreign-born population - Other Northern America (%)
Place of birth for the foreign-born population - Other (%)
Latest news about races in Beverly, MA collected exclusively by city-data.com from local newspapers, TV, and radio stations
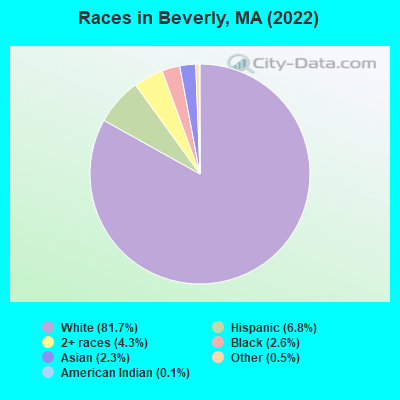
According to 2022 data, the most numerous races in Beverly, MA are White alone (34,663 residents), Hispanic (2,882 residents), and Asian alone (975 residents). 86.3% of Beverly residents speak English at home. 10.1% of Beverly, MA residents are foreign-born (3.6% born in Latin America, 2.7% born in Europe, 1.7% born in Asia, 1.1% born in Africa), which is 78.1% less than the foreign-born rate of 18.0% across the entire state of Massachusetts.
Race distribution in Beverly
2000 2022
5,198,359 81.9% White alone 428,729 6.8% Hispanic 318,329 5.0% Black alone 236,786 3.7% Asian alone 110,338 1.7% Two or more races 43,586 0.7% Other race alone 11,264 0.2% American Indian alone 1,706 0.03% Native Hawaiian and Other
4,676,627 67.0% White alone 911,038 13.0% Hispanic 501,463 7.2% Asian alone 459,740 6.6% Black alone 341,889 4.9% Two or more races 84,403 1.2% Other race alone 5,838 0.08% American Indian alone 976 0.01% Native Hawaiian and Other
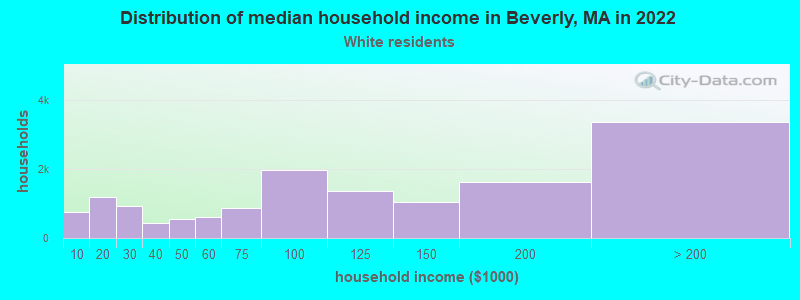
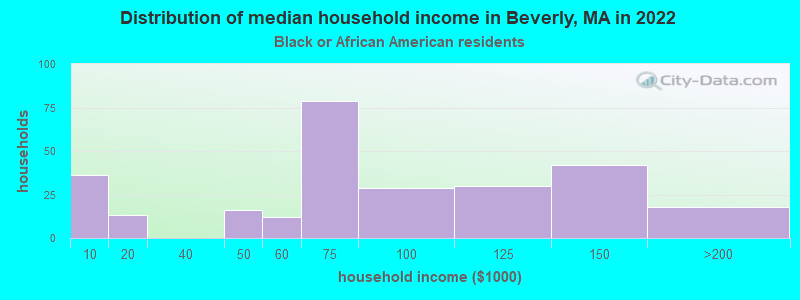
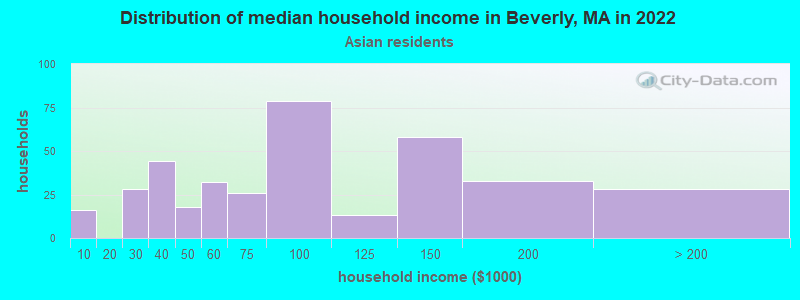
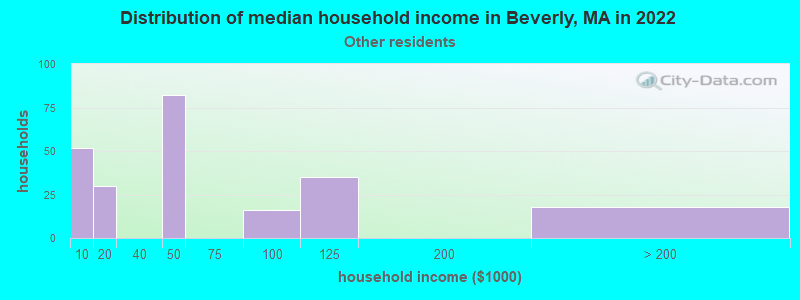
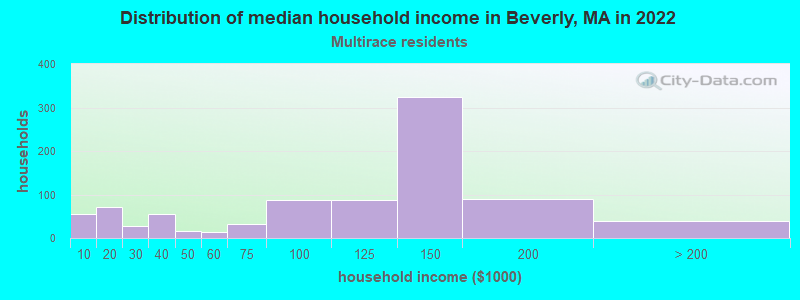
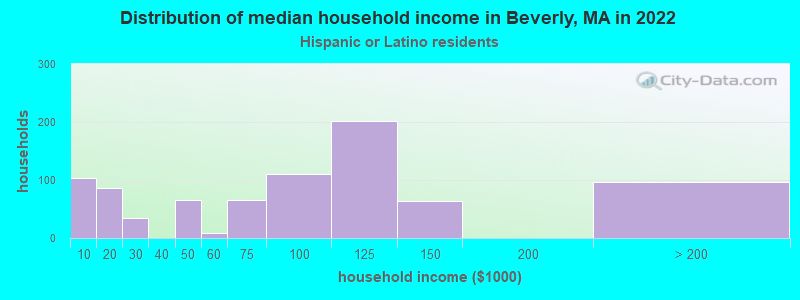
Income and house value in Beverly Median household income in 2022 $100,291 White non-Hispanic householders$73,321 Black householders$74,529 Asian householders$120,112 Two or more races householders$89,741 Hispanic or Latino race householdersMedian 2022 house value $631,441 White Non-Hispanic householders$561,281 Black or African American householders $649,121 Asian householders$456,040 Native Hawaiian and other Pacific Islander householdersover $1,000,000 Two or more races householders$605,061 Hispanic or Latino householders
Median age by race in Beverly
44.4 Median age for White residents44.1 44.5 24.2 Median age for Black or African American residents38.6 20.3 44.3 Median age for American Indian / Alaska Native residents-679,156,908.0 -364,551,862.7 28.3 Median age for Asian residents25.8 34.0 -514,227,641.8 Median age for Native Hawaiian / Pacific Islander residents-666,666,666.0 -508,717,948.2 22.6 Median age for Other race residents17.3 39.9 23.1 Median age for Two or more races residents14.9 29.3 44.5 Median age for White alone residents44.0 45.5 23.9 Median age for Hispanic or Latino residents22.6 28.5
Owner/renter occupied households by race in Beverly
House owners and renters - White residents 9,580 65.4% Owner occupied5,063 34.6% Renter occupiedHouse owners and renters - Black or African American residents 32 11.9% Owner occupied234 88.1% Renter occupiedHouse owners and renters - American Indian / Alaska Native residents 37 100.0% Owner occupiedHouse owners and renters - Asian residents 201 51.1% Owner occupied193 48.9% Renter occupiedHouse owners and renters - Other race residents 27 13.1% Owner occupied182 86.9% Renter occupiedHouse owners and renters - Two or more races residents 288 34.6% Owner occupied544 65.4% Renter occupiedHouse owners and renters - White alone residents 9,575 64.6% Owner occupied5,250 35.4% Renter occupiedHouse owners and renters - Hispanic or Latino residents 340 39.8% Owner occupied515 60.2% Renter occupied
Language usage in Beverly
English speakers - Total 86.3% of residents of Beverly speak English at home.
3.9% of residents speak Spanish at home 1,059 67.4% Speak English very well513 32.6% Speak English less than very well8.7% of residents speak other language at home 2,105 60.5% Speak English very well1,376 39.5% Speak English less than very well
English speakers - Born in the United States 96.7% of residents of Beverly speak English at home.
1.9% of residents speak Spanish at home 119 65.4% Speak English very well63 34.6% Speak English less than very well1.8% of residents speak other language at home 173 100.0% Speak English very well
English speakers - Native, born elsewhere 80.7% of residents of Beverly speak English at home.
17.8% of residents speak Spanish at home 39 54.2% Speak English very well33 45.8% Speak English less than very well11.9% of residents speak other language at home 46 95.8% Speak English very well2 4.2% Speak English less than very well
English speakers - Foreign-born 28.0% of residents of Beverly speak English at home.
19.2% of residents speak Spanish at home 442 52.1% Speak English very well407 47.9% Speak English less than very well50.0% of residents speak other language at home 971 43.9% Speak English very well1,243 56.1% Speak English less than very well
White (Caucasian) - Speak only English Native:
97.7% (30,741)Foreign-born:
42.8% (723)
White (Caucasian) - Speak another language Native:
2.8% (890)Foreign-born:
59.0% (997)
Black or African American - Speak only English Native:
62.2% (391)Foreign-born:
21.2% (85)
Black or African American - Speak another language Native:
33.8% (212)Foreign-born:
76.9% (310)
American Indian / Alaska Native - Speak another language Native:
58.4% (36)Foreign-born:
100.0% (78)
Asian - Speak only English Native:
86.2% (512)Foreign-born:
20.9% (122)
Asian - Speak another language Native:
20.7% (123)Foreign-born:
77.4% (451)
Other race - Speak only English Native:
89.1% (248)Foreign-born:
14.9% (42)
Other race - Speak another language Native:
25.3% (70)Foreign-born:
85.6% (244)
Two or more races - Speak only English Native:
77.9% (1,212)Foreign-born:
13.0% (102)
Two or more races - Speak another language Native:
18.7% (291)Foreign-born:
88.3% (692)
White alone - Speak only English Native:
96.9% (30,548)Foreign-born:
43.1% (765)
White alone - Speak another language Native:
3.1% (973)Foreign-born:
56.4% (1,001)
Hispanic or Latino - Speak only English Native:
67.3% (992)Foreign-born:
14.3% (145)
Hispanic or Latino - Speak another language Native:
34.8% (514)Foreign-born:
86.3% (873)
Foreign-born residents in Beverly 4,289 residents are foreign born (3.6% Latin America , 2.7% Europe , 1.7% Asia , 1.1% Africa ).
This city:
10.1%Massachusetts:
17.6%
Marital status for residents in Beverly Marital status - White (Caucasian) population 15 years and over
Males 34.6% Never married53.1% Now married1.3% Separated2.1% Widowed8.9% DivorcedFemales 35.2% Never married44.6% Now married1.2% Separated7.1% Widowed12.0% DivorcedWomen who gave birth in the past 12 months Now married:
78.2% (286)Unmarried:
21.8% (80)
Women who did not give birth in the past 12 months Now married:
34.1% (2,578)Unmarried:
65.9% (4,986)
Marital status - Black or African American population 15 years and over
Males 45.5% Never married25.1% Now married14.2% Separated0.0% Widowed15.2% DivorcedFemales 54.6% Never married28.2% Now married0.0% Separated0.0% Widowed17.2% DivorcedWomen who gave birth in the past 12 months Now married:
0.0% (0)Unmarried:
100.0% (19)
Women who did not give birth in the past 12 months Now married:
31.4% (98)Unmarried:
68.6% (214)
Marital status - American Indian / Alaska Native population 15 years and over
Males 0.0% Never married100.0% Now married0.0% Separated0.0% Widowed0.0% DivorcedFemales 100.0% Never married0.0% Now married0.0% Separated0.0% Widowed0.0% DivorcedWomen who did not give birth in the past 12 months Now married:
0.0% (0)Unmarried:
100.0% (38)
Marital status - Asian population 15 years and over
Males 55.1% Never married40.8% Now married0.0% Separated0.0% Widowed4.0% DivorcedFemales 25.1% Never married66.0% Now married0.0% Separated0.0% Widowed8.8% DivorcedWomen who did not give birth in the past 12 months Now married:
64.9% (228)Unmarried:
35.1% (123)
Marital status - Other race population 15 years and over
Males 66.3% Never married13.2% Now married0.0% Separated0.0% Widowed20.5% DivorcedFemales 55.3% Never married12.1% Now married22.1% Separated0.0% Widowed10.6% DivorcedWomen who gave birth in the past 12 months Now married:
0.0% (0)Unmarried:
100.0% (14)
Women who did not give birth in the past 12 months Now married:
36.9% (74)Unmarried:
63.1% (126)
Marital status - Two or more races population 15 years and over
Males 39.7% Never married42.0% Now married0.0% Separated0.8% Widowed17.5% DivorcedFemales 49.6% Never married40.0% Now married1.9% Separated1.0% Widowed7.5% DivorcedWomen who gave birth in the past 12 months Now married:
68.6% (32)Unmarried:
31.4% (15)
Women who did not give birth in the past 12 months Now married:
24.3% (196)Unmarried:
75.7% (612)
Marital status - White alone, not Hispanic / Latino population 15 years and over
Males 34.2% Never married53.2% Now married1.3% Separated2.2% Widowed9.1% DivorcedFemales 34.7% Never married44.8% Now married1.2% Separated7.2% Widowed12.1% DivorcedWomen who gave birth in the past 12 months Now married:
78.2% (302)Unmarried:
21.8% (84)
Women who did not give birth in the past 12 months Now married:
34.1% (2,598)Unmarried:
65.9% (5,016)
Marital status - Hispanic or Latino population 15 years and over
Males 46.6% Never married44.3% Now married0.0% Separated0.5% Widowed8.7% DivorcedFemales 43.8% Never married44.9% Now married4.6% Separated0.7% Widowed6.0% DivorcedWomen who gave birth in the past 12 months Now married:
0.0% (0)Unmarried:
100.0% (23)
Women who did not give birth in the past 12 months Now married:
42.6% (313)Unmarried:
57.4% (421)
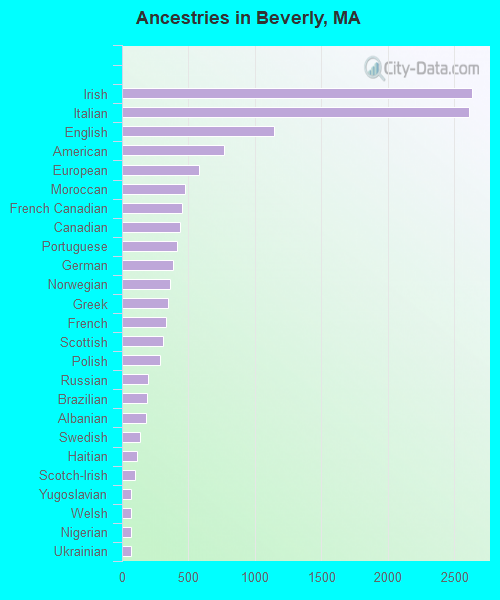
Ancestries in Beverly
2,628 16.0% Irish2,607 15.8% Italian1,146 7.0% English769 4.7% American580 3.5% European475 2.9% Moroccan451 2.7% French Canadian433 2.6% Canadian410 2.5% Portuguese385 2.3% German358 2.2% Norwegian346 2.1% Greek329 2.0% French308 1.9% Scottish282 1.7% Polish192 1.2% Russian185 1.1% Brazilian180 1.1% Albanian137 0.8% Swedish112 0.7% Haitian94 0.6% Scotch-Irish71 0.4% Yugoslavian69 0.4% Welsh67 0.4% Nigerian64 0.4% Ukrainian60 0.4% Eastern European57 0.3% British48 0.3% Hungarian46 0.3% Ugandan36 0.2% Northern European36 0.2% Dutch33 0.2% Slovak30 0.2% African28 0.2% Swiss25 0.2% Lithuanian23 0.1% Finnish21 0.1% Turkish17 0.1% Armenian13 0.08% Jordanian13 0.08% Austrian9 0.05% Jamaican9 0.05% Trinidadian and Tobagonian8 0.05% Czech6 0.04% Cape Verdean4 0.02% Syrian4 0.02% Egyptian4 0.02% Latvian4 0.02% Slavic3 0.02% Belgian
Geographical mobility in Beverly Same house 1 year ago 30,020 88.2% White (Caucasian)1,001 83.3% Black or African American89 68.6% American Indian / Alaska Native979 83.1% Asian672 95.3% Other race2,455 84.2% Two or more races30,173 88.0% White alone, not Hispanic / Latino2,633 91.4% Hispanic or LatinoMoved within same county 1,969 5.8% White / Caucasian95 7.9% Black or African American57 4.8% Asian13 1.8% Other race279 9.6% Two or more races2,001 5.8% White alone, not Hispanic / Latino110 3.8% Hispanic or LatinoMoved within same state 1,036 3.0% White / Caucasian18 1.5% Black or African American13 1.1% Asian9 1.2% Other race53 1.8% Two or more races1,077 3.1% White alone, not Hispanic / Latino25 0.9% Hispanic or LatinoMoved from different state 896 2.6% White / Caucasian56 4.6% Black or African American28 21.8% American Indian / Alaska Native30 2.5% Asian13 1.9% Other race173 5.9% Two or more races902 2.6% White alone, not Hispanic / Latino109 3.8% Hispanic or LatinoMoved from abroad 38 0.1% White9 0.8% Black or African American14 1.2% Asian4 70.6% Native Hawaiian / Pacific Islander51 0.1% White alone, not Hispanic / Latino26 0.9% Hispanic or Latino
Children Nativity (place of birth) in Beverly
Children under 6 years - Living with two parents Both parents native 1,478 100.0% NativeBoth parents foreign-born 173 93.1% Native13 6.9% Foreign-bornOne native, one foreign-born parent 163 100.0% NativeChildren under 6 years - Living with one parent Native parent 482 100.0% NativeForeign-born parent 233 100.0% NativeChildren 6 to 17 years - Living with two parents Both parents native 2,297 100.0% NativeBoth parents foreign-born 360 82.4% Native77 17.6% Foreign-bornOne native, one foreign-born parent 372 88.0% Native51 12.0% Foreign-bornChildren 6 to 17 years - Living with one parent Native parent 1,073 100.0% NativeForeign-born parent 769 53.3% Native673 46.7% Foreign-born
Grandparents responsible for own grandchildren in Beverly
Grandparents (30 to 59 years) White / Caucasian 80 67.5% Responsible for grandchildren39 32.5% Not responsible for grandchildrenBlack or African American 25 100.0% Not responsible for grandchildrenWhite alone, not Hispanic / Latino 56 54.6% Responsible for grandchildren47 45.4% Not responsible for grandchildren
Grandparents (60 years and over) White / Caucasian 391 100.0% Not responsible for grandchildrenBlack or African American 15 100.0% Not responsible for grandchildrenWhite alone, not Hispanic / Latino 407 100.0% Not responsible for grandchildren