Races in Bethesda, Maryland (MD) Detailed Stats
Data:
Races - White alone (%)
Races - White alone (% change since 2000)
Races - Black alone (%)
Races - Black alone (% change since 2000)
Races - American Indian alone (%)
Races - American Indian alone (% change since 2000)
Races - Asian alone (%)
Races - Asian alone (% change since 2000)
Races - Hispanic (%)
Races - Hispanic (% change since 2000)
Races - Native Hawaiian and Other Pacific Islander alone (%)
Races - Native Hawaiian and Other Pacific Islander alone (% change since 2000)
Races - Two or more races(%)
Races - Two or more races(% change since 2000)
Races - Other race alone (%)
Races - Other race alone (% change since 2000)
Racial diversity
Place of birth - Born in state of residence (%)
Place of birth - Born in state of residence (%) - White
Place of birth - Born in state of residence (%) - Black or African American
Place of birth - Born in state of residence (%) - Asian
Place of birth - Born in state of residence (%) - Hispanic or Latino
Place of birth - Born in state of residence (%) - American Indian and Alaska Native
Place of birth - Born in state of residence (%) - Multirace
Place of birth - Born in state of residence (%) - Other Race
Place of birth - Born in other state (%)
Place of birth - Born in other state (%) - White
Place of birth - Born in other state (%) - Black or African American
Place of birth - Born in other state (%) - Asian
Place of birth - Born in other state (%) - Hispanic or Latino
Place of birth - Born in other state (%) - American Indian and Alaska Native
Place of birth - Born in other state (%) - Multirace
Place of birth - Born in other state (%) - Other Race
Place of birth - Native, outside of US (%)
Place of birth - Native, outside of US (%) - White
Place of birth - Native, outside of US (%) - Black or African American
Place of birth - Native, outside of US (%) - Asian
Place of birth - Native, outside of US (%) - Hispanic or Latino
Place of birth - Native, outside of US (%) - American Indian and Alaska Native
Place of birth - Native, outside of US (%) - Multirace
Place of birth - Native, outside of US (%) - Other Race
Place of birth - Foreign born (%)
Place of birth - Foreign born (%) - White
Place of birth - Foreign born (%) - Black or African American
Place of birth - Foreign born (%) - Asian
Place of birth - Foreign born (%) - Hispanic or Latino
Place of birth - Foreign born (%) - American Indian and Alaska Native
Place of birth - Foreign born (%) - Multirace
Place of birth - Foreign born (%) - Other Race
Residents speaking English at home (%)
Residents speaking English at home - Born in the United States (%)
Residents speaking English at home - Native, born elsewhere (%)
Residents speaking English at home - Foreign born (%)
Residents speaking Spanish at home (%)
Residents speaking Spanish at home - Born in the United States (%)
Residents speaking Spanish at home - Native, born elsewhere (%)
Residents speaking Spanish at home - Foreign born (%)
Residents speaking other language at home (%)
Residents speaking other language at home - Born in the United States (%)
Residents speaking other language at home - Native, born elsewhere (%)
Residents speaking other language at home - Foreign born (%)
Marital status - Never married (%)
Marital status - Now married (%)
Marital status - Separated (%)
Marital status - Widowed (%)
Marital status - Divorced (%)
Ancestries Reported - Arab (%)
Ancestries Reported - Czech (%)
Ancestries Reported - Danish (%)
Ancestries Reported - Dutch (%)
Ancestries Reported - English (%)
Ancestries Reported - French (%)
Ancestries Reported - French Canadian (%)
Ancestries Reported - German (%)
Ancestries Reported - Greek (%)
Ancestries Reported - Hungarian (%)
Ancestries Reported - Irish (%)
Ancestries Reported - Italian (%)
Ancestries Reported - Lithuanian (%)
Ancestries Reported - Norwegian (%)
Ancestries Reported - Polish (%)
Ancestries Reported - Portuguese (%)
Ancestries Reported - Russian (%)
Ancestries Reported - Scotch-Irish (%)
Ancestries Reported - Scottish (%)
Ancestries Reported - Slovak (%)
Ancestries Reported - Subsaharan African (%)
Ancestries Reported - Swedish (%)
Ancestries Reported - Swiss (%)
Ancestries Reported - Ukrainian (%)
Ancestries Reported - United States (%)
Ancestries Reported - Welsh (%)
Ancestries Reported - West Indian (%)
Ancestries Reported - Other (%)
Geographical mobility - Same house 1 year ago (%)
Geographical mobility - Same house 1 year ago (%) - White
Geographical mobility - Same house 1 year ago (%) - Black or African American
Geographical mobility - Same house 1 year ago (%) - Asian
Geographical mobility - Same house 1 year ago (%) - Hispanic or Latino
Geographical mobility - Same house 1 year ago (%) - American Indian and Alaska Native
Geographical mobility - Same house 1 year ago (%) - Multirace
Geographical mobility - Same house 1 year ago (%) - Other Race
Geographical mobility - Moved within same county (%)
Geographical mobility - Moved within same county (%) - White
Geographical mobility - Moved within same county (%) - Black or African American
Geographical mobility - Moved within same county (%) - Asian
Geographical mobility - Moved within same county (%) - Hispanic or Latino
Geographical mobility - Moved within same county (%) - American Indian and Alaska Native
Geographical mobility - Moved within same county (%) - Multirace
Geographical mobility - Moved within same county (%) - Other Race
Geographical mobility - Moved from different county within same state (%)
Geographical mobility - Moved from different county within same state (%) - White
Geographical mobility - Moved from different county within same state (%) - Black or African American
Geographical mobility - Moved from different county within same state (%) - Asian
Geographical mobility - Moved from different county within same state (%) - Hispanic or Latino
Geographical mobility - Moved from different county within same state (%) - American Indian and Alaska Native
Geographical mobility - Moved from different county within same state (%) - Multirace
Geographical mobility - Moved from different county within same state (%) - Other Race
Geographical mobility - Moved from different state (%)
Geographical mobility - Moved from different state (%) - White
Geographical mobility - Moved from different state (%) - Black or African American
Geographical mobility - Moved from different state (%) - Asian
Geographical mobility - Moved from different state (%) - Hispanic or Latino
Geographical mobility - Moved from different state (%) - American Indian and Alaska Native
Geographical mobility - Moved from different state (%) - Multirace
Geographical mobility - Moved from different state (%) - Other Race
Geographical mobility - Moved from abroad (%)
Geographical mobility - Moved from abroad (%) - White
Geographical mobility - Moved from abroad (%) - Black or African American
Geographical mobility - Moved from abroad (%) - Asian
Geographical mobility - Moved from abroad (%) - Hispanic or Latino
Geographical mobility - Moved from abroad (%) - American Indian and Alaska Native
Geographical mobility - Moved from abroad (%) - Multirace
Geographical mobility - Moved from abroad (%) - Other Race
Place of birth for the foreign-born population - Ireland (%)
Place of birth for the foreign-born population - Denmark (%)
Place of birth for the foreign-born population - Norway (%)
Place of birth for the foreign-born population - Sweden (%)
Place of birth for the foreign-born population - United Kingdom (%)
Place of birth for the foreign-born population - England (%)
Place of birth for the foreign-born population - Scotland (%)
Place of birth for the foreign-born population - Other Northern Europe (%)
Place of birth for the foreign-born population - Austria (%)
Place of birth for the foreign-born population - Belgium (%)
Place of birth for the foreign-born population - France (%)
Place of birth for the foreign-born population - Germany (%)
Place of birth for the foreign-born population - Netherlands (%)
Place of birth for the foreign-born population - Switzerland (%)
Place of birth for the foreign-born population - Other Western Europe (%)
Place of birth for the foreign-born population - Greece (%)
Place of birth for the foreign-born population - Italy (%)
Place of birth for the foreign-born population - Portugal (%)
Place of birth for the foreign-born population - Spain (%)
Place of birth for the foreign-born population - Other Southern Europe (%)
Place of birth for the foreign-born population - Albania (%)
Place of birth for the foreign-born population - Belarus (%)
Place of birth for the foreign-born population - Bosnia and Herzegovina (%)
Place of birth for the foreign-born population - Bulgaria (%)
Place of birth for the foreign-born population - Croatia (%)
Place of birth for the foreign-born population - Czechoslovakia (%)
Place of birth for the foreign-born population - Hungary (%)
Place of birth for the foreign-born population - Latvia (%)
Place of birth for the foreign-born population - Lithuania (%)
Place of birth for the foreign-born population - North Macedonia (Macedonia) (%)
Place of birth for the foreign-born population - Moldova (%)
Place of birth for the foreign-born population - Poland (%)
Place of birth for the foreign-born population - Romania (%)
Place of birth for the foreign-born population - Russia (%)
Place of birth for the foreign-born population - Serbia (%)
Place of birth for the foreign-born population - Ukraine (%)
Place of birth for the foreign-born population - Other Eastern Europe (%)
Place of birth for the foreign-born population - China (%)
Place of birth for the foreign-born population - Hong Kong (%)
Place of birth for the foreign-born population - Taiwan (%)
Place of birth for the foreign-born population - Japan (%)
Place of birth for the foreign-born population - Korea (%)
Place of birth for the foreign-born population - Other Eastern Asia (%)
Place of birth for the foreign-born population - Afghanistan (%)
Place of birth for the foreign-born population - Bangladesh (%)
Place of birth for the foreign-born population - India (%)
Place of birth for the foreign-born population - Iran (%)
Place of birth for the foreign-born population - Kazakhstan (%)
Place of birth for the foreign-born population - Nepal (%)
Place of birth for the foreign-born population - Pakistan (%)
Place of birth for the foreign-born population - Sri Lanka (%)
Place of birth for the foreign-born population - Uzbekistan (%)
Place of birth for the foreign-born population - Other South Central Asia (%)
Place of birth for the foreign-born population - Burma (%)
Place of birth for the foreign-born population - Cambodia (%)
Place of birth for the foreign-born population - Indonesia (%)
Place of birth for the foreign-born population - Laos (%)
Place of birth for the foreign-born population - Malaysia (%)
Place of birth for the foreign-born population - Philippines (%)
Place of birth for the foreign-born population - Singapore (%)
Place of birth for the foreign-born population - Thailand (%)
Place of birth for the foreign-born population - Vietnam (%)
Place of birth for the foreign-born population - Other South Eastern Asia (%)
Place of birth for the foreign-born population - Armenia (%)
Place of birth for the foreign-born population - Iraq (%)
Place of birth for the foreign-born population - Israel (%)
Place of birth for the foreign-born population - Jordan (%)
Place of birth for the foreign-born population - Kuwait (%)
Place of birth for the foreign-born population - Lebanon (%)
Place of birth for the foreign-born population - Saudi Arabia (%)
Place of birth for the foreign-born population - Syria (%)
Place of birth for the foreign-born population - Turkey (%)
Place of birth for the foreign-born population - Yemen (%)
Place of birth for the foreign-born population - Other Western Asia (%)
Place of birth for the foreign-born population - Eritrea (%)
Place of birth for the foreign-born population - Ethiopia (%)
Place of birth for the foreign-born population - Kenya (%)
Place of birth for the foreign-born population - Somalia (%)
Place of birth for the foreign-born population - Uganda (%)
Place of birth for the foreign-born population - Zimbabwe (%)
Place of birth for the foreign-born population - Other Eastern Africa (%)
Place of birth for the foreign-born population - Cameroon (%)
Place of birth for the foreign-born population - Congo (%)
Place of birth for the foreign-born population - Democratic Republic of Congo (Zaire) (%)
Place of birth for the foreign-born population - Other Middle Africa (%)
Place of birth for the foreign-born population - Egypt (%)
Place of birth for the foreign-born population - Morocco (%)
Place of birth for the foreign-born population - Sudan (%)
Place of birth for the foreign-born population - Other Northern Africa (%)
Place of birth for the foreign-born population - South Africa (%)
Place of birth for the foreign-born population - Other Southern Africa (%)
Place of birth for the foreign-born population - Cabo Verde (%)
Place of birth for the foreign-born population - Ghana (%)
Place of birth for the foreign-born population - Liberia (%)
Place of birth for the foreign-born population - Nigeria (%)
Place of birth for the foreign-born population - Senegal (%)
Place of birth for the foreign-born population - Sierra Leone (%)
Place of birth for the foreign-born population - Other Western Africa (%)
Place of birth for the foreign-born population - Australia (%)
Place of birth for the foreign-born population - New Zealand (%)
Place of birth for the foreign-born population - Fiji (%)
Place of birth for the foreign-born population - Micronesia (%)
Place of birth for the foreign-born population - Bahamas (%)
Place of birth for the foreign-born population - Barbados (%)
Place of birth for the foreign-born population - Cuba (%)
Place of birth for the foreign-born population - Dominica (%)
Place of birth for the foreign-born population - Dominican Republic (%)
Place of birth for the foreign-born population - Grenada (%)
Place of birth for the foreign-born population - Haiti (%)
Place of birth for the foreign-born population - Jamaica (%)
Place of birth for the foreign-born population - St. Vincent and the Grenadines (%)
Place of birth for the foreign-born population - Trinidad and Tobago (%)
Place of birth for the foreign-born population - West Indies (%)
Place of birth for the foreign-born population - Other Caribbean (%)
Place of birth for the foreign-born population - Belize (%)
Place of birth for the foreign-born population - Costa Rica (%)
Place of birth for the foreign-born population - El Salvador (%)
Place of birth for the foreign-born population - Guatemala (%)
Place of birth for the foreign-born population - Honduras (%)
Place of birth for the foreign-born population - Mexico (%)
Place of birth for the foreign-born population - Nicaragua (%)
Place of birth for the foreign-born population - Panama (%)
Place of birth for the foreign-born population - Other Central America (%)
Place of birth for the foreign-born population - Argentina (%)
Place of birth for the foreign-born population - Bolivia (%)
Place of birth for the foreign-born population - Brazil (%)
Place of birth for the foreign-born population - Chile (%)
Place of birth for the foreign-born population - Colombia (%)
Place of birth for the foreign-born population - Ecuador (%)
Place of birth for the foreign-born population - Guyana (%)
Place of birth for the foreign-born population - Peru (%)
Place of birth for the foreign-born population - Uruguay (%)
Place of birth for the foreign-born population - Venezuela (%)
Place of birth for the foreign-born population - Other South America (%)
Place of birth for the foreign-born population - Canada (%)
Place of birth for the foreign-born population - Other Northern America (%)
Place of birth for the foreign-born population - Other (%)
Latest news about races in Bethesda, MD collected exclusively by city-data.com from local newspapers, TV, and radio stations
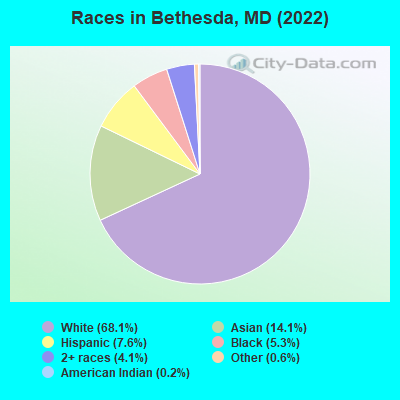
According to 2022 data, the most numerous races in Bethesda, MD are White alone (46,642 residents), Black alone (3,664 residents), and Hispanic (5,204 residents). 66.1% of Bethesda residents speak English at home. 25.3% of Bethesda, MD residents are foreign-born (9.9% born in Asia, 6.5% born in Europe, 4.7% born in Latin America), which is 36.8% greater than the foreign-born rate of 16.0% across the entire state of Maryland.
Race distribution in Bethesda
2000 2022
45,210 81.8% White alone 4,357 7.9% Asian alone 3,000 5.4% Hispanic 1,432 2.6% Black alone 1,012 1.8% Two or more races 178 0.3% Other race alone 64 0.1% American Indian alone 24 0.04% Native Hawaiian and Other
46,642 68.1% White alone 9,632 14.1% Asian alone 5,204 7.6% Hispanic 3,664 5.3% Black alone 2,798 4.1% Two or more races 436 0.6% Other race alone 146 0.2% American Indian alone
2000 2022
3,286,547 62.1% White alone 1,464,735 27.7% Black alone 227,916 4.3% Hispanic 209,738 4.0% Asian alone 82,946 1.6% Two or more races 13,312 0.3% American Indian alone 9,379 0.2% Other race alone 1,913 0.04% Native Hawaiian and Other
2,906,492 47.1% White alone 1,800,914 29.2% Black alone 705,842 11.4% Hispanic 401,818 6.5% Asian alone 291,317 4.7% Two or more races 46,930 0.8% Other race alone 8,930 0.1% American Indian alone 2,417 0.04% Native Hawaiian and Other
Income and house value in Bethesda Median household income in 2022 $174,600 White non-Hispanic householders$65,858 Black householdersover $200,000 American Indian and Alaska Native householders$139,180 Asian householdersover $200,000 Some other race householders$150,611 Two or more races householders$165,360 Hispanic or Latino race householdersMedian 2022 house value over $1,000,000 White Non-Hispanic householders$927,836 Black or African American householders$754,455 American Indian or Alaska Native householders over $1,000,000 Asian householdersover $1,000,000 Some other race householdersover $1,000,000 Two or more races householdersover $1,000,000 Hispanic or Latino householders
Median age by race in Bethesda
46.7 Median age for White residents46.4 46.9 37.4 Median age for Black or African American residents43.0 37.4 43.5 Median age for American Indian / Alaska Native residents43.5 43.5 37.2 Median age for Asian residents40.3 35.7 -666,666,666.0 Median age for Native Hawaiian / Pacific Islander residents-666,666,666.0 -666,666,666.0 43.7 Median age for Other race residents43.3 63.9 32.7 Median age for Two or more races residents25.8 49.6 46.8 Median age for White alone residents46.6 46.9 45.4 Median age for Hispanic or Latino residents35.3 56.2
Owner/renter occupied households by race in Bethesda
House owners and renters - White residents 13,904 64.4% Owner occupied7,690 35.6% Renter occupiedHouse owners and renters - Black or African American residents 688 45.9% Owner occupied810 54.1% Renter occupiedHouse owners and renters - American Indian / Alaska Native residents 42 100.0% Owner occupiedHouse owners and renters - Asian residents 1,998 63.7% Owner occupied1,138 36.3% Renter occupiedHouse owners and renters - Other race residents 325 75.0% Owner occupied108 25.0% Renter occupiedHouse owners and renters - Two or more races residents 909 46.5% Owner occupied1,047 53.5% Renter occupiedHouse owners and renters - White alone residents 13,496 64.8% Owner occupied7,343 35.2% Renter occupiedHouse owners and renters - Hispanic or Latino residents 1,161 57.7% Owner occupied850 42.3% Renter occupied
Language usage in Bethesda
English speakers - Total 66.1% of residents of Bethesda speak English at home.
6.0% of residents speak Spanish at home 3,717 94.2% Speak English very well228 5.8% Speak English less than very well27.9% of residents speak other language at home 13,961 76.0% Speak English very well4,400 24.0% Speak English less than very well
English speakers - Born in the United States 88.0% of residents of Bethesda speak English at home.
2.0% of residents speak Spanish at home 672 92.2% Speak English very well57 7.8% Speak English less than very well10.0% of residents speak other language at home 2,504 69.7% Speak English very well1,087 30.3% Speak English less than very well
English speakers - Native, born elsewhere 48.4% of residents of Bethesda speak English at home.
15.3% of residents speak Spanish at home 504 100.0% Speak English very well36.3% of residents speak other language at home 996 83.5% Speak English very well197 16.5% Speak English less than very well
English speakers - Foreign-born 21.3% of residents of Bethesda speak English at home.
13.0% of residents speak Spanish at home 2,259 93.0% Speak English very well171 7.0% Speak English less than very well65.7% of residents speak other language at home 9,173 74.6% Speak English very well3,116 25.4% Speak English less than very well
White (Caucasian) - Speak only English Native:
92.5% (34,587)Foreign-born:
26.5% (2,420)
White (Caucasian) - Speak another language Native:
7.5% (2,823)Foreign-born:
73.5% (6,702)
Black or African American - Speak only English Native:
79.7% (1,577)Foreign-born:
10.1% (109)
Black or African American - Speak another language Native:
21.0% (416)Foreign-born:
92.6% (998)
Asian - Speak only English Native:
24.4% (833)Foreign-born:
20.7% (1,180)
Asian - Speak another language Native:
75.6% (2,577)Foreign-born:
79.3% (4,523)
Other race - Speak only English Native:
78.6% (510)Foreign-born:
6.6% (32)
Other race - Speak another language Native:
35.6% (231)Foreign-born:
93.0% (455)
Two or more races - Speak only English Native:
61.1% (2,218)Foreign-born:
6.9% (146)
Two or more races - Speak another language Native:
38.9% (1,412)Foreign-born:
93.1% (1,958)
White alone - Speak only English Native:
92.5% (33,733)Foreign-born:
27.3% (2,351)
White alone - Speak another language Native:
7.5% (2,727)Foreign-born:
72.7% (6,259)
Hispanic or Latino - Speak only English Native:
58.3% (1,510)Foreign-born:
2.7% (69)
Hispanic or Latino - Speak another language Native:
41.7% (1,081)Foreign-born:
97.3% (2,448)
Foreign-born residents in Bethesda 16,729 residents are foreign born (9.9% Asia , 6.5% Europe , 4.7% Latin America ).
This city:
25.3%Maryland:
15.7%
Marital status for residents in Bethesda Marital status - White (Caucasian) population 15 years and over
Males 31.2% Never married58.8% Now married0.2% Separated2.8% Widowed7.0% DivorcedFemales 29.2% Never married50.7% Now married1.0% Separated8.0% Widowed11.2% DivorcedWomen who gave birth in the past 12 months Now married:
100.0% (257)Unmarried:
0.0% (0)
Women who did not give birth in the past 12 months Now married:
38.5% (3,706)Unmarried:
61.5% (5,924)
Marital status - Black or African American population 15 years and over
Males 20.2% Never married67.2% Now married1.4% Separated3.6% Widowed7.6% DivorcedFemales 41.4% Never married33.2% Now married1.7% Separated7.3% Widowed16.5% DivorcedWomen who gave birth in the past 12 months Now married:
0.0% (0)Unmarried:
100.0% (7)
Women who did not give birth in the past 12 months Now married:
34.5% (300)Unmarried:
65.5% (569)
Marital status - American Indian / Alaska Native population 15 years and over
Males 68.8% Never married11.7% Now married0.0% Separated0.0% Widowed19.5% DivorcedFemales 68.6% Never married31.4% Now married0.0% Separated0.0% Widowed0.0% DivorcedWomen who did not give birth in the past 12 months Now married:
20.5% (13)Unmarried:
79.5% (52)
Marital status - Asian population 15 years and over
Males 22.0% Never married72.9% Now married0.0% Separated1.0% Widowed4.0% DivorcedFemales 22.9% Never married65.5% Now married0.5% Separated6.3% Widowed4.8% DivorcedWomen who gave birth in the past 12 months Now married:
100.0% (259)Unmarried:
0.0% (0)
Women who did not give birth in the past 12 months Now married:
50.5% (1,406)Unmarried:
49.5% (1,377)
Marital status - Other race population 15 years and over
Males 26.7% Never married62.5% Now married0.0% Separated0.0% Widowed10.7% DivorcedFemales 22.2% Never married74.3% Now married3.0% Separated0.0% Widowed0.5% DivorcedWomen who did not give birth in the past 12 months Now married:
58.8% (156)Unmarried:
41.2% (109)
Marital status - Two or more races population 15 years and over
Males 42.3% Never married52.7% Now married0.7% Separated0.0% Widowed4.3% DivorcedFemales 31.9% Never married47.4% Now married0.4% Separated5.4% Widowed14.8% DivorcedWomen who gave birth in the past 12 months Now married:
100.0% (25)Unmarried:
0.0% (0)
Women who did not give birth in the past 12 months Now married:
40.7% (603)Unmarried:
59.3% (877)
Marital status - White alone, not Hispanic / Latino population 15 years and over
Males 31.1% Never married59.2% Now married0.3% Separated2.9% Widowed6.5% DivorcedFemales 29.1% Never married50.4% Now married1.0% Separated8.2% Widowed11.2% DivorcedWomen who gave birth in the past 12 months Now married:
100.0% (257)Unmarried:
0.0% (0)
Women who did not give birth in the past 12 months Now married:
38.3% (3,545)Unmarried:
61.7% (5,699)
Marital status - Hispanic or Latino population 15 years and over
Males 43.4% Never married47.8% Now married0.0% Separated0.0% Widowed8.8% DivorcedFemales 29.6% Never married63.1% Now married0.0% Separated0.0% Widowed7.3% DivorcedWomen who gave birth in the past 12 months Now married:
100.0% (39)Unmarried:
0.0% (0)
Women who did not give birth in the past 12 months Now married:
48.6% (724)Unmarried:
51.4% (767)
Ancestries in Bethesda
2,202 6.2% Irish2,049 5.8% English1,938 5.5% German1,921 5.4% Eastern European1,568 4.4% European1,478 4.2% American1,456 4.1% Russian1,411 4.0% Iranian1,069 3.0% Italian687 1.9% French582 1.6% Polish507 1.4% Ethiopian441 1.2% Turkish438 1.2% Scottish424 1.2% Ukrainian394 1.1% Lebanese382 1.1% Afghan341 1.0% Sudanese297 0.8% Greek254 0.7% Brazilian232 0.7% British232 0.7% Northern European227 0.6% Portuguese225 0.6% Romanian213 0.6% Albanian207 0.6% Armenian170 0.5% Danish151 0.4% Macedonian151 0.4% Swedish149 0.4% Egyptian149 0.4% Austrian145 0.4% African145 0.4% Nigerian144 0.4% Dutch142 0.4% South African133 0.4% Australian128 0.4% Hungarian120 0.3% Slovak110 0.3% Belgian99 0.3% Scotch-Irish94 0.3% Swiss89 0.3% Bulgarian74 0.2% Lithuanian62 0.2% Jamaican61 0.2% French Canadian48 0.1% Norwegian46 0.1% Estonian37 0.1% Czech37 0.1% Maltese37 0.1% Scandinavian35 0.10% Finnish32 0.09% Slovene31 0.09% Syrian30 0.08% Senegalese29 0.08% Serbian27 0.08% Welsh26 0.07% Basque26 0.07% Croatian22 0.06% Icelander20 0.06% Ghanaian20 0.06% Haitian19 0.05% Arab18 0.05% Slavic16 0.05% Canadian15 0.04% Yugoslavian14 0.04% Latvian9 0.03% Ugandan8 0.02% Belizean2 0.01% Israeli
Geographical mobility in Bethesda Same house 1 year ago 41,459 86.6% White (Caucasian)2,433 75.6% Black or African American228 92.0% American Indian / Alaska Native7,266 77.2% Asian1,154 92.1% Other race4,741 78.4% Two or more races40,239 86.7% White alone, not Hispanic / Latino5,392 90.3% Hispanic or LatinoMoved within same county 2,204 4.6% White / Caucasian155 4.8% Black or African American17 7.0% American Indian / Alaska Native439 4.7% Asian30 2.4% Other race373 6.2% Two or more races2,139 4.6% White alone, not Hispanic / Latino124 2.1% Hispanic or LatinoMoved within same state 429 0.9% White / Caucasian83 2.6% Black or African American391 0.8% White alone, not Hispanic / Latino94 1.6% Hispanic or LatinoMoved from different state 2,487 5.2% White / Caucasian438 13.6% Black or African American315 3.3% Asian57 4.6% Other race594 9.8% Two or more races2,348 5.1% White alone, not Hispanic / Latino209 3.5% Hispanic or LatinoMoved from abroad 1,278 2.7% White104 3.2% Black or African American1,386 14.7% Asian2 70.6% Native Hawaiian / Pacific Islander13 1.1% Other race342 5.7% Two or more races1,278 2.8% White alone, not Hispanic / Latino149 2.5% Hispanic or Latino
Children Nativity (place of birth) in Bethesda
Children under 6 years - Living with two parents Both parents native 1,355 100.0% NativeBoth parents foreign-born 992 85.8% Native164 14.2% Foreign-bornOne native, one foreign-born parent 820 100.0% NativeChildren under 6 years - Living with one parent Native parent 54 100.0% NativeForeign-born parent 55 100.0% NativeChildren 6 to 17 years - Living with two parents Both parents native 4,220 99.0% Native43 1.0% Foreign-bornBoth parents foreign-born 891 37.9% Native1,459 62.1% Foreign-bornOne native, one foreign-born parent 2,664 100.0% NativeChildren 6 to 17 years - Living with one parent Native parent 1,218 100.0% NativeForeign-born parent 690 52.2% Native633 47.8% Foreign-born
Place of birth for residents in Bethesda 6,842 Asia4,504 Europe3,610 Americas3,245 Latin America2,585 South Central Asia2,552 Eastern Asia2,296 South America1,633 Eastern Europe1,628 Africa1,535 Western Europe1,413 China1,032 Western Asia716 Central America713 Southern Europe673 South Eastern Asia628 Eastern Africa592 Northern Europe464 Northern Africa364 Northern America273 Southern Africa232 Caribbean211 Western Africa142 Oceania142 Australia and New Zealand Subregion50 Middle Africa1,197 India1,101 China863 Iran700 Japan686 France499 Argentina477 Russia449 Brazil438 Korea428 Mexico394 Peru378 Germany361 Colombia355 Canada354 Ethiopia318 Lebanon301 Philippines301 Spain286 Turkey273 South Africa264 United Kingdom256 Italy216 Sri Lanka212 Sudan193 Netherlands189 Taiwan180 Ukraine170 Venezuela154 Bolivia148 Vietnam145 Serbia145 El Salvador138 Australia133 Afghanistan132 Armenia132 Czechoslovakia125 Belgium123 Hong Kong119 Switzerland115 Egypt103 Senegal101 Hungary100 England98 Jamaica94 Ecuador92 Ireland90 North Macedonia (Macedonia)89 Algeria85 Cuba83 Albania81 Bulgaria78 Greece71 Guatemala71 Belarus68 Romania68 Israel63 Azerbaijan62 Indonesia60 Nigeria59 Portugal58 Thailand54 Chile51 Malaysia51 Denmark51 Poland50 Democratic Republic of Congo (Zaire)47 Ghana44 Saudi Arabia44 Pakistan42 Uganda39 Sweden36 Uruguay33 Costa Rica32 Dominican Republic32 Austria29 Zimbabwe29 Nepal27 Uzbekistan27 Nicaragua25 United Arab Emirates25 Lithuania25 Croatia23 Kuwait22 Syria20 Guyana19 Cambodia17 Jordan16 Haiti15 Georgia14 Scotland13 Kazakhstan12 Singapore12 Laos11 Iraq10 Honduras10 Norway8 Kenya6 Latvia6 Bosnia and Herzegovina6 Burma (Myanmar)4 New Zealand
Grandparents responsible for own grandchildren in Bethesda
Grandparents (30 to 59 years) White / Caucasian 10 100.0% Responsible for grandchildrenAsian 7 100.0% Not responsible for grandchildrenWhite alone, not Hispanic / Latino 10 100.0% Responsible for grandchildrenGrandparents (60 years and over) White / Caucasian 38 11.8% Responsible for grandchildren282 88.2% Not responsible for grandchildrenAsian 113 100.0% Not responsible for grandchildrenWhite alone, not Hispanic / Latino 31 8.0% Responsible for grandchildren352 92.0% Not responsible for grandchildren