Races in Berea, South Carolina (SC) Detailed Stats
Data:
Races - White alone (%)
Races - White alone (% change since 2000)
Races - Black alone (%)
Races - Black alone (% change since 2000)
Races - American Indian alone (%)
Races - American Indian alone (% change since 2000)
Races - Asian alone (%)
Races - Asian alone (% change since 2000)
Races - Hispanic (%)
Races - Hispanic (% change since 2000)
Races - Native Hawaiian and Other Pacific Islander alone (%)
Races - Native Hawaiian and Other Pacific Islander alone (% change since 2000)
Races - Two or more races(%)
Races - Two or more races(% change since 2000)
Races - Other race alone (%)
Races - Other race alone (% change since 2000)
Racial diversity
Place of birth - Born in state of residence (%)
Place of birth - Born in state of residence (%) - White
Place of birth - Born in state of residence (%) - Black or African American
Place of birth - Born in state of residence (%) - Asian
Place of birth - Born in state of residence (%) - Hispanic or Latino
Place of birth - Born in state of residence (%) - American Indian and Alaska Native
Place of birth - Born in state of residence (%) - Multirace
Place of birth - Born in state of residence (%) - Other Race
Place of birth - Born in other state (%)
Place of birth - Born in other state (%) - White
Place of birth - Born in other state (%) - Black or African American
Place of birth - Born in other state (%) - Asian
Place of birth - Born in other state (%) - Hispanic or Latino
Place of birth - Born in other state (%) - American Indian and Alaska Native
Place of birth - Born in other state (%) - Multirace
Place of birth - Born in other state (%) - Other Race
Place of birth - Native, outside of US (%)
Place of birth - Native, outside of US (%) - White
Place of birth - Native, outside of US (%) - Black or African American
Place of birth - Native, outside of US (%) - Asian
Place of birth - Native, outside of US (%) - Hispanic or Latino
Place of birth - Native, outside of US (%) - American Indian and Alaska Native
Place of birth - Native, outside of US (%) - Multirace
Place of birth - Native, outside of US (%) - Other Race
Place of birth - Foreign born (%)
Place of birth - Foreign born (%) - White
Place of birth - Foreign born (%) - Black or African American
Place of birth - Foreign born (%) - Asian
Place of birth - Foreign born (%) - Hispanic or Latino
Place of birth - Foreign born (%) - American Indian and Alaska Native
Place of birth - Foreign born (%) - Multirace
Place of birth - Foreign born (%) - Other Race
Residents speaking English at home (%)
Residents speaking English at home - Born in the United States (%)
Residents speaking English at home - Native, born elsewhere (%)
Residents speaking English at home - Foreign born (%)
Residents speaking Spanish at home (%)
Residents speaking Spanish at home - Born in the United States (%)
Residents speaking Spanish at home - Native, born elsewhere (%)
Residents speaking Spanish at home - Foreign born (%)
Residents speaking other language at home (%)
Residents speaking other language at home - Born in the United States (%)
Residents speaking other language at home - Native, born elsewhere (%)
Residents speaking other language at home - Foreign born (%)
Marital status - Never married (%)
Marital status - Now married (%)
Marital status - Separated (%)
Marital status - Widowed (%)
Marital status - Divorced (%)
Ancestries Reported - Arab (%)
Ancestries Reported - Czech (%)
Ancestries Reported - Danish (%)
Ancestries Reported - Dutch (%)
Ancestries Reported - English (%)
Ancestries Reported - French (%)
Ancestries Reported - French Canadian (%)
Ancestries Reported - German (%)
Ancestries Reported - Greek (%)
Ancestries Reported - Hungarian (%)
Ancestries Reported - Irish (%)
Ancestries Reported - Italian (%)
Ancestries Reported - Lithuanian (%)
Ancestries Reported - Norwegian (%)
Ancestries Reported - Polish (%)
Ancestries Reported - Portuguese (%)
Ancestries Reported - Russian (%)
Ancestries Reported - Scotch-Irish (%)
Ancestries Reported - Scottish (%)
Ancestries Reported - Slovak (%)
Ancestries Reported - Subsaharan African (%)
Ancestries Reported - Swedish (%)
Ancestries Reported - Swiss (%)
Ancestries Reported - Ukrainian (%)
Ancestries Reported - United States (%)
Ancestries Reported - Welsh (%)
Ancestries Reported - West Indian (%)
Ancestries Reported - Other (%)
Geographical mobility - Same house 1 year ago (%)
Geographical mobility - Same house 1 year ago (%) - White
Geographical mobility - Same house 1 year ago (%) - Black or African American
Geographical mobility - Same house 1 year ago (%) - Asian
Geographical mobility - Same house 1 year ago (%) - Hispanic or Latino
Geographical mobility - Same house 1 year ago (%) - American Indian and Alaska Native
Geographical mobility - Same house 1 year ago (%) - Multirace
Geographical mobility - Same house 1 year ago (%) - Other Race
Geographical mobility - Moved within same county (%)
Geographical mobility - Moved within same county (%) - White
Geographical mobility - Moved within same county (%) - Black or African American
Geographical mobility - Moved within same county (%) - Asian
Geographical mobility - Moved within same county (%) - Hispanic or Latino
Geographical mobility - Moved within same county (%) - American Indian and Alaska Native
Geographical mobility - Moved within same county (%) - Multirace
Geographical mobility - Moved within same county (%) - Other Race
Geographical mobility - Moved from different county within same state (%)
Geographical mobility - Moved from different county within same state (%) - White
Geographical mobility - Moved from different county within same state (%) - Black or African American
Geographical mobility - Moved from different county within same state (%) - Asian
Geographical mobility - Moved from different county within same state (%) - Hispanic or Latino
Geographical mobility - Moved from different county within same state (%) - American Indian and Alaska Native
Geographical mobility - Moved from different county within same state (%) - Multirace
Geographical mobility - Moved from different county within same state (%) - Other Race
Geographical mobility - Moved from different state (%)
Geographical mobility - Moved from different state (%) - White
Geographical mobility - Moved from different state (%) - Black or African American
Geographical mobility - Moved from different state (%) - Asian
Geographical mobility - Moved from different state (%) - Hispanic or Latino
Geographical mobility - Moved from different state (%) - American Indian and Alaska Native
Geographical mobility - Moved from different state (%) - Multirace
Geographical mobility - Moved from different state (%) - Other Race
Geographical mobility - Moved from abroad (%)
Geographical mobility - Moved from abroad (%) - White
Geographical mobility - Moved from abroad (%) - Black or African American
Geographical mobility - Moved from abroad (%) - Asian
Geographical mobility - Moved from abroad (%) - Hispanic or Latino
Geographical mobility - Moved from abroad (%) - American Indian and Alaska Native
Geographical mobility - Moved from abroad (%) - Multirace
Geographical mobility - Moved from abroad (%) - Other Race
Place of birth for the foreign-born population - Ireland (%)
Place of birth for the foreign-born population - Denmark (%)
Place of birth for the foreign-born population - Norway (%)
Place of birth for the foreign-born population - Sweden (%)
Place of birth for the foreign-born population - United Kingdom (%)
Place of birth for the foreign-born population - England (%)
Place of birth for the foreign-born population - Scotland (%)
Place of birth for the foreign-born population - Other Northern Europe (%)
Place of birth for the foreign-born population - Austria (%)
Place of birth for the foreign-born population - Belgium (%)
Place of birth for the foreign-born population - France (%)
Place of birth for the foreign-born population - Germany (%)
Place of birth for the foreign-born population - Netherlands (%)
Place of birth for the foreign-born population - Switzerland (%)
Place of birth for the foreign-born population - Other Western Europe (%)
Place of birth for the foreign-born population - Greece (%)
Place of birth for the foreign-born population - Italy (%)
Place of birth for the foreign-born population - Portugal (%)
Place of birth for the foreign-born population - Spain (%)
Place of birth for the foreign-born population - Other Southern Europe (%)
Place of birth for the foreign-born population - Albania (%)
Place of birth for the foreign-born population - Belarus (%)
Place of birth for the foreign-born population - Bosnia and Herzegovina (%)
Place of birth for the foreign-born population - Bulgaria (%)
Place of birth for the foreign-born population - Croatia (%)
Place of birth for the foreign-born population - Czechoslovakia (%)
Place of birth for the foreign-born population - Hungary (%)
Place of birth for the foreign-born population - Latvia (%)
Place of birth for the foreign-born population - Lithuania (%)
Place of birth for the foreign-born population - North Macedonia (Macedonia) (%)
Place of birth for the foreign-born population - Moldova (%)
Place of birth for the foreign-born population - Poland (%)
Place of birth for the foreign-born population - Romania (%)
Place of birth for the foreign-born population - Russia (%)
Place of birth for the foreign-born population - Serbia (%)
Place of birth for the foreign-born population - Ukraine (%)
Place of birth for the foreign-born population - Other Eastern Europe (%)
Place of birth for the foreign-born population - China (%)
Place of birth for the foreign-born population - Hong Kong (%)
Place of birth for the foreign-born population - Taiwan (%)
Place of birth for the foreign-born population - Japan (%)
Place of birth for the foreign-born population - Korea (%)
Place of birth for the foreign-born population - Other Eastern Asia (%)
Place of birth for the foreign-born population - Afghanistan (%)
Place of birth for the foreign-born population - Bangladesh (%)
Place of birth for the foreign-born population - India (%)
Place of birth for the foreign-born population - Iran (%)
Place of birth for the foreign-born population - Kazakhstan (%)
Place of birth for the foreign-born population - Nepal (%)
Place of birth for the foreign-born population - Pakistan (%)
Place of birth for the foreign-born population - Sri Lanka (%)
Place of birth for the foreign-born population - Uzbekistan (%)
Place of birth for the foreign-born population - Other South Central Asia (%)
Place of birth for the foreign-born population - Burma (%)
Place of birth for the foreign-born population - Cambodia (%)
Place of birth for the foreign-born population - Indonesia (%)
Place of birth for the foreign-born population - Laos (%)
Place of birth for the foreign-born population - Malaysia (%)
Place of birth for the foreign-born population - Philippines (%)
Place of birth for the foreign-born population - Singapore (%)
Place of birth for the foreign-born population - Thailand (%)
Place of birth for the foreign-born population - Vietnam (%)
Place of birth for the foreign-born population - Other South Eastern Asia (%)
Place of birth for the foreign-born population - Armenia (%)
Place of birth for the foreign-born population - Iraq (%)
Place of birth for the foreign-born population - Israel (%)
Place of birth for the foreign-born population - Jordan (%)
Place of birth for the foreign-born population - Kuwait (%)
Place of birth for the foreign-born population - Lebanon (%)
Place of birth for the foreign-born population - Saudi Arabia (%)
Place of birth for the foreign-born population - Syria (%)
Place of birth for the foreign-born population - Turkey (%)
Place of birth for the foreign-born population - Yemen (%)
Place of birth for the foreign-born population - Other Western Asia (%)
Place of birth for the foreign-born population - Eritrea (%)
Place of birth for the foreign-born population - Ethiopia (%)
Place of birth for the foreign-born population - Kenya (%)
Place of birth for the foreign-born population - Somalia (%)
Place of birth for the foreign-born population - Uganda (%)
Place of birth for the foreign-born population - Zimbabwe (%)
Place of birth for the foreign-born population - Other Eastern Africa (%)
Place of birth for the foreign-born population - Cameroon (%)
Place of birth for the foreign-born population - Congo (%)
Place of birth for the foreign-born population - Democratic Republic of Congo (Zaire) (%)
Place of birth for the foreign-born population - Other Middle Africa (%)
Place of birth for the foreign-born population - Egypt (%)
Place of birth for the foreign-born population - Morocco (%)
Place of birth for the foreign-born population - Sudan (%)
Place of birth for the foreign-born population - Other Northern Africa (%)
Place of birth for the foreign-born population - South Africa (%)
Place of birth for the foreign-born population - Other Southern Africa (%)
Place of birth for the foreign-born population - Cabo Verde (%)
Place of birth for the foreign-born population - Ghana (%)
Place of birth for the foreign-born population - Liberia (%)
Place of birth for the foreign-born population - Nigeria (%)
Place of birth for the foreign-born population - Senegal (%)
Place of birth for the foreign-born population - Sierra Leone (%)
Place of birth for the foreign-born population - Other Western Africa (%)
Place of birth for the foreign-born population - Australia (%)
Place of birth for the foreign-born population - New Zealand (%)
Place of birth for the foreign-born population - Fiji (%)
Place of birth for the foreign-born population - Micronesia (%)
Place of birth for the foreign-born population - Bahamas (%)
Place of birth for the foreign-born population - Barbados (%)
Place of birth for the foreign-born population - Cuba (%)
Place of birth for the foreign-born population - Dominica (%)
Place of birth for the foreign-born population - Dominican Republic (%)
Place of birth for the foreign-born population - Grenada (%)
Place of birth for the foreign-born population - Haiti (%)
Place of birth for the foreign-born population - Jamaica (%)
Place of birth for the foreign-born population - St. Vincent and the Grenadines (%)
Place of birth for the foreign-born population - Trinidad and Tobago (%)
Place of birth for the foreign-born population - West Indies (%)
Place of birth for the foreign-born population - Other Caribbean (%)
Place of birth for the foreign-born population - Belize (%)
Place of birth for the foreign-born population - Costa Rica (%)
Place of birth for the foreign-born population - El Salvador (%)
Place of birth for the foreign-born population - Guatemala (%)
Place of birth for the foreign-born population - Honduras (%)
Place of birth for the foreign-born population - Mexico (%)
Place of birth for the foreign-born population - Nicaragua (%)
Place of birth for the foreign-born population - Panama (%)
Place of birth for the foreign-born population - Other Central America (%)
Place of birth for the foreign-born population - Argentina (%)
Place of birth for the foreign-born population - Bolivia (%)
Place of birth for the foreign-born population - Brazil (%)
Place of birth for the foreign-born population - Chile (%)
Place of birth for the foreign-born population - Colombia (%)
Place of birth for the foreign-born population - Ecuador (%)
Place of birth for the foreign-born population - Guyana (%)
Place of birth for the foreign-born population - Peru (%)
Place of birth for the foreign-born population - Uruguay (%)
Place of birth for the foreign-born population - Venezuela (%)
Place of birth for the foreign-born population - Other South America (%)
Place of birth for the foreign-born population - Canada (%)
Place of birth for the foreign-born population - Other Northern America (%)
Place of birth for the foreign-born population - Other (%)
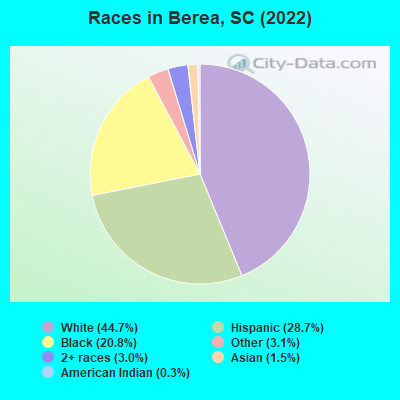
According to 2022 data, the most numerous races in Berea, SC are White alone (7,502 residents), Black alone (3,490 residents), and Hispanic (4,813 residents). 72.9% of Berea residents speak English at home. 18.0% of Berea, SC residents are foreign-born (15.9% born in Latin America), which is 72.2% greater than the foreign-born rate of 5.0% across the entire state of South Carolina.
Race distribution in Berea
2000 2022
2,652,291 66.1% White alone 1,178,486 29.4% Black alone 95,076 2.4% Hispanic 35,568 0.9% Asian alone 33,290 0.8% Two or more races 12,765 0.3% American Indian alone 3,266 0.08% Other race alone 1,270 0.03% Native Hawaiian and Other
3,301,739 62.5% White alone 1,313,290 24.9% Black alone 343,783 6.5% Hispanic 190,508 3.6% Two or more races 89,888 1.7% Asian alone 29,390 0.6% Other race alone 12,112 0.2% American Indian alone 1,924 0.04% Native Hawaiian and Other
Income and house value in Berea Median household income in 2022 $53,809 White non-Hispanic householders$42,325 Black householders$53,623 American Indian and Alaska Native householders$78,868 Asian householders$35,087 Some other race householders$62,067 Two or more races householders$55,075 Hispanic or Latino race householdersMedian 2022 house value $194,337 White Non-Hispanic householders$212,692 Black or African American householders $203,744 Asian householders$182,177 Some other race householders$239,078 Two or more races householders$195,025 Hispanic or Latino householders
Median age by race in Berea
47.5 Median age for White residents47.2 49.0 38.5 Median age for Black or African American residents36.2 41.4 24.1 Median age for American Indian / Alaska Native residents46.2 16.8 46.9 Median age for Asian residents63.6 24.8 -698,412,697.7 Median age for Native Hawaiian / Pacific Islander residents-551,574,375.1 -1,016,109,044.8 31.5 Median age for Other race residents31.6 31.0 20.8 Median age for Two or more races residents21.2 20.3 50.0 Median age for White alone residents50.5 48.7 28.1 Median age for Hispanic or Latino residents30.6 24.6
Owner/renter occupied households by race in Berea
House owners and renters - White residents 2,707 78.1% Owner occupied760 21.9% Renter occupiedHouse owners and renters - Black or African American residents 575 40.0% Owner occupied863 60.0% Renter occupiedHouse owners and renters - American Indian / Alaska Native residents 80 54.6% Owner occupied67 45.4% Renter occupiedHouse owners and renters - Asian residents 112 100.0% Owner occupiedHouse owners and renters - Native Hawaiian / Pacific Islander residents 18 100.0% Renter occupiedHouse owners and renters - Other race residents 263 26.1% Owner occupied742 73.9% Renter occupiedHouse owners and renters - Two or more races residents 361 75.1% Owner occupied120 24.9% Renter occupiedHouse owners and renters - White alone residents 2,609 78.9% Owner occupied698 21.1% Renter occupiedHouse owners and renters - Hispanic or Latino residents 625 49.8% Owner occupied631 50.2% Renter occupied
Language usage in Berea
English speakers - Total 72.9% of residents of Berea speak English at home.
22.5% of residents speak Spanish at home 1,480 42.4% Speak English very well2,012 57.6% Speak English less than very well3.6% of residents speak other language at home 290 51.8% Speak English very well270 48.2% Speak English less than very well
English speakers - Born in the United States 83.8% of residents of Berea speak English at home.
16.5% of residents speak Spanish at home 492 79.1% Speak English very well130 20.9% Speak English less than very well1.2% of residents speak other language at home 42 93.3% Speak English very well3 6.7% Speak English less than very well
English speakers - Native, born elsewhere 25.0% of residents of Berea speak English at home.
38.9% of residents speak Spanish at home 28 100.0% Speak English very well34.7% of residents speak other language at home 15 60.0% Speak English very well10 40.0% Speak English less than very well
English speakers - Foreign-born 8.0% of residents of Berea speak English at home.
67.6% of residents speak Spanish at home 333 17.5% Speak English very well1,566 82.5% Speak English less than very well14.8% of residents speak other language at home 152 36.5% Speak English very well264 63.5% Speak English less than very well
White (Caucasian) - Speak only English Native:
97.6% (6,812)Foreign-born:
5.1% (27)
White (Caucasian) - Speak another language Native:
2.3% (162)Foreign-born:
78.7% (406)
Black or African American - Speak only English Native:
91.9% (3,235)Foreign-born:
20.1% (5)
Black or African American - Speak another language Native:
9.5% (333)Foreign-born:
58.1% (15)
American Indian / Alaska Native - Speak only English Native:
39.1% (59)Foreign-born:
8.6% (42)
American Indian / Alaska Native - Speak another language Native:
69.1% (105)Foreign-born:
91.1% (441)
Asian - Speak only English Native:
50.1% (63)Foreign-born:
33.1% (45)
Asian - Speak another language Native:
38.8% (49)Foreign-born:
67.3% (92)
Other race - Speak only English Native:
54.7% (580)Foreign-born:
10.1% (155)
Other race - Speak another language Native:
47.2% (501)Foreign-born:
89.4% (1,369)
Two or more races - Speak another language Native:
52.7% (575)Foreign-born:
100.0% (486)
White alone - Speak only English Native:
98.9% (6,720)Foreign-born:
11.0% (28)
White alone - Speak another language Native:
1.1% (77)Foreign-born:
84.3% (213)
Hispanic or Latino - Speak only English Native:
25.3% (475)Foreign-born:
6.8% (156)
Hispanic or Latino - Speak another language Native:
68.5% (1,288)Foreign-born:
92.7% (2,128)
Foreign-born residents in Berea 3,018 residents are foreign born (15.9% Latin America ).
This city:
18.0%South Carolina:
5.3%
Marital status for residents in Berea Marital status - White (Caucasian) population 15 years and over
Males 27.8% Never married51.4% Now married3.8% Separated3.5% Widowed13.5% DivorcedFemales 22.5% Never married43.2% Now married2.5% Separated15.5% Widowed16.3% DivorcedWomen who gave birth in the past 12 months Now married:
70.6% (77)Unmarried:
29.4% (32)
Women who did not give birth in the past 12 months Now married:
41.6% (650)Unmarried:
58.4% (912)
Marital status - Black or African American population 15 years and over
Males 51.1% Never married25.8% Now married6.1% Separated7.6% Widowed9.4% DivorcedFemales 52.1% Never married13.7% Now married16.8% Separated6.1% Widowed11.3% DivorcedWomen who gave birth in the past 12 months Now married:
47.5% (19)Unmarried:
52.5% (21)
Women who did not give birth in the past 12 months Now married:
21.4% (203)Unmarried:
78.6% (744)
Marital status - American Indian / Alaska Native population 15 years and over
Males 65.4% Never married33.5% Now married1.0% Separated0.0% Widowed0.0% DivorcedFemales 46.5% Never married22.5% Now married0.0% Separated31.0% Widowed0.0% DivorcedWomen who did not give birth in the past 12 months Now married:
32.7% (44)Unmarried:
67.3% (91)
Marital status - Asian population 15 years and over
Males 42.9% Never married57.1% Now married0.0% Separated0.0% Widowed0.0% DivorcedFemales 40.9% Never married52.3% Now married0.0% Separated6.8% Widowed0.0% DivorcedWomen who gave birth in the past 12 months Now married:
0.0% (0)Unmarried:
100.0% (40)
Women who did not give birth in the past 12 months Now married:
100.0% (8)Unmarried:
0.0% (0)
Marital status - Other race population 15 years and over
Males 45.5% Never married46.4% Now married2.9% Separated0.0% Widowed5.2% DivorcedFemales 52.7% Never married38.7% Now married3.7% Separated0.0% Widowed4.9% DivorcedWomen who did not give birth in the past 12 months Now married:
23.0% (175)Unmarried:
77.0% (585)
Marital status - Two or more races population 15 years and over
Males 52.0% Never married44.1% Now married2.7% Separated0.0% Widowed1.3% DivorcedFemales 46.2% Never married42.7% Now married0.0% Separated9.0% Widowed2.1% DivorcedWomen who gave birth in the past 12 months Now married:
100.0% (39)Unmarried:
0.0% (0)
Women who did not give birth in the past 12 months Now married:
14.0% (35)Unmarried:
86.0% (215)
Marital status - White alone, not Hispanic / Latino population 15 years and over
Males 25.9% Never married52.4% Now married3.2% Separated4.0% Widowed14.5% DivorcedFemales 22.4% Never married43.3% Now married2.6% Separated15.5% Widowed16.2% DivorcedWomen who gave birth in the past 12 months Now married:
67.0% (66)Unmarried:
33.0% (33)
Women who did not give birth in the past 12 months Now married:
40.9% (614)Unmarried:
59.1% (887)
Marital status - Hispanic or Latino population 15 years and over
Males 46.4% Never married46.3% Now married3.6% Separated0.0% Widowed3.7% DivorcedFemales 42.3% Never married45.8% Now married2.3% Separated3.0% Widowed6.5% DivorcedWomen who gave birth in the past 12 months Now married:
100.0% (52)Unmarried:
0.0% (0)
Women who did not give birth in the past 12 months Now married:
29.1% (253)Unmarried:
70.9% (618)
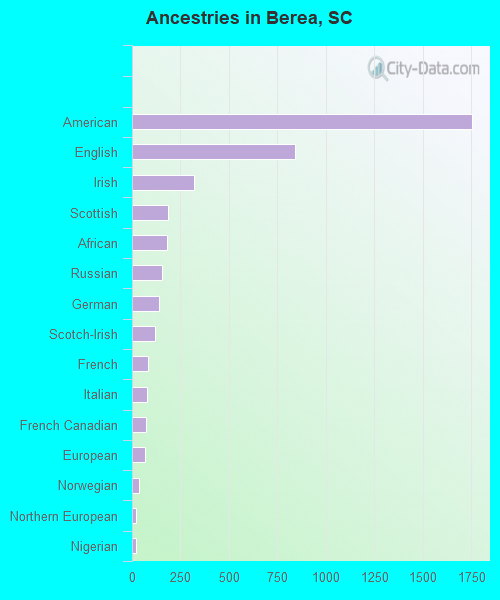
Ancestries in Berea
1,754 17.2% American839 8.2% English322 3.2% Irish187 1.8% Scottish182 1.8% African157 1.5% Russian141 1.4% German118 1.2% Scotch-Irish83 0.8% French78 0.8% Italian72 0.7% French Canadian68 0.7% European35 0.3% Norwegian20 0.2% Northern European20 0.2% Nigerian15 0.1% Eastern European11 0.1% Scandinavian10 0.10% West Indian9 0.09% Lithuanian7 0.07% Polish4 0.04% British
Geographical mobility in Berea Same house 1 year ago 6,723 84.4% White (Caucasian)3,268 89.1% Black or African American317 61.1% American Indian / Alaska Native243 94.3% Asian17 100.0% Native Hawaiian / Pacific Islander2,484 85.0% Other race1,371 71.5% Two or more races6,328 85.4% White alone, not Hispanic / Latino3,640 76.9% Hispanic or LatinoMoved within same county 297 3.7% White / Caucasian299 8.1% Black or African American82 15.8% American Indian / Alaska Native329 11.2% Other race415 21.7% Two or more races270 3.6% White alone, not Hispanic / Latino763 16.1% Hispanic or LatinoMoved within same state 245 3.1% White / Caucasian12 0.3% Black or African American12 4.5% Asian22 0.7% Other race209 10.9% Two or more races251 3.4% White alone, not Hispanic / Latino279 5.9% Hispanic or LatinoMoved from different state 647 8.1% White / Caucasian69 1.9% Black or African American7 0.2% Other race472 6.4% White alone, not Hispanic / Latino80 1.7% Hispanic or LatinoMoved from abroad 116 1.5% White7 2.8% Asian93 3.2% Other race23 1.2% Two or more races124 1.7% White alone, not Hispanic / Latino105 2.2% Hispanic or Latino
Children Nativity (place of birth) in Berea
Children under 6 years - Living with two parents Both parents native 370 100.0% NativeBoth parents foreign-born 64 76.9% Native19 23.1% Foreign-bornOne native, one foreign-born parent 108 100.0% NativeChildren under 6 years - Living with one parent Native parent 371 100.0% NativeForeign-born parent 174 84.4% Native32 15.6% Foreign-bornChildren 6 to 17 years - Living with two parents Both parents native 592 98.0% Native12 2.0% Foreign-bornBoth parents foreign-born 229 75.6% Native74 24.4% Foreign-bornOne native, one foreign-born parent 79 100.0% NativeChildren 6 to 17 years - Living with one parent Native parent 570 100.0% NativeForeign-born parent 220 57.2% Native164 42.8% Foreign-born
Grandparents responsible for own grandchildren in Berea
Grandparents (30 to 59 years) White / Caucasian 21 25.4% Responsible for grandchildren61 74.6% Not responsible for grandchildrenBlack or African American 18 84.1% Responsible for grandchildren3 15.9% Not responsible for grandchildrenAmerican Indian / Alaska Native 30 47.1% Responsible for grandchildren33 52.9% Not responsible for grandchildrenOther race 60 100.0% Responsible for grandchildrenTwo or more races 205 100.0% Not responsible for grandchildrenWhite alone, not Hispanic / Latino 21 23.3% Responsible for grandchildren69 76.7% Not responsible for grandchildrenHispanic or Latino 59 20.2% Responsible for grandchildren232 79.8% Not responsible for grandchildrenGrandparents (60 years and over) White / Caucasian 56 57.6% Responsible for grandchildren41 42.4% Not responsible for grandchildrenBlack or African American 18 37.3% Responsible for grandchildren30 62.7% Not responsible for grandchildrenOther race 157 47.6% Responsible for grandchildren172 52.4% Not responsible for grandchildrenTwo or more races 12 100.0% Responsible for grandchildrenWhite alone, not Hispanic / Latino 58 57.7% Responsible for grandchildren42 42.3% Not responsible for grandchildrenHispanic or Latino 110 39.1% Responsible for grandchildren171 60.9% Not responsible for grandchildren