Races in Bennsville, Maryland (MD) Detailed Stats
Ancestries, Foreign-born residents, place of birth

Discuss Bennsville, Maryland races on our local forum with over 2,400,000 registered users
2.4% of Bennsville, MD residents are foreign-born (1.0% born in Asia, 0.7% born in Latin America, 0.7% born in Europe), which is 554.7% less than the foreign-born rate of 16.0% across the entire state of Maryland.
Race distribution in Bennsville

- 5,51275.2%White alone
- 1,30417.8%Black alone
- 1692.3%Asian alone
- 1612.2%Hispanic
- 1351.8%Two or more races
- 290.4%American Indian alone
- 80.1%Other race alone
- 70.10%Native Hawaiian and Other
Pacific Islander alone

2000
2022
-
- 3,286,54762.1%White alone
- 1,464,73527.7%Black alone
- 227,9164.3%Hispanic
- 209,7384.0%Asian alone
- 82,9461.6%Two or more races
- 13,3120.3%American Indian alone
- 9,3790.2%Other race alone
- 1,9130.04%Native Hawaiian and Other
Pacific Islander alone

-
- 2,906,49247.1%White alone
- 1,800,91429.2%Black alone
- 705,84211.4%Hispanic
- 401,8186.5%Asian alone
- 291,3174.7%Two or more races
- 46,9300.8%Other race alone
- 8,9300.1%American Indian alone
- 2,4170.04%Native Hawaiian and Other
Pacific Islander alone

Income and house value in Bennsville
- Median household income in 2022
- $151,090White non-Hispanic householders
- $177,485Black householders
- $45,391American Indian and Alaska Native householders
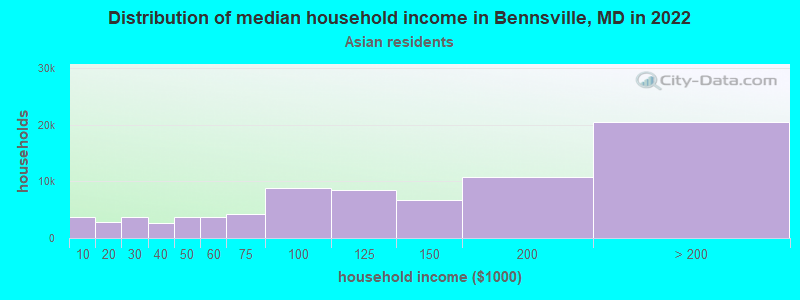
- $100,995Asian householders
- $100,731Some other race householders
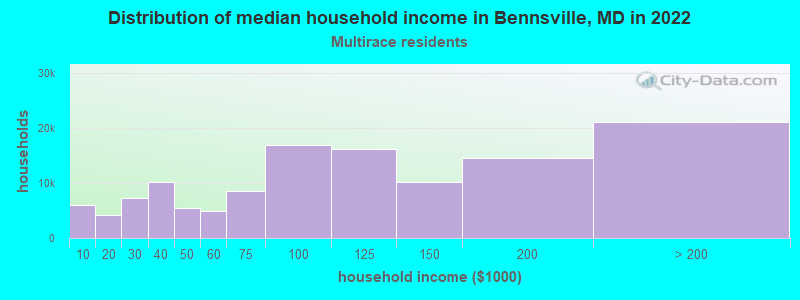
- over $200,000Two or more races householders
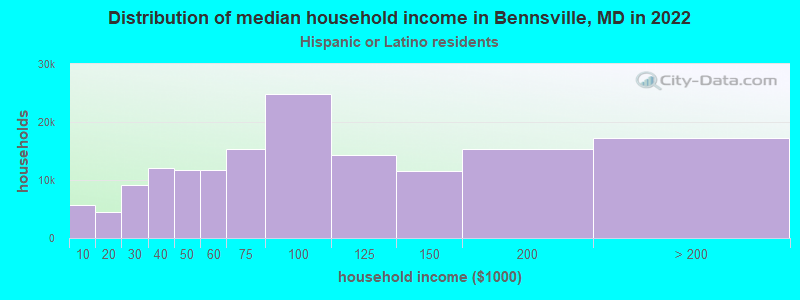
- over $200,000Hispanic or Latino race householders
- Median 2022 house value
- $493,974White Non-Hispanic householders
- $561,902Black or African American householders
- $487,988American Indian or Alaska Native householders
- $437,498Asian householders
- $528,589Some other race householders
- $435,155Two or more races householders
- $487,988Hispanic or Latino householders
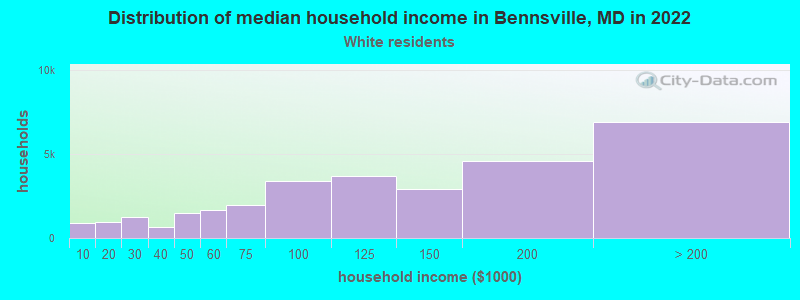
Household income for White non-Hispanic householders
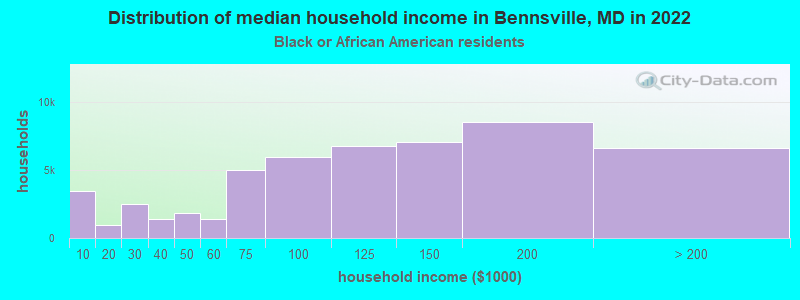
Household income for Black householders
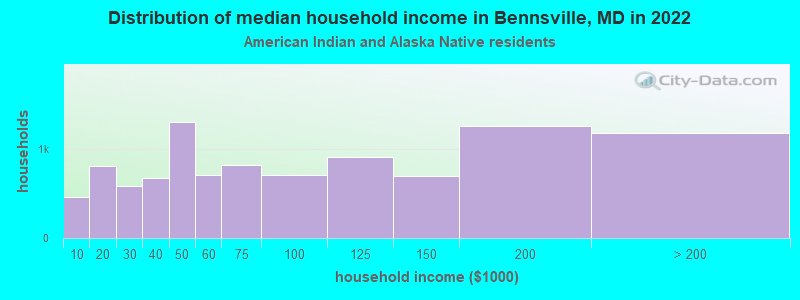
Household income for American Indian and Alaska Native householders
Household income for Asian householders
Household income for Two or more races householders
Household income for Hispanic or Latino race householders
Foreign-born residents in Bennsville
179 residents are foreign born (1.0% Asia, 0.7% Latin America, 0.7% Europe).
| This city: | 2.4% |
| Maryland: | 9.8% |
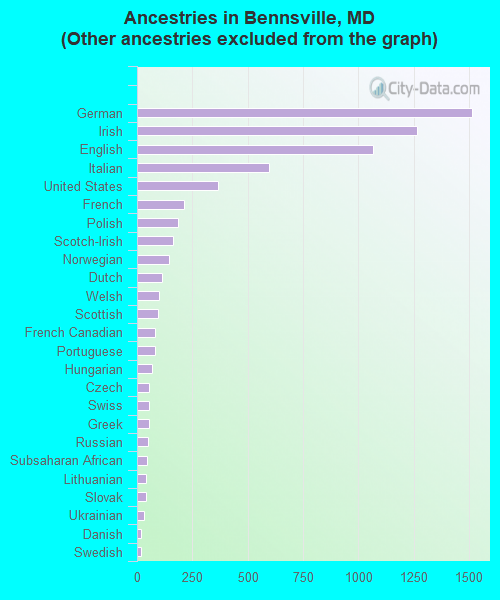
Ancestries in Bennsville

- 1,99723.6%Other
- 1,51517.9%German
- 1,26514.9%Irish
- 1,06512.6%English
- 5977.1%Italian
- 3644.3%United States
- 2132.5%French
- 1842.2%Polish
- 1631.9%Scotch-Irish
- 1441.7%Norwegian
- 1131.3%Dutch
- 981.2%Welsh
- 941.1%Scottish
- 800.9%French Canadian
- 800.9%Portuguese
- 670.8%Hungarian
- 540.6%Czech
- 540.6%Swiss
- 530.6%Greek
- 490.6%Russian
- 460.5%Subsaharan African
- 420.5%Lithuanian
- 390.5%Slovak
- 300.4%Ukrainian
- 190.2%Danish
- 170.2%Swedish
- 140.2%West Indian
- 120.1%Arab