Races in Belvedere Park, Georgia (GA) Detailed Stats
Data:
Races - White alone (%)
Races - White alone (% change since 2000)
Races - Black alone (%)
Races - Black alone (% change since 2000)
Races - American Indian alone (%)
Races - American Indian alone (% change since 2000)
Races - Asian alone (%)
Races - Asian alone (% change since 2000)
Races - Hispanic (%)
Races - Hispanic (% change since 2000)
Races - Native Hawaiian and Other Pacific Islander alone (%)
Races - Native Hawaiian and Other Pacific Islander alone (% change since 2000)
Races - Two or more races(%)
Races - Two or more races(% change since 2000)
Races - Other race alone (%)
Races - Other race alone (% change since 2000)
Racial diversity
Place of birth - Born in state of residence (%)
Place of birth - Born in state of residence (%) - White
Place of birth - Born in state of residence (%) - Black or African American
Place of birth - Born in state of residence (%) - Asian
Place of birth - Born in state of residence (%) - Hispanic or Latino
Place of birth - Born in state of residence (%) - American Indian and Alaska Native
Place of birth - Born in state of residence (%) - Multirace
Place of birth - Born in state of residence (%) - Other Race
Place of birth - Born in other state (%)
Place of birth - Born in other state (%) - White
Place of birth - Born in other state (%) - Black or African American
Place of birth - Born in other state (%) - Asian
Place of birth - Born in other state (%) - Hispanic or Latino
Place of birth - Born in other state (%) - American Indian and Alaska Native
Place of birth - Born in other state (%) - Multirace
Place of birth - Born in other state (%) - Other Race
Place of birth - Native, outside of US (%)
Place of birth - Native, outside of US (%) - White
Place of birth - Native, outside of US (%) - Black or African American
Place of birth - Native, outside of US (%) - Asian
Place of birth - Native, outside of US (%) - Hispanic or Latino
Place of birth - Native, outside of US (%) - American Indian and Alaska Native
Place of birth - Native, outside of US (%) - Multirace
Place of birth - Native, outside of US (%) - Other Race
Place of birth - Foreign born (%)
Place of birth - Foreign born (%) - White
Place of birth - Foreign born (%) - Black or African American
Place of birth - Foreign born (%) - Asian
Place of birth - Foreign born (%) - Hispanic or Latino
Place of birth - Foreign born (%) - American Indian and Alaska Native
Place of birth - Foreign born (%) - Multirace
Place of birth - Foreign born (%) - Other Race
Residents speaking English at home (%)
Residents speaking English at home - Born in the United States (%)
Residents speaking English at home - Native, born elsewhere (%)
Residents speaking English at home - Foreign born (%)
Residents speaking Spanish at home (%)
Residents speaking Spanish at home - Born in the United States (%)
Residents speaking Spanish at home - Native, born elsewhere (%)
Residents speaking Spanish at home - Foreign born (%)
Residents speaking other language at home (%)
Residents speaking other language at home - Born in the United States (%)
Residents speaking other language at home - Native, born elsewhere (%)
Residents speaking other language at home - Foreign born (%)
Marital status - Never married (%)
Marital status - Now married (%)
Marital status - Separated (%)
Marital status - Widowed (%)
Marital status - Divorced (%)
Ancestries Reported - Arab (%)
Ancestries Reported - Czech (%)
Ancestries Reported - Danish (%)
Ancestries Reported - Dutch (%)
Ancestries Reported - English (%)
Ancestries Reported - French (%)
Ancestries Reported - French Canadian (%)
Ancestries Reported - German (%)
Ancestries Reported - Greek (%)
Ancestries Reported - Hungarian (%)
Ancestries Reported - Irish (%)
Ancestries Reported - Italian (%)
Ancestries Reported - Lithuanian (%)
Ancestries Reported - Norwegian (%)
Ancestries Reported - Polish (%)
Ancestries Reported - Portuguese (%)
Ancestries Reported - Russian (%)
Ancestries Reported - Scotch-Irish (%)
Ancestries Reported - Scottish (%)
Ancestries Reported - Slovak (%)
Ancestries Reported - Subsaharan African (%)
Ancestries Reported - Swedish (%)
Ancestries Reported - Swiss (%)
Ancestries Reported - Ukrainian (%)
Ancestries Reported - United States (%)
Ancestries Reported - Welsh (%)
Ancestries Reported - West Indian (%)
Ancestries Reported - Other (%)
Geographical mobility - Same house 1 year ago (%)
Geographical mobility - Same house 1 year ago (%) - White
Geographical mobility - Same house 1 year ago (%) - Black or African American
Geographical mobility - Same house 1 year ago (%) - Asian
Geographical mobility - Same house 1 year ago (%) - Hispanic or Latino
Geographical mobility - Same house 1 year ago (%) - American Indian and Alaska Native
Geographical mobility - Same house 1 year ago (%) - Multirace
Geographical mobility - Same house 1 year ago (%) - Other Race
Geographical mobility - Moved within same county (%)
Geographical mobility - Moved within same county (%) - White
Geographical mobility - Moved within same county (%) - Black or African American
Geographical mobility - Moved within same county (%) - Asian
Geographical mobility - Moved within same county (%) - Hispanic or Latino
Geographical mobility - Moved within same county (%) - American Indian and Alaska Native
Geographical mobility - Moved within same county (%) - Multirace
Geographical mobility - Moved within same county (%) - Other Race
Geographical mobility - Moved from different county within same state (%)
Geographical mobility - Moved from different county within same state (%) - White
Geographical mobility - Moved from different county within same state (%) - Black or African American
Geographical mobility - Moved from different county within same state (%) - Asian
Geographical mobility - Moved from different county within same state (%) - Hispanic or Latino
Geographical mobility - Moved from different county within same state (%) - American Indian and Alaska Native
Geographical mobility - Moved from different county within same state (%) - Multirace
Geographical mobility - Moved from different county within same state (%) - Other Race
Geographical mobility - Moved from different state (%)
Geographical mobility - Moved from different state (%) - White
Geographical mobility - Moved from different state (%) - Black or African American
Geographical mobility - Moved from different state (%) - Asian
Geographical mobility - Moved from different state (%) - Hispanic or Latino
Geographical mobility - Moved from different state (%) - American Indian and Alaska Native
Geographical mobility - Moved from different state (%) - Multirace
Geographical mobility - Moved from different state (%) - Other Race
Geographical mobility - Moved from abroad (%)
Geographical mobility - Moved from abroad (%) - White
Geographical mobility - Moved from abroad (%) - Black or African American
Geographical mobility - Moved from abroad (%) - Asian
Geographical mobility - Moved from abroad (%) - Hispanic or Latino
Geographical mobility - Moved from abroad (%) - American Indian and Alaska Native
Geographical mobility - Moved from abroad (%) - Multirace
Geographical mobility - Moved from abroad (%) - Other Race
Place of birth for the foreign-born population - Ireland (%)
Place of birth for the foreign-born population - Denmark (%)
Place of birth for the foreign-born population - Norway (%)
Place of birth for the foreign-born population - Sweden (%)
Place of birth for the foreign-born population - United Kingdom (%)
Place of birth for the foreign-born population - England (%)
Place of birth for the foreign-born population - Scotland (%)
Place of birth for the foreign-born population - Other Northern Europe (%)
Place of birth for the foreign-born population - Austria (%)
Place of birth for the foreign-born population - Belgium (%)
Place of birth for the foreign-born population - France (%)
Place of birth for the foreign-born population - Germany (%)
Place of birth for the foreign-born population - Netherlands (%)
Place of birth for the foreign-born population - Switzerland (%)
Place of birth for the foreign-born population - Other Western Europe (%)
Place of birth for the foreign-born population - Greece (%)
Place of birth for the foreign-born population - Italy (%)
Place of birth for the foreign-born population - Portugal (%)
Place of birth for the foreign-born population - Spain (%)
Place of birth for the foreign-born population - Other Southern Europe (%)
Place of birth for the foreign-born population - Albania (%)
Place of birth for the foreign-born population - Belarus (%)
Place of birth for the foreign-born population - Bosnia and Herzegovina (%)
Place of birth for the foreign-born population - Bulgaria (%)
Place of birth for the foreign-born population - Croatia (%)
Place of birth for the foreign-born population - Czechoslovakia (%)
Place of birth for the foreign-born population - Hungary (%)
Place of birth for the foreign-born population - Latvia (%)
Place of birth for the foreign-born population - Lithuania (%)
Place of birth for the foreign-born population - North Macedonia (Macedonia) (%)
Place of birth for the foreign-born population - Moldova (%)
Place of birth for the foreign-born population - Poland (%)
Place of birth for the foreign-born population - Romania (%)
Place of birth for the foreign-born population - Russia (%)
Place of birth for the foreign-born population - Serbia (%)
Place of birth for the foreign-born population - Ukraine (%)
Place of birth for the foreign-born population - Other Eastern Europe (%)
Place of birth for the foreign-born population - China (%)
Place of birth for the foreign-born population - Hong Kong (%)
Place of birth for the foreign-born population - Taiwan (%)
Place of birth for the foreign-born population - Japan (%)
Place of birth for the foreign-born population - Korea (%)
Place of birth for the foreign-born population - Other Eastern Asia (%)
Place of birth for the foreign-born population - Afghanistan (%)
Place of birth for the foreign-born population - Bangladesh (%)
Place of birth for the foreign-born population - India (%)
Place of birth for the foreign-born population - Iran (%)
Place of birth for the foreign-born population - Kazakhstan (%)
Place of birth for the foreign-born population - Nepal (%)
Place of birth for the foreign-born population - Pakistan (%)
Place of birth for the foreign-born population - Sri Lanka (%)
Place of birth for the foreign-born population - Uzbekistan (%)
Place of birth for the foreign-born population - Other South Central Asia (%)
Place of birth for the foreign-born population - Burma (%)
Place of birth for the foreign-born population - Cambodia (%)
Place of birth for the foreign-born population - Indonesia (%)
Place of birth for the foreign-born population - Laos (%)
Place of birth for the foreign-born population - Malaysia (%)
Place of birth for the foreign-born population - Philippines (%)
Place of birth for the foreign-born population - Singapore (%)
Place of birth for the foreign-born population - Thailand (%)
Place of birth for the foreign-born population - Vietnam (%)
Place of birth for the foreign-born population - Other South Eastern Asia (%)
Place of birth for the foreign-born population - Armenia (%)
Place of birth for the foreign-born population - Iraq (%)
Place of birth for the foreign-born population - Israel (%)
Place of birth for the foreign-born population - Jordan (%)
Place of birth for the foreign-born population - Kuwait (%)
Place of birth for the foreign-born population - Lebanon (%)
Place of birth for the foreign-born population - Saudi Arabia (%)
Place of birth for the foreign-born population - Syria (%)
Place of birth for the foreign-born population - Turkey (%)
Place of birth for the foreign-born population - Yemen (%)
Place of birth for the foreign-born population - Other Western Asia (%)
Place of birth for the foreign-born population - Eritrea (%)
Place of birth for the foreign-born population - Ethiopia (%)
Place of birth for the foreign-born population - Kenya (%)
Place of birth for the foreign-born population - Somalia (%)
Place of birth for the foreign-born population - Uganda (%)
Place of birth for the foreign-born population - Zimbabwe (%)
Place of birth for the foreign-born population - Other Eastern Africa (%)
Place of birth for the foreign-born population - Cameroon (%)
Place of birth for the foreign-born population - Congo (%)
Place of birth for the foreign-born population - Democratic Republic of Congo (Zaire) (%)
Place of birth for the foreign-born population - Other Middle Africa (%)
Place of birth for the foreign-born population - Egypt (%)
Place of birth for the foreign-born population - Morocco (%)
Place of birth for the foreign-born population - Sudan (%)
Place of birth for the foreign-born population - Other Northern Africa (%)
Place of birth for the foreign-born population - South Africa (%)
Place of birth for the foreign-born population - Other Southern Africa (%)
Place of birth for the foreign-born population - Cabo Verde (%)
Place of birth for the foreign-born population - Ghana (%)
Place of birth for the foreign-born population - Liberia (%)
Place of birth for the foreign-born population - Nigeria (%)
Place of birth for the foreign-born population - Senegal (%)
Place of birth for the foreign-born population - Sierra Leone (%)
Place of birth for the foreign-born population - Other Western Africa (%)
Place of birth for the foreign-born population - Australia (%)
Place of birth for the foreign-born population - New Zealand (%)
Place of birth for the foreign-born population - Fiji (%)
Place of birth for the foreign-born population - Micronesia (%)
Place of birth for the foreign-born population - Bahamas (%)
Place of birth for the foreign-born population - Barbados (%)
Place of birth for the foreign-born population - Cuba (%)
Place of birth for the foreign-born population - Dominica (%)
Place of birth for the foreign-born population - Dominican Republic (%)
Place of birth for the foreign-born population - Grenada (%)
Place of birth for the foreign-born population - Haiti (%)
Place of birth for the foreign-born population - Jamaica (%)
Place of birth for the foreign-born population - St. Vincent and the Grenadines (%)
Place of birth for the foreign-born population - Trinidad and Tobago (%)
Place of birth for the foreign-born population - West Indies (%)
Place of birth for the foreign-born population - Other Caribbean (%)
Place of birth for the foreign-born population - Belize (%)
Place of birth for the foreign-born population - Costa Rica (%)
Place of birth for the foreign-born population - El Salvador (%)
Place of birth for the foreign-born population - Guatemala (%)
Place of birth for the foreign-born population - Honduras (%)
Place of birth for the foreign-born population - Mexico (%)
Place of birth for the foreign-born population - Nicaragua (%)
Place of birth for the foreign-born population - Panama (%)
Place of birth for the foreign-born population - Other Central America (%)
Place of birth for the foreign-born population - Argentina (%)
Place of birth for the foreign-born population - Bolivia (%)
Place of birth for the foreign-born population - Brazil (%)
Place of birth for the foreign-born population - Chile (%)
Place of birth for the foreign-born population - Colombia (%)
Place of birth for the foreign-born population - Ecuador (%)
Place of birth for the foreign-born population - Guyana (%)
Place of birth for the foreign-born population - Peru (%)
Place of birth for the foreign-born population - Uruguay (%)
Place of birth for the foreign-born population - Venezuela (%)
Place of birth for the foreign-born population - Other South America (%)
Place of birth for the foreign-born population - Canada (%)
Place of birth for the foreign-born population - Other Northern America (%)
Place of birth for the foreign-born population - Other (%)
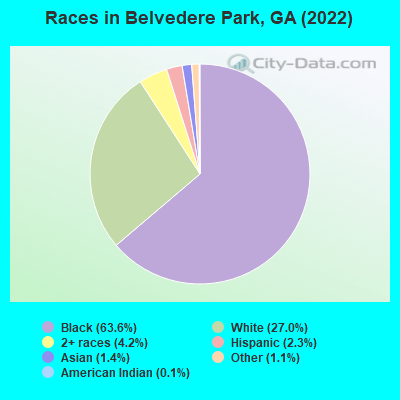
According to 2022 data, the most numerous races in Belvedere Park, GA are White alone (3,939 residents), Black alone (9,277 residents), and Hispanic (342 residents). 93.5% of Belvedere Park residents speak English at home. 7.0% of Belvedere Park, GA residents are foreign-born (4.7% born in Latin America, 0.9% born in Africa), which is 43.7% less than the foreign-born rate of 10.0% across the entire state of Georgia.
Race distribution in Belvedere Park
2000 2022
5,128,661 62.6% White alone 2,331,465 28.5% Black alone 435,227 5.3% Hispanic 171,513 2.1% Asian alone 87,364 1.1% Two or more races 17,670 0.2% American Indian alone 11,275 0.1% Other race alone 3,278 0.04% Native Hawaiian and Other
5,415,657 49.6% White alone 3,349,240 30.7% Black alone 1,132,604 10.4% Hispanic 479,156 4.4% Asian alone 462,923 4.2% Two or more races 54,416 0.5% Other race alone 11,923 0.1% American Indian alone 6,957 0.06% Native Hawaiian and Other
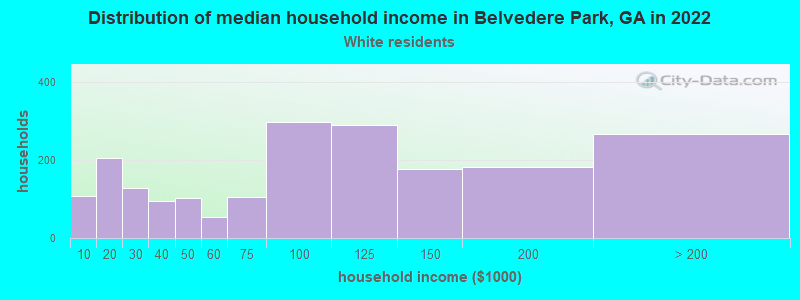
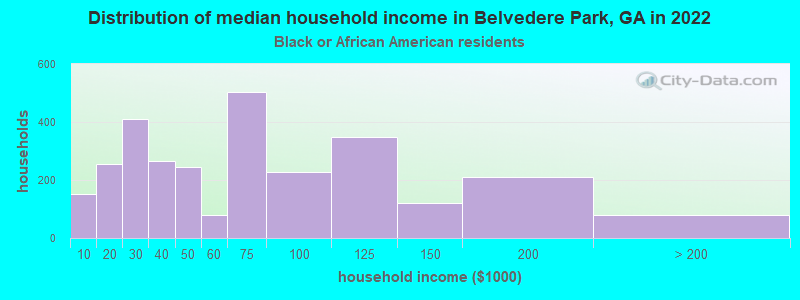
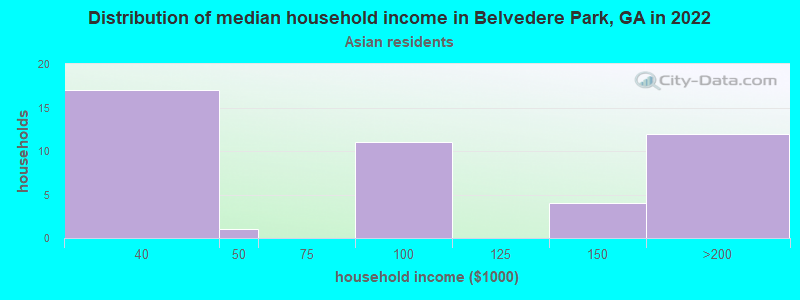
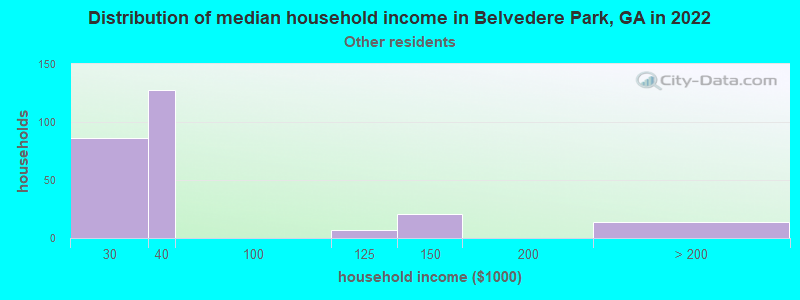
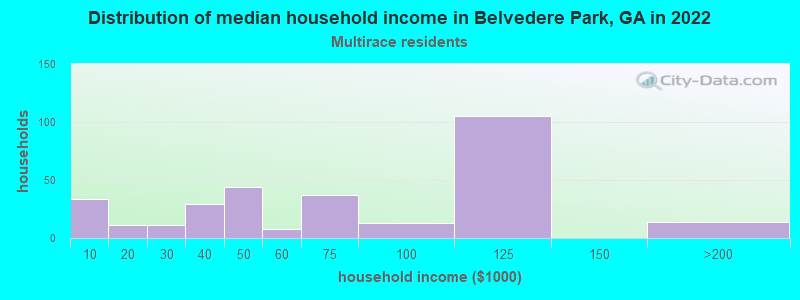
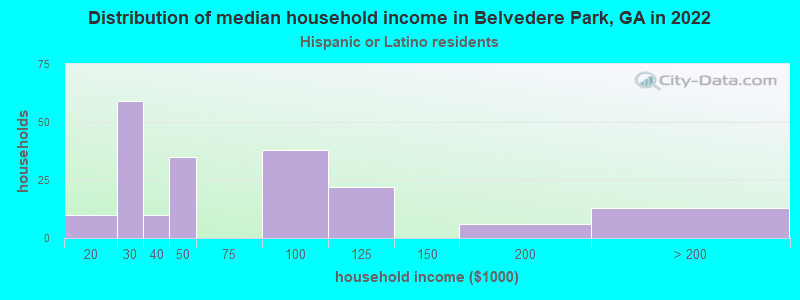
Income and house value in Belvedere Park Median household income in 2022 $92,922 White non-Hispanic householders$53,257 Black householders$64,678 Two or more races householders$46,020 Hispanic or Latino race householdersMedian 2022 house value $318,828 White Non-Hispanic householders$281,109 Black or African American householders$578,232 American Indian or Alaska Native householders $215,636 Asian householders$317,760 Some other race householders$298,901 Hispanic or Latino householders
Median age by race in Belvedere Park
37.7 Median age for White residents34.5 40.8 38.9 Median age for Black or African American residents36.7 45.3 -631,178,706.6 Median age for American Indian / Alaska Native residents-658,914,728.0 -565,432,098.2 33.5 Median age for Asian residents33.1 34.0 -657,243,815.6 Median age for Native Hawaiian / Pacific Islander residents-693,227,090.9 -776,776,776.0 38.0 Median age for Other race residents52.1 30.0 29.6 Median age for Two or more races residents12.2 45.0 37.0 Median age for White alone residents34.0 39.8 46.6 Median age for Hispanic or Latino residents46.8 40.6
Owner/renter occupied households by race in Belvedere Park
House owners and renters - White residents 1,456 73.9% Owner occupied514 26.1% Renter occupiedHouse owners and renters - Black or African American residents 1,693 58.5% Owner occupied1,199 41.5% Renter occupiedHouse owners and renters - American Indian / Alaska Native residents 8 100.0% Renter occupiedHouse owners and renters - Asian residents 33 71.8% Owner occupied13 28.2% Renter occupiedHouse owners and renters - Other race residents 196 88.0% Owner occupied27 12.0% Renter occupiedHouse owners and renters - Two or more races residents 164 59.9% Owner occupied110 40.1% Renter occupiedHouse owners and renters - White alone residents 1,430 73.5% Owner occupied515 26.5% Renter occupiedHouse owners and renters - Hispanic or Latino residents 101 49.4% Owner occupied103 50.6% Renter occupied
Language usage in Belvedere Park
English speakers - Total 93.5% of residents of Belvedere Park speak English at home.
2.8% of residents speak Spanish at home 293 77.9% Speak English very well83 22.1% Speak English less than very well4.1% of residents speak other language at home 438 78.5% Speak English very well120 21.5% Speak English less than very well
English speakers - Born in the United States 94.9% of residents of Belvedere Park speak English at home.
2.9% of residents speak Spanish at home 134 91.2% Speak English very well13 8.8% Speak English less than very well1.7% of residents speak other language at home 87 100.0% Speak English very well
English speakers - Native, born elsewhere 75.9% of residents of Belvedere Park speak English at home.
9.8% of residents speak Spanish at home 7 53.8% Speak English very well6 46.2% Speak English less than very well
English speakers - Foreign-born 52.4% of residents of Belvedere Park speak English at home.
15.2% of residents speak Spanish at home 80 55.6% Speak English very well64 44.4% Speak English less than very well34.3% of residents speak other language at home 212 65.4% Speak English very well112 34.6% Speak English less than very well
White (Caucasian) - Speak only English Native:
97.4% (3,645)Foreign-born:
25.5% (12)
White (Caucasian) - Speak another language Native:
3.1% (116)Foreign-born:
72.8% (34)
Black or African American - Speak only English Native:
97.2% (7,616)Foreign-born:
65.3% (414)
Black or African American - Speak another language Native:
2.7% (209)Foreign-born:
35.5% (225)
Asian - Speak only English Native:
88.5% (93)Foreign-born:
39.2% (41)
Asian - Speak another language Native:
14.9% (16)Foreign-born:
52.4% (55)
Other race - Speak another language Native:
12.5% (40)Foreign-born:
100.0% (198)
Two or more races - Speak only English Native:
95.6% (543)Foreign-born:
72.0% (54)
Two or more races - Speak another language Native:
8.5% (48)Foreign-born:
32.6% (24)
White alone - Speak only English Native:
96.4% (3,582)Foreign-born:
28.0% (12)
White alone - Speak another language Native:
3.3% (123)Foreign-born:
73.1% (33)
Hispanic or Latino - Speak only English Native:
60.4% (85)Foreign-born:
20.8% (34)
Hispanic or Latino - Speak another language Native:
45.9% (65)Foreign-born:
81.8% (134)
Foreign-born residents in Belvedere Park 1,015 residents are foreign born (4.7% Latin America , 0.9% Africa ).
This city:
7.0%Georgia:
10.4%
Marital status for residents in Belvedere Park Marital status - White (Caucasian) population 15 years and over
Males 36.7% Never married47.5% Now married1.4% Separated1.1% Widowed13.3% DivorcedFemales 30.0% Never married41.8% Now married0.6% Separated7.7% Widowed19.9% DivorcedWomen who gave birth in the past 12 months Now married:
91.4% (120)Unmarried:
8.6% (11)
Women who did not give birth in the past 12 months Now married:
46.6% (488)Unmarried:
53.4% (559)
Marital status - Black or African American population 15 years and over
Males 53.2% Never married31.7% Now married4.5% Separated0.8% Widowed9.8% DivorcedFemales 41.4% Never married19.1% Now married3.8% Separated13.0% Widowed22.7% DivorcedWomen who gave birth in the past 12 months Now married:
0.0% (0)Unmarried:
100.0% (111)
Women who did not give birth in the past 12 months Now married:
22.6% (461)Unmarried:
77.4% (1,582)
Marital status - Asian population 15 years and over
Males 56.5% Never married43.5% Now married0.0% Separated0.0% Widowed0.0% DivorcedFemales 0.0% Never married100.0% Now married0.0% Separated0.0% Widowed0.0% DivorcedWomen who gave birth in the past 12 months Now married:
100.0% (11)Unmarried:
0.0% (0)
Women who did not give birth in the past 12 months Now married:
100.0% (77)Unmarried:
0.0% (0)
Marital status - Other race population 15 years and over
Males 82.8% Never married5.9% Now married0.0% Separated0.0% Widowed11.3% DivorcedFemales 34.4% Never married65.6% Now married0.0% Separated0.0% Widowed0.0% DivorcedWomen who did not give birth in the past 12 months Now married:
65.6% (60)Unmarried:
34.4% (31)
Marital status - Two or more races population 15 years and over
Males 65.4% Never married34.6% Now married0.0% Separated0.0% Widowed0.0% DivorcedFemales 46.3% Never married27.5% Now married17.1% Separated4.2% Widowed4.9% DivorcedWomen who did not give birth in the past 12 months Now married:
40.1% (72)Unmarried:
59.9% (107)
Marital status - White alone, not Hispanic / Latino population 15 years and over
Males 36.1% Never married47.6% Now married1.5% Separated1.1% Widowed13.7% DivorcedFemales 29.7% Never married41.8% Now married0.2% Separated7.9% Widowed20.5% DivorcedWomen who gave birth in the past 12 months Now married:
91.4% (126)Unmarried:
8.6% (12)
Women who did not give birth in the past 12 months Now married:
47.2% (505)Unmarried:
52.8% (565)
Marital status - Hispanic or Latino population 15 years and over
Males 37.1% Never married38.9% Now married0.0% Separated6.6% Widowed17.4% DivorcedFemales 52.1% Never married35.2% Now married5.6% Separated0.0% Widowed7.0% DivorcedWomen who did not give birth in the past 12 months Now married:
46.8% (38)Unmarried:
53.2% (44)
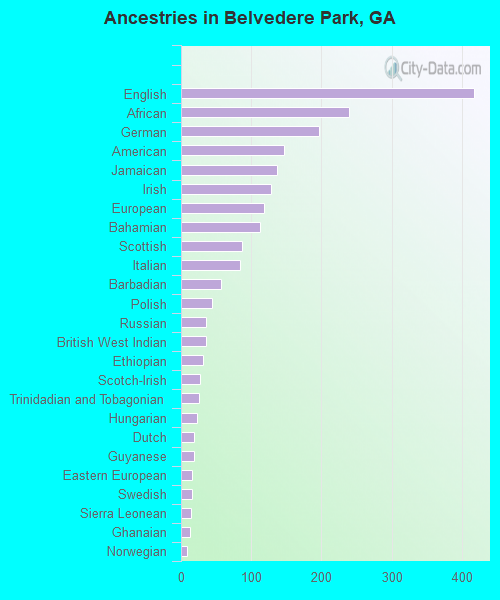
Ancestries in Belvedere Park
418 4.5% English239 2.6% African196 2.1% German147 1.6% American137 1.5% Jamaican128 1.4% Irish118 1.3% European113 1.2% Bahamian87 0.9% Scottish84 0.9% Italian57 0.6% Barbadian44 0.5% Polish35 0.4% Russian35 0.4% British West Indian31 0.3% Ethiopian27 0.3% Scotch-Irish25 0.3% Trinidadian and Tobagonian23 0.2% Hungarian19 0.2% Dutch19 0.2% Guyanese15 0.2% Eastern European15 0.2% Swedish14 0.2% Sierra Leonean13 0.1% Ghanaian9 0.10% Norwegian6 0.06% British6 0.06% Welsh2 0.02% French
Children Nativity (place of birth) in Belvedere Park
Children under 6 years - Living with two parents Both parents native 344 100.0% NativeBoth parents foreign-born 42 100.0% NativeChildren under 6 years - Living with one parent Native parent 656 100.0% NativeChildren 6 to 17 years - Living with two parents Both parents native 552 100.0% NativeBoth parents foreign-born 33 100.0% NativeOne native, one foreign-born parent 50 100.0% NativeChildren 6 to 17 years - Living with one parent Native parent 913 100.0% NativeForeign-born parent 22 46.0% Native26 54.0% Foreign-born
Grandparents responsible for own grandchildren in Belvedere Park
Grandparents (30 to 59 years) Black or African American 17 21.5% Responsible for grandchildren63 78.5% Not responsible for grandchildrenTwo or more races 41 100.0% Responsible for grandchildrenGrandparents (60 years and over) Black or African American 27 24.4% Responsible for grandchildren85 75.6% Not responsible for grandchildrenTwo or more races 24 100.0% Not responsible for grandchildren