Races in Bee Ridge, Florida (FL) Detailed Stats
Data:
Races - White alone (%)
Races - White alone (% change since 2000)
Races - Black alone (%)
Races - Black alone (% change since 2000)
Races - American Indian alone (%)
Races - American Indian alone (% change since 2000)
Races - Asian alone (%)
Races - Asian alone (% change since 2000)
Races - Hispanic (%)
Races - Hispanic (% change since 2000)
Races - Native Hawaiian and Other Pacific Islander alone (%)
Races - Native Hawaiian and Other Pacific Islander alone (% change since 2000)
Races - Two or more races(%)
Races - Two or more races(% change since 2000)
Races - Other race alone (%)
Races - Other race alone (% change since 2000)
Racial diversity
Place of birth - Born in state of residence (%)
Place of birth - Born in state of residence (%) - White
Place of birth - Born in state of residence (%) - Black or African American
Place of birth - Born in state of residence (%) - Asian
Place of birth - Born in state of residence (%) - Hispanic or Latino
Place of birth - Born in state of residence (%) - American Indian and Alaska Native
Place of birth - Born in state of residence (%) - Multirace
Place of birth - Born in state of residence (%) - Other Race
Place of birth - Born in other state (%)
Place of birth - Born in other state (%) - White
Place of birth - Born in other state (%) - Black or African American
Place of birth - Born in other state (%) - Asian
Place of birth - Born in other state (%) - Hispanic or Latino
Place of birth - Born in other state (%) - American Indian and Alaska Native
Place of birth - Born in other state (%) - Multirace
Place of birth - Born in other state (%) - Other Race
Place of birth - Native, outside of US (%)
Place of birth - Native, outside of US (%) - White
Place of birth - Native, outside of US (%) - Black or African American
Place of birth - Native, outside of US (%) - Asian
Place of birth - Native, outside of US (%) - Hispanic or Latino
Place of birth - Native, outside of US (%) - American Indian and Alaska Native
Place of birth - Native, outside of US (%) - Multirace
Place of birth - Native, outside of US (%) - Other Race
Place of birth - Foreign born (%)
Place of birth - Foreign born (%) - White
Place of birth - Foreign born (%) - Black or African American
Place of birth - Foreign born (%) - Asian
Place of birth - Foreign born (%) - Hispanic or Latino
Place of birth - Foreign born (%) - American Indian and Alaska Native
Place of birth - Foreign born (%) - Multirace
Place of birth - Foreign born (%) - Other Race
Residents speaking English at home (%)
Residents speaking English at home - Born in the United States (%)
Residents speaking English at home - Native, born elsewhere (%)
Residents speaking English at home - Foreign born (%)
Residents speaking Spanish at home (%)
Residents speaking Spanish at home - Born in the United States (%)
Residents speaking Spanish at home - Native, born elsewhere (%)
Residents speaking Spanish at home - Foreign born (%)
Residents speaking other language at home (%)
Residents speaking other language at home - Born in the United States (%)
Residents speaking other language at home - Native, born elsewhere (%)
Residents speaking other language at home - Foreign born (%)
Marital status - Never married (%)
Marital status - Now married (%)
Marital status - Separated (%)
Marital status - Widowed (%)
Marital status - Divorced (%)
Ancestries Reported - Arab (%)
Ancestries Reported - Czech (%)
Ancestries Reported - Danish (%)
Ancestries Reported - Dutch (%)
Ancestries Reported - English (%)
Ancestries Reported - French (%)
Ancestries Reported - French Canadian (%)
Ancestries Reported - German (%)
Ancestries Reported - Greek (%)
Ancestries Reported - Hungarian (%)
Ancestries Reported - Irish (%)
Ancestries Reported - Italian (%)
Ancestries Reported - Lithuanian (%)
Ancestries Reported - Norwegian (%)
Ancestries Reported - Polish (%)
Ancestries Reported - Portuguese (%)
Ancestries Reported - Russian (%)
Ancestries Reported - Scotch-Irish (%)
Ancestries Reported - Scottish (%)
Ancestries Reported - Slovak (%)
Ancestries Reported - Subsaharan African (%)
Ancestries Reported - Swedish (%)
Ancestries Reported - Swiss (%)
Ancestries Reported - Ukrainian (%)
Ancestries Reported - United States (%)
Ancestries Reported - Welsh (%)
Ancestries Reported - West Indian (%)
Ancestries Reported - Other (%)
Geographical mobility - Same house 1 year ago (%)
Geographical mobility - Same house 1 year ago (%) - White
Geographical mobility - Same house 1 year ago (%) - Black or African American
Geographical mobility - Same house 1 year ago (%) - Asian
Geographical mobility - Same house 1 year ago (%) - Hispanic or Latino
Geographical mobility - Same house 1 year ago (%) - American Indian and Alaska Native
Geographical mobility - Same house 1 year ago (%) - Multirace
Geographical mobility - Same house 1 year ago (%) - Other Race
Geographical mobility - Moved within same county (%)
Geographical mobility - Moved within same county (%) - White
Geographical mobility - Moved within same county (%) - Black or African American
Geographical mobility - Moved within same county (%) - Asian
Geographical mobility - Moved within same county (%) - Hispanic or Latino
Geographical mobility - Moved within same county (%) - American Indian and Alaska Native
Geographical mobility - Moved within same county (%) - Multirace
Geographical mobility - Moved within same county (%) - Other Race
Geographical mobility - Moved from different county within same state (%)
Geographical mobility - Moved from different county within same state (%) - White
Geographical mobility - Moved from different county within same state (%) - Black or African American
Geographical mobility - Moved from different county within same state (%) - Asian
Geographical mobility - Moved from different county within same state (%) - Hispanic or Latino
Geographical mobility - Moved from different county within same state (%) - American Indian and Alaska Native
Geographical mobility - Moved from different county within same state (%) - Multirace
Geographical mobility - Moved from different county within same state (%) - Other Race
Geographical mobility - Moved from different state (%)
Geographical mobility - Moved from different state (%) - White
Geographical mobility - Moved from different state (%) - Black or African American
Geographical mobility - Moved from different state (%) - Asian
Geographical mobility - Moved from different state (%) - Hispanic or Latino
Geographical mobility - Moved from different state (%) - American Indian and Alaska Native
Geographical mobility - Moved from different state (%) - Multirace
Geographical mobility - Moved from different state (%) - Other Race
Geographical mobility - Moved from abroad (%)
Geographical mobility - Moved from abroad (%) - White
Geographical mobility - Moved from abroad (%) - Black or African American
Geographical mobility - Moved from abroad (%) - Asian
Geographical mobility - Moved from abroad (%) - Hispanic or Latino
Geographical mobility - Moved from abroad (%) - American Indian and Alaska Native
Geographical mobility - Moved from abroad (%) - Multirace
Geographical mobility - Moved from abroad (%) - Other Race
Place of birth for the foreign-born population - Ireland (%)
Place of birth for the foreign-born population - Denmark (%)
Place of birth for the foreign-born population - Norway (%)
Place of birth for the foreign-born population - Sweden (%)
Place of birth for the foreign-born population - United Kingdom (%)
Place of birth for the foreign-born population - England (%)
Place of birth for the foreign-born population - Scotland (%)
Place of birth for the foreign-born population - Other Northern Europe (%)
Place of birth for the foreign-born population - Austria (%)
Place of birth for the foreign-born population - Belgium (%)
Place of birth for the foreign-born population - France (%)
Place of birth for the foreign-born population - Germany (%)
Place of birth for the foreign-born population - Netherlands (%)
Place of birth for the foreign-born population - Switzerland (%)
Place of birth for the foreign-born population - Other Western Europe (%)
Place of birth for the foreign-born population - Greece (%)
Place of birth for the foreign-born population - Italy (%)
Place of birth for the foreign-born population - Portugal (%)
Place of birth for the foreign-born population - Spain (%)
Place of birth for the foreign-born population - Other Southern Europe (%)
Place of birth for the foreign-born population - Albania (%)
Place of birth for the foreign-born population - Belarus (%)
Place of birth for the foreign-born population - Bosnia and Herzegovina (%)
Place of birth for the foreign-born population - Bulgaria (%)
Place of birth for the foreign-born population - Croatia (%)
Place of birth for the foreign-born population - Czechoslovakia (%)
Place of birth for the foreign-born population - Hungary (%)
Place of birth for the foreign-born population - Latvia (%)
Place of birth for the foreign-born population - Lithuania (%)
Place of birth for the foreign-born population - North Macedonia (Macedonia) (%)
Place of birth for the foreign-born population - Moldova (%)
Place of birth for the foreign-born population - Poland (%)
Place of birth for the foreign-born population - Romania (%)
Place of birth for the foreign-born population - Russia (%)
Place of birth for the foreign-born population - Serbia (%)
Place of birth for the foreign-born population - Ukraine (%)
Place of birth for the foreign-born population - Other Eastern Europe (%)
Place of birth for the foreign-born population - China (%)
Place of birth for the foreign-born population - Hong Kong (%)
Place of birth for the foreign-born population - Taiwan (%)
Place of birth for the foreign-born population - Japan (%)
Place of birth for the foreign-born population - Korea (%)
Place of birth for the foreign-born population - Other Eastern Asia (%)
Place of birth for the foreign-born population - Afghanistan (%)
Place of birth for the foreign-born population - Bangladesh (%)
Place of birth for the foreign-born population - India (%)
Place of birth for the foreign-born population - Iran (%)
Place of birth for the foreign-born population - Kazakhstan (%)
Place of birth for the foreign-born population - Nepal (%)
Place of birth for the foreign-born population - Pakistan (%)
Place of birth for the foreign-born population - Sri Lanka (%)
Place of birth for the foreign-born population - Uzbekistan (%)
Place of birth for the foreign-born population - Other South Central Asia (%)
Place of birth for the foreign-born population - Burma (%)
Place of birth for the foreign-born population - Cambodia (%)
Place of birth for the foreign-born population - Indonesia (%)
Place of birth for the foreign-born population - Laos (%)
Place of birth for the foreign-born population - Malaysia (%)
Place of birth for the foreign-born population - Philippines (%)
Place of birth for the foreign-born population - Singapore (%)
Place of birth for the foreign-born population - Thailand (%)
Place of birth for the foreign-born population - Vietnam (%)
Place of birth for the foreign-born population - Other South Eastern Asia (%)
Place of birth for the foreign-born population - Armenia (%)
Place of birth for the foreign-born population - Iraq (%)
Place of birth for the foreign-born population - Israel (%)
Place of birth for the foreign-born population - Jordan (%)
Place of birth for the foreign-born population - Kuwait (%)
Place of birth for the foreign-born population - Lebanon (%)
Place of birth for the foreign-born population - Saudi Arabia (%)
Place of birth for the foreign-born population - Syria (%)
Place of birth for the foreign-born population - Turkey (%)
Place of birth for the foreign-born population - Yemen (%)
Place of birth for the foreign-born population - Other Western Asia (%)
Place of birth for the foreign-born population - Eritrea (%)
Place of birth for the foreign-born population - Ethiopia (%)
Place of birth for the foreign-born population - Kenya (%)
Place of birth for the foreign-born population - Somalia (%)
Place of birth for the foreign-born population - Uganda (%)
Place of birth for the foreign-born population - Zimbabwe (%)
Place of birth for the foreign-born population - Other Eastern Africa (%)
Place of birth for the foreign-born population - Cameroon (%)
Place of birth for the foreign-born population - Congo (%)
Place of birth for the foreign-born population - Democratic Republic of Congo (Zaire) (%)
Place of birth for the foreign-born population - Other Middle Africa (%)
Place of birth for the foreign-born population - Egypt (%)
Place of birth for the foreign-born population - Morocco (%)
Place of birth for the foreign-born population - Sudan (%)
Place of birth for the foreign-born population - Other Northern Africa (%)
Place of birth for the foreign-born population - South Africa (%)
Place of birth for the foreign-born population - Other Southern Africa (%)
Place of birth for the foreign-born population - Cabo Verde (%)
Place of birth for the foreign-born population - Ghana (%)
Place of birth for the foreign-born population - Liberia (%)
Place of birth for the foreign-born population - Nigeria (%)
Place of birth for the foreign-born population - Senegal (%)
Place of birth for the foreign-born population - Sierra Leone (%)
Place of birth for the foreign-born population - Other Western Africa (%)
Place of birth for the foreign-born population - Australia (%)
Place of birth for the foreign-born population - New Zealand (%)
Place of birth for the foreign-born population - Fiji (%)
Place of birth for the foreign-born population - Micronesia (%)
Place of birth for the foreign-born population - Bahamas (%)
Place of birth for the foreign-born population - Barbados (%)
Place of birth for the foreign-born population - Cuba (%)
Place of birth for the foreign-born population - Dominica (%)
Place of birth for the foreign-born population - Dominican Republic (%)
Place of birth for the foreign-born population - Grenada (%)
Place of birth for the foreign-born population - Haiti (%)
Place of birth for the foreign-born population - Jamaica (%)
Place of birth for the foreign-born population - St. Vincent and the Grenadines (%)
Place of birth for the foreign-born population - Trinidad and Tobago (%)
Place of birth for the foreign-born population - West Indies (%)
Place of birth for the foreign-born population - Other Caribbean (%)
Place of birth for the foreign-born population - Belize (%)
Place of birth for the foreign-born population - Costa Rica (%)
Place of birth for the foreign-born population - El Salvador (%)
Place of birth for the foreign-born population - Guatemala (%)
Place of birth for the foreign-born population - Honduras (%)
Place of birth for the foreign-born population - Mexico (%)
Place of birth for the foreign-born population - Nicaragua (%)
Place of birth for the foreign-born population - Panama (%)
Place of birth for the foreign-born population - Other Central America (%)
Place of birth for the foreign-born population - Argentina (%)
Place of birth for the foreign-born population - Bolivia (%)
Place of birth for the foreign-born population - Brazil (%)
Place of birth for the foreign-born population - Chile (%)
Place of birth for the foreign-born population - Colombia (%)
Place of birth for the foreign-born population - Ecuador (%)
Place of birth for the foreign-born population - Guyana (%)
Place of birth for the foreign-born population - Peru (%)
Place of birth for the foreign-born population - Uruguay (%)
Place of birth for the foreign-born population - Venezuela (%)
Place of birth for the foreign-born population - Other South America (%)
Place of birth for the foreign-born population - Canada (%)
Place of birth for the foreign-born population - Other Northern America (%)
Place of birth for the foreign-born population - Other (%)
Beertopia, Parrish Heritage Days, Art in the Park, Gamble Plantation Open House & more, all this weekend! (2 replies)Sarasota & Manatee Counties news thread (5141 replies)Der Dutchman, Owen’s Fish Camp, Nicky’s On Palm: Restaurant News (278 replies)If You Are Thinking of Moving to the Sarasota Area, DON'T!!! (75 replies)North of Bee Ridge Rd and South of Palmer Blvd (6 replies)Art Festivals, Italian Festival, Rowing Regatta, Chili Cook Off, Baseball & more, all this weekend! (1 reply)
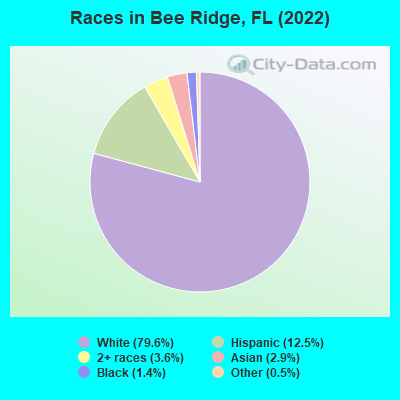
According to 2022 data, the most numerous races in Bee Ridge, FL are White alone (8,434 residents), Hispanic (1,320 residents), and Black alone (152 residents). 85.4% of Bee Ridge residents speak English at home. 14.3% of Bee Ridge, FL residents are foreign-born (5.6% born in Latin America, 5.2% born in Europe, 2.9% born in Asia), which is 47.2% less than the foreign-born rate of 21.0% across the entire state of Florida.
Race distribution in Bee Ridge
2000 2022
10,458,509 65.4% White alone 2,682,715 16.8% Hispanic 2,264,268 14.2% Black alone 261,693 1.6% Asian alone 236,954 1.5% Two or more races 42,358 0.3% American Indian alone 28,994 0.2% Other race alone 6,887 0.04% Native Hawaiian and Other
11,309,403 50.8% White alone 6,025,039 27.1% Hispanic 3,241,015 14.6% Black alone 861,630 3.9% Two or more races 623,692 2.8% Asian alone 152,054 0.7% Other race alone 22,504 0.1% American Indian alone 9,486 0.04% Native Hawaiian and Other
Income and house value in Bee Ridge Median household income in 2022 $81,265 White non-Hispanic householders$82,022 Black householders$72,899 Asian householders$61,992 Some other race householders$71,438 Two or more races householders$51,022 Hispanic or Latino race householdersMedian 2022 house value $409,612 White Non-Hispanic householders$547,805 Black or African American householders $474,764 Asian householders$600,687 Two or more races householders$290,409 Hispanic or Latino householders
Median age by race in Bee Ridge
57.9 Median age for White residents56.9 60.4 57.0 Median age for Black or African American residents41.0 50.3 -1,274,161,734.4 Median age for American Indian / Alaska Native residents-856,941,507.2 -594,925,633.7 36.6 Median age for Asian residents15.5 36.6 -679,849,340.2 Median age for Native Hawaiian / Pacific Islander residents-858,307,848.3 -443,298,968.6 42.1 Median age for Other race residents52.7 47.6 13.5 Median age for Two or more races residents18.7 13.4 59.1 Median age for White alone residents56.4 62.7 45.0 Median age for Hispanic or Latino residents52.8 41.9
Owner/renter occupied households by race in Bee Ridge
House owners and renters - White residents 3,458 76.5% Owner occupied1,064 23.5% Renter occupiedHouse owners and renters - Black or African American residents 74 77.7% Owner occupied21 22.3% Renter occupiedHouse owners and renters - Asian residents 65 86.6% Owner occupied10 13.4% Renter occupiedHouse owners and renters - Other race residents 82 61.3% Owner occupied52 38.7% Renter occupiedHouse owners and renters - Two or more races residents 180 95.1% Owner occupied9 4.9% Renter occupiedHouse owners and renters - White alone residents 3,290 78.3% Owner occupied914 21.7% Renter occupiedHouse owners and renters - Hispanic or Latino residents 312 55.9% Owner occupied246 44.1% Renter occupied
Language usage in Bee Ridge
English speakers - Total 85.4% of residents of Bee Ridge speak English at home.
5.8% of residents speak Spanish at home 323 55.0% Speak English very well264 45.0% Speak English less than very well9.2% of residents speak other language at home 420 44.7% Speak English very well519 55.3% Speak English less than very well
English speakers - Born in the United States 97.6% of residents of Bee Ridge speak English at home.
1.0% of residents speak Spanish at home 60 100.0% Speak English less than very well1.6% of residents speak other language at home 96 100.0% Speak English very well
English speakers - Native, born elsewhere 14.4% of residents of Bee Ridge speak English at home.
37.3% of residents speak Spanish at home 44 100.0% Speak English very well38.1% of residents speak other language at home 45 100.0% Speak English very well
English speakers - Foreign-born 30.6% of residents of Bee Ridge speak English at home.
23.6% of residents speak Spanish at home 181 44.7% Speak English very well224 55.3% Speak English less than very well46.3% of residents speak other language at home 268 33.7% Speak English very well528 66.3% Speak English less than very well
White (Caucasian) - Speak only English Native:
96.8% (7,516)Foreign-born:
33.5% (322)
White (Caucasian) - Speak another language Native:
3.2% (249)Foreign-born:
66.7% (640)
Black or African American - Speak only English Native:
92.6% (108)Foreign-born:
20.3% (20)
Other race - Speak only English Native:
87.7% (327)Foreign-born:
32.8% (16)
Other race - Speak another language Native:
15.7% (59)Foreign-born:
70.3% (33)
White alone - Speak only English Native:
97.6% (7,364)Foreign-born:
31.0% (229)
White alone - Speak another language Native:
2.4% (183)Foreign-born:
72.1% (534)
Hispanic or Latino - Speak only English Native:
80.4% (501)Foreign-born:
16.9% (90)
Hispanic or Latino - Speak another language Native:
24.2% (151)Foreign-born:
75.7% (402)
Foreign-born residents in Bee Ridge 1,511 residents are foreign born (5.6% Latin America , 5.2% Europe , 2.9% Asia ).
This city:
14.3%Florida:
21.1%
Marital status for residents in Bee Ridge Marital status - White (Caucasian) population 15 years and over
Males 20.3% Never married61.8% Now married1.0% Separated4.0% Widowed12.9% DivorcedFemales 18.3% Never married45.2% Now married0.5% Separated19.4% Widowed16.5% DivorcedWomen who gave birth in the past 12 months Now married:
42.6% (25)Unmarried:
57.4% (34)
Women who did not give birth in the past 12 months Now married:
47.7% (621)Unmarried:
52.3% (682)
Marital status - Black or African American population 15 years and over
Males 0.0% Never married100.0% Now married0.0% Separated0.0% Widowed0.0% DivorcedFemales 19.8% Never married67.4% Now married0.0% Separated0.0% Widowed12.8% DivorcedWomen who did not give birth in the past 12 months Now married:
77.3% (58)Unmarried:
22.7% (17)
Marital status - Asian population 15 years and over
Males 0.0% Never married100.0% Now married0.0% Separated0.0% Widowed0.0% DivorcedFemales 11.2% Never married83.2% Now married0.0% Separated0.0% Widowed5.6% DivorcedWomen who did not give birth in the past 12 months Now married:
85.7% (75)Unmarried:
14.3% (12)
Marital status - Other race population 15 years and over
Males 41.9% Never married32.3% Now married0.0% Separated0.0% Widowed25.8% DivorcedFemales 0.0% Never married100.0% Now married0.0% Separated0.0% Widowed0.0% DivorcedWomen who did not give birth in the past 12 months Now married:
100.0% (43)Unmarried:
0.0% (0)
Marital status - Two or more races population 15 years and over
Males 8.9% Never married86.6% Now married0.0% Separated0.0% Widowed4.5% DivorcedFemales 0.0% Never married100.0% Now married0.0% Separated0.0% Widowed0.0% DivorcedWomen who did not give birth in the past 12 months Now married:
100.0% (13)Unmarried:
0.0% (0)
Marital status - White alone, not Hispanic / Latino population 15 years and over
Males 21.9% Never married59.4% Now married1.1% Separated3.7% Widowed14.0% DivorcedFemales 15.9% Never married46.3% Now married0.6% Separated19.1% Widowed18.1% DivorcedWomen who gave birth in the past 12 months Now married:
42.6% (27)Unmarried:
57.4% (36)
Women who did not give birth in the past 12 months Now married:
51.2% (566)Unmarried:
48.8% (541)
Marital status - Hispanic or Latino population 15 years and over
Males 13.0% Never married74.7% Now married0.0% Separated4.2% Widowed8.0% DivorcedFemales 39.6% Never married42.1% Now married0.0% Separated18.2% Widowed0.0% DivorcedWomen who did not give birth in the past 12 months Now married:
41.7% (144)Unmarried:
58.3% (201)
Ancestries in Bee Ridge
1,503 28.0% American637 11.9% English473 8.8% German444 8.3% Italian247 4.6% Irish192 3.6% Lithuanian155 2.9% Polish73 1.4% Haitian71 1.3% Ukrainian55 1.0% Canadian42 0.8% Scotch-Irish41 0.8% Austrian39 0.7% Danish33 0.6% Slovak29 0.5% European27 0.5% Lebanese27 0.5% Greek26 0.5% Dutch25 0.5% Norwegian19 0.4% Swiss17 0.3% Eastern European17 0.3% Serbian16 0.3% French15 0.3% Swedish14 0.3% French Canadian14 0.3% Russian13 0.2% British13 0.2% Hungarian10 0.2% Jordanian10 0.2% Scottish
Children Nativity (place of birth) in Bee Ridge
Children under 6 years - Living with two parents Both parents native 169 100.0% NativeBoth parents foreign-born 33 100.0% NativeOne native, one foreign-born parent 41 100.0% NativeChildren under 6 years - Living with one parent Native parent 197 100.0% NativeChildren 6 to 17 years - Living with two parents Both parents native 397 98.2% Native7 1.8% Foreign-bornBoth parents foreign-born 8 100.0% Foreign-bornOne native, one foreign-born parent 249 72.6% Native94 27.4% Foreign-bornChildren 6 to 17 years - Living with one parent Native parent 295 89.6% Native34 10.4% Foreign-bornForeign-born parent 24 100.0% Native
Grandparents responsible for own grandchildren in Bee Ridge
Grandparents (30 to 59 years) White / Caucasian 99 82.3% Responsible for grandchildren21 17.7% Not responsible for grandchildrenWhite alone, not Hispanic / Latino 56 69.0% Responsible for grandchildren25 31.0% Not responsible for grandchildrenHispanic or Latino 75 100.0% Responsible for grandchildren
Grandparents (60 years and over)