Races in Bedford, New Hampshire (NH) Detailed Stats
Ancestries, Foreign-born residents, place of birth

Recent posts about races in Bedford, New Hampshire on our local forum with over 2,400,000 registered users:
 | Bedford for Families (11 replies) |
| Londonderry vs Bedford (8 replies) |
| Best family towns for Boston Commute (5 replies) |
| Buying a Home in Nashua/Bedford/Hollis or MA (12 replies) |
| Okay, I sold my house...now what? (10 replies) |
| Another "Which place is better" inquiry! Bedford or Durham (18 replies) |
Latest news about races in Bedford, NH collected exclusively by city-data.com from local newspapers, TV, and radio stations
3.3% of Bedford, NH residents are foreign-born (1.2% born in Europe, 1.1% born in North America, 0.7% born in Asia), which is 49.5% less than the foreign-born rate of 5.0% across the entire state of New Hampshire.
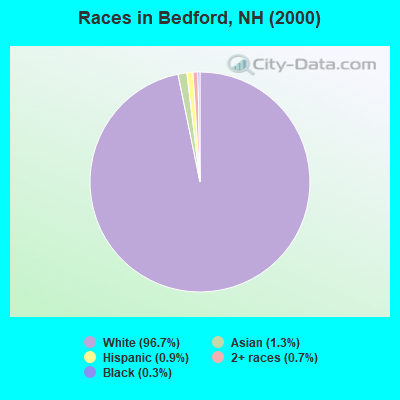
Race distribution in Bedford

- 17,66996.7%White alone
- 2321.3%Asian alone
- 1650.9%Hispanic
- 1330.7%Two or more races
- 560.3%Black alone
- 110.06%American Indian alone
- 40.02%Other race alone
- 40.02%Native Hawaiian and Other
Pacific Islander alone
2000
2022
-
- 1,175,25295.1%White alone
- 20,4891.7%Hispanic
- 15,8031.3%Asian alone
- 11,6060.9%Two or more races
- 8,3540.7%Black alone
- 2,6980.2%American Indian alone
- 1,2540.1%Other race alone
- 3300.03%Native Hawaiian and Other
Pacific Islander alone

-
- 1,208,10186.6%White alone
- 63,4794.5%Hispanic
- 60,7244.4%Two or more races
- 36,5192.6%Asian alone
- 17,9311.3%Black alone
- 6,6150.5%Other race alone
- 1,0140.07%American Indian alone
- 8480.06%Native Hawaiian and Other
Pacific Islander alone

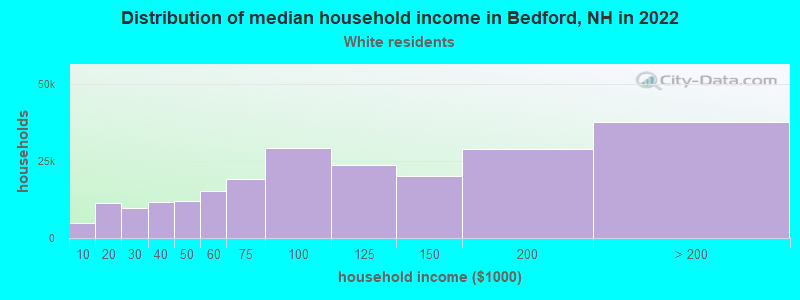
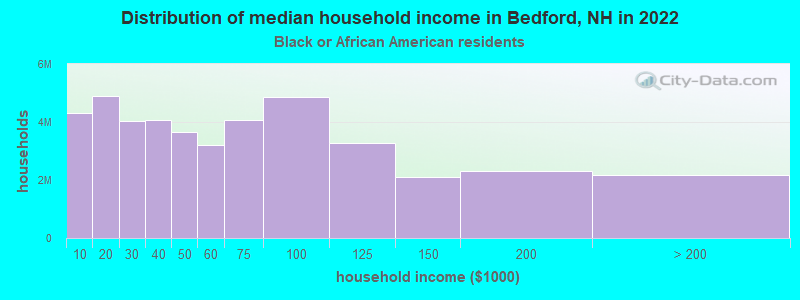
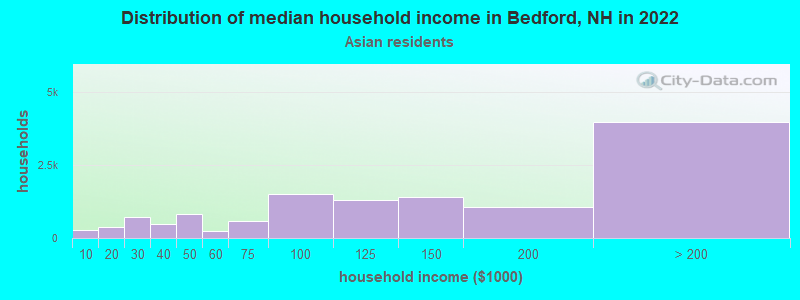
Income and house value in Bedford
- Median household income in 2022
- $154,163White non-Hispanic householders
- $120,981Black householders
- $120,991Asian householders
- $105,006Two or more races householders
- $131,761Hispanic or Latino race householders
- Median 2022 house value
- $658,315White Non-Hispanic householders
- $488,699Black or African American householders
- $614,107Asian householders
- $687,487Two or more races householders
- $568,695Hispanic or Latino householders
Household income for White non-Hispanic householders
Household income for Black householders
Household income for Asian householders
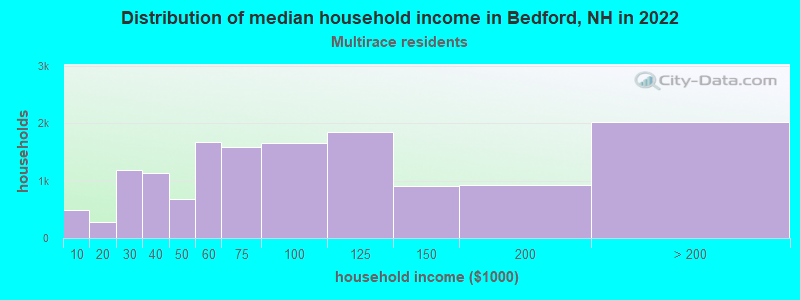
Household income for Two or more races householders
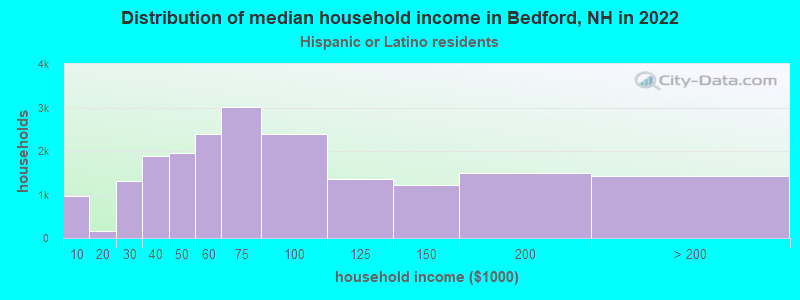
Household income for Hispanic or Latino race householders
Foreign-born residents in Bedford
611 residents are foreign born (1.2% Europe, 1.1% North America, 0.7% Asia).
| This city: | 3.3% |
| New Hampshire: | 4.4% |
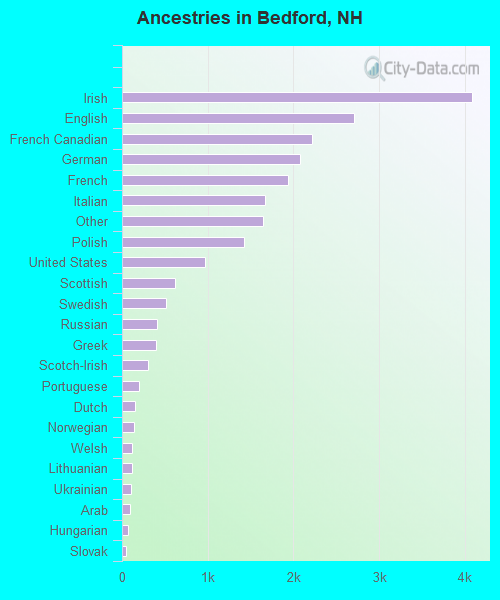
Ancestries in Bedford

- 4,07718.5%Irish
- 2,70912.3%English
- 2,22210.1%French Canadian
- 2,0749.4%German
- 1,9368.8%French
- 1,6707.6%Italian
- 1,6477.5%Other
- 1,4196.4%Polish
- 9694.4%United States
- 6152.8%Scottish
- 5162.3%Swedish
- 4031.8%Russian
- 3991.8%Greek
- 2991.4%Scotch-Irish
- 1940.9%Portuguese
- 1510.7%Dutch
- 1380.6%Norwegian
- 1130.5%Welsh
- 1120.5%Lithuanian
- 1040.5%Ukrainian
- 880.4%Arab
- 660.3%Hungarian
- 510.2%Slovak
- 300.1%Subsaharan African
- 280.1%Czech
- 270.1%Danish
- 110.05%West Indian
- 100.05%Swiss
Zip codes: 03110.