Races in Baywood, New York (NY) Detailed Stats
Data:
Races - White alone (%)
Races - White alone (% change since 2000)
Races - Black alone (%)
Races - Black alone (% change since 2000)
Races - American Indian alone (%)
Races - American Indian alone (% change since 2000)
Races - Asian alone (%)
Races - Asian alone (% change since 2000)
Races - Hispanic (%)
Races - Hispanic (% change since 2000)
Races - Native Hawaiian and Other Pacific Islander alone (%)
Races - Native Hawaiian and Other Pacific Islander alone (% change since 2000)
Races - Two or more races(%)
Races - Two or more races(% change since 2000)
Races - Other race alone (%)
Races - Other race alone (% change since 2000)
Racial diversity
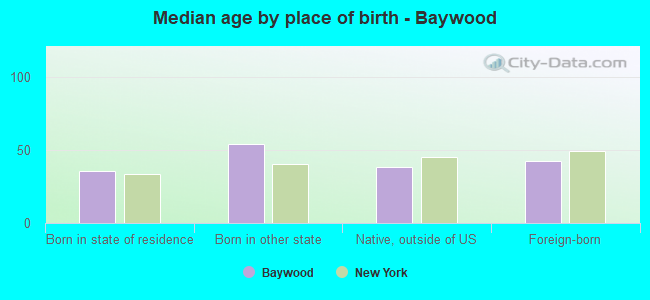
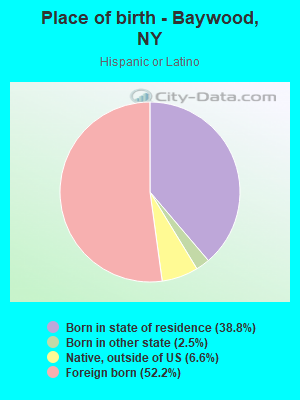
Place of birth - Born in state of residence (%)
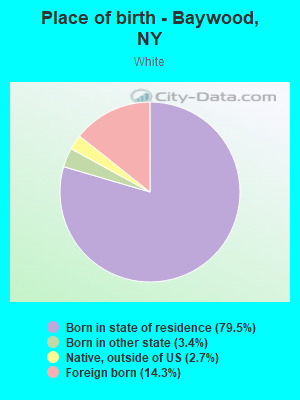
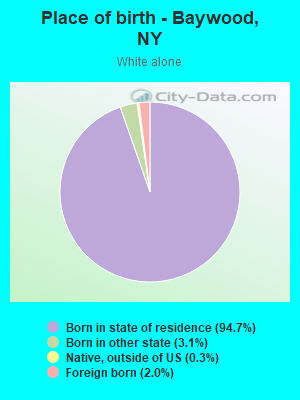
Place of birth - Born in state of residence (%) - White
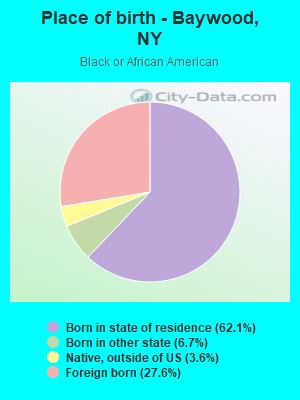
Place of birth - Born in state of residence (%) - Black or African American
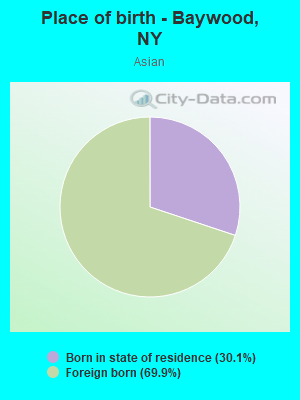
Place of birth - Born in state of residence (%) - Asian
Place of birth - Born in state of residence (%) - Hispanic or Latino
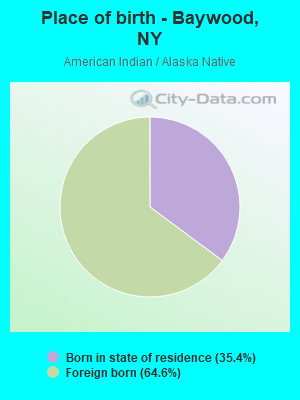
Place of birth - Born in state of residence (%) - American Indian and Alaska Native
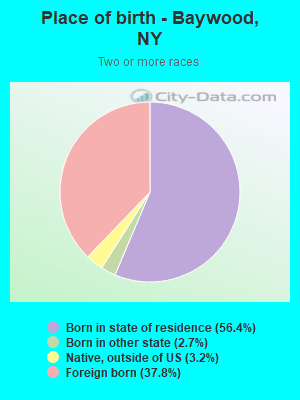
Place of birth - Born in state of residence (%) - Multirace
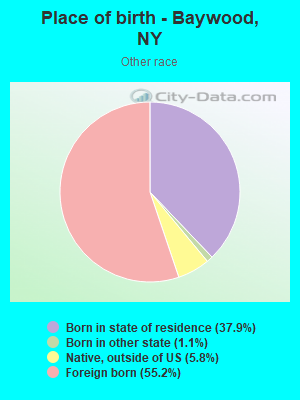
Place of birth - Born in state of residence (%) - Other Race
Place of birth - Born in other state (%)
Place of birth - Born in other state (%) - White
Place of birth - Born in other state (%) - Black or African American
Place of birth - Born in other state (%) - Asian
Place of birth - Born in other state (%) - Hispanic or Latino
Place of birth - Born in other state (%) - American Indian and Alaska Native
Place of birth - Born in other state (%) - Multirace
Place of birth - Born in other state (%) - Other Race
Place of birth - Native, outside of US (%)
Place of birth - Native, outside of US (%) - White
Place of birth - Native, outside of US (%) - Black or African American
Place of birth - Native, outside of US (%) - Asian
Place of birth - Native, outside of US (%) - Hispanic or Latino
Place of birth - Native, outside of US (%) - American Indian and Alaska Native
Place of birth - Native, outside of US (%) - Multirace
Place of birth - Native, outside of US (%) - Other Race
Place of birth - Foreign born (%)
Place of birth - Foreign born (%) - White
Place of birth - Foreign born (%) - Black or African American
Place of birth - Foreign born (%) - Asian
Place of birth - Foreign born (%) - Hispanic or Latino
Place of birth - Foreign born (%) - American Indian and Alaska Native
Place of birth - Foreign born (%) - Multirace
Place of birth - Foreign born (%) - Other Race
Residents speaking English at home (%)
Residents speaking English at home - Born in the United States (%)
Residents speaking English at home - Native, born elsewhere (%)
Residents speaking English at home - Foreign born (%)
Residents speaking Spanish at home (%)
Residents speaking Spanish at home - Born in the United States (%)
Residents speaking Spanish at home - Native, born elsewhere (%)
Residents speaking Spanish at home - Foreign born (%)
Residents speaking other language at home (%)
Residents speaking other language at home - Born in the United States (%)
Residents speaking other language at home - Native, born elsewhere (%)
Residents speaking other language at home - Foreign born (%)
Marital status - Never married (%)
Marital status - Now married (%)
Marital status - Separated (%)
Marital status - Widowed (%)
Marital status - Divorced (%)
Ancestries Reported - Arab (%)
Ancestries Reported - Czech (%)
Ancestries Reported - Danish (%)
Ancestries Reported - Dutch (%)
Ancestries Reported - English (%)
Ancestries Reported - French (%)
Ancestries Reported - French Canadian (%)
Ancestries Reported - German (%)
Ancestries Reported - Greek (%)
Ancestries Reported - Hungarian (%)
Ancestries Reported - Irish (%)
Ancestries Reported - Italian (%)
Ancestries Reported - Lithuanian (%)
Ancestries Reported - Norwegian (%)
Ancestries Reported - Polish (%)
Ancestries Reported - Portuguese (%)
Ancestries Reported - Russian (%)
Ancestries Reported - Scotch-Irish (%)
Ancestries Reported - Scottish (%)
Ancestries Reported - Slovak (%)
Ancestries Reported - Subsaharan African (%)
Ancestries Reported - Swedish (%)
Ancestries Reported - Swiss (%)
Ancestries Reported - Ukrainian (%)
Ancestries Reported - United States (%)
Ancestries Reported - Welsh (%)
Ancestries Reported - West Indian (%)
Ancestries Reported - Other (%)
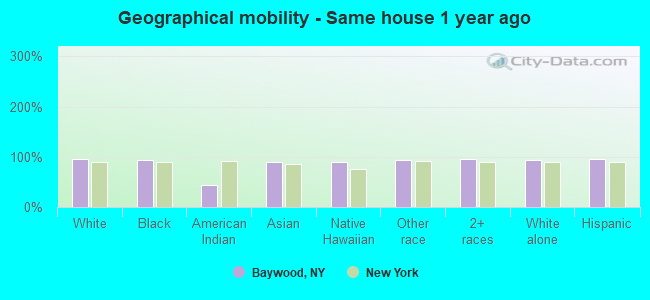
Geographical mobility - Same house 1 year ago (%)
Geographical mobility - Same house 1 year ago (%) - White
Geographical mobility - Same house 1 year ago (%) - Black or African American
Geographical mobility - Same house 1 year ago (%) - Asian
Geographical mobility - Same house 1 year ago (%) - Hispanic or Latino
Geographical mobility - Same house 1 year ago (%) - American Indian and Alaska Native
Geographical mobility - Same house 1 year ago (%) - Multirace
Geographical mobility - Same house 1 year ago (%) - Other Race
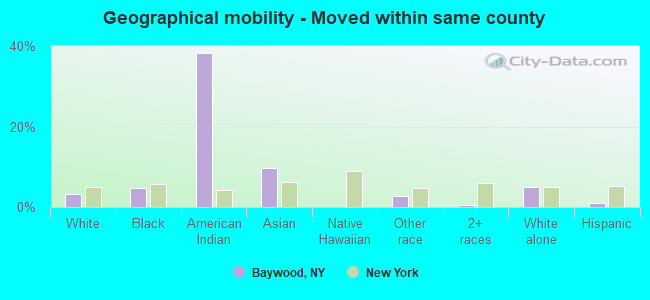
Geographical mobility - Moved within same county (%)
Geographical mobility - Moved within same county (%) - White
Geographical mobility - Moved within same county (%) - Black or African American
Geographical mobility - Moved within same county (%) - Asian
Geographical mobility - Moved within same county (%) - Hispanic or Latino
Geographical mobility - Moved within same county (%) - American Indian and Alaska Native
Geographical mobility - Moved within same county (%) - Multirace
Geographical mobility - Moved within same county (%) - Other Race
Geographical mobility - Moved from different county within same state (%)
Geographical mobility - Moved from different county within same state (%) - White
Geographical mobility - Moved from different county within same state (%) - Black or African American
Geographical mobility - Moved from different county within same state (%) - Asian
Geographical mobility - Moved from different county within same state (%) - Hispanic or Latino
Geographical mobility - Moved from different county within same state (%) - American Indian and Alaska Native
Geographical mobility - Moved from different county within same state (%) - Multirace
Geographical mobility - Moved from different county within same state (%) - Other Race
Geographical mobility - Moved from different state (%)
Geographical mobility - Moved from different state (%) - White
Geographical mobility - Moved from different state (%) - Black or African American
Geographical mobility - Moved from different state (%) - Asian
Geographical mobility - Moved from different state (%) - Hispanic or Latino
Geographical mobility - Moved from different state (%) - American Indian and Alaska Native
Geographical mobility - Moved from different state (%) - Multirace
Geographical mobility - Moved from different state (%) - Other Race
Geographical mobility - Moved from abroad (%)
Geographical mobility - Moved from abroad (%) - White
Geographical mobility - Moved from abroad (%) - Black or African American
Geographical mobility - Moved from abroad (%) - Asian
Geographical mobility - Moved from abroad (%) - Hispanic or Latino
Geographical mobility - Moved from abroad (%) - American Indian and Alaska Native
Geographical mobility - Moved from abroad (%) - Multirace
Geographical mobility - Moved from abroad (%) - Other Race
Place of birth for the foreign-born population - Ireland (%)
Place of birth for the foreign-born population - Denmark (%)
Place of birth for the foreign-born population - Norway (%)
Place of birth for the foreign-born population - Sweden (%)
Place of birth for the foreign-born population - United Kingdom (%)
Place of birth for the foreign-born population - England (%)
Place of birth for the foreign-born population - Scotland (%)
Place of birth for the foreign-born population - Other Northern Europe (%)
Place of birth for the foreign-born population - Austria (%)
Place of birth for the foreign-born population - Belgium (%)
Place of birth for the foreign-born population - France (%)
Place of birth for the foreign-born population - Germany (%)
Place of birth for the foreign-born population - Netherlands (%)
Place of birth for the foreign-born population - Switzerland (%)
Place of birth for the foreign-born population - Other Western Europe (%)
Place of birth for the foreign-born population - Greece (%)
Place of birth for the foreign-born population - Italy (%)
Place of birth for the foreign-born population - Portugal (%)
Place of birth for the foreign-born population - Spain (%)
Place of birth for the foreign-born population - Other Southern Europe (%)
Place of birth for the foreign-born population - Albania (%)
Place of birth for the foreign-born population - Belarus (%)
Place of birth for the foreign-born population - Bosnia and Herzegovina (%)
Place of birth for the foreign-born population - Bulgaria (%)
Place of birth for the foreign-born population - Croatia (%)
Place of birth for the foreign-born population - Czechoslovakia (%)
Place of birth for the foreign-born population - Hungary (%)
Place of birth for the foreign-born population - Latvia (%)
Place of birth for the foreign-born population - Lithuania (%)
Place of birth for the foreign-born population - North Macedonia (Macedonia) (%)
Place of birth for the foreign-born population - Moldova (%)
Place of birth for the foreign-born population - Poland (%)
Place of birth for the foreign-born population - Romania (%)
Place of birth for the foreign-born population - Russia (%)
Place of birth for the foreign-born population - Serbia (%)
Place of birth for the foreign-born population - Ukraine (%)
Place of birth for the foreign-born population - Other Eastern Europe (%)
Place of birth for the foreign-born population - China (%)
Place of birth for the foreign-born population - Hong Kong (%)
Place of birth for the foreign-born population - Taiwan (%)
Place of birth for the foreign-born population - Japan (%)
Place of birth for the foreign-born population - Korea (%)
Place of birth for the foreign-born population - Other Eastern Asia (%)
Place of birth for the foreign-born population - Afghanistan (%)
Place of birth for the foreign-born population - Bangladesh (%)
Place of birth for the foreign-born population - India (%)
Place of birth for the foreign-born population - Iran (%)
Place of birth for the foreign-born population - Kazakhstan (%)
Place of birth for the foreign-born population - Nepal (%)
Place of birth for the foreign-born population - Pakistan (%)
Place of birth for the foreign-born population - Sri Lanka (%)
Place of birth for the foreign-born population - Uzbekistan (%)
Place of birth for the foreign-born population - Other South Central Asia (%)
Place of birth for the foreign-born population - Burma (%)
Place of birth for the foreign-born population - Cambodia (%)
Place of birth for the foreign-born population - Indonesia (%)
Place of birth for the foreign-born population - Laos (%)
Place of birth for the foreign-born population - Malaysia (%)
Place of birth for the foreign-born population - Philippines (%)
Place of birth for the foreign-born population - Singapore (%)
Place of birth for the foreign-born population - Thailand (%)
Place of birth for the foreign-born population - Vietnam (%)
Place of birth for the foreign-born population - Other South Eastern Asia (%)
Place of birth for the foreign-born population - Armenia (%)
Place of birth for the foreign-born population - Iraq (%)
Place of birth for the foreign-born population - Israel (%)
Place of birth for the foreign-born population - Jordan (%)
Place of birth for the foreign-born population - Kuwait (%)
Place of birth for the foreign-born population - Lebanon (%)
Place of birth for the foreign-born population - Saudi Arabia (%)
Place of birth for the foreign-born population - Syria (%)
Place of birth for the foreign-born population - Turkey (%)
Place of birth for the foreign-born population - Yemen (%)
Place of birth for the foreign-born population - Other Western Asia (%)
Place of birth for the foreign-born population - Eritrea (%)
Place of birth for the foreign-born population - Ethiopia (%)
Place of birth for the foreign-born population - Kenya (%)
Place of birth for the foreign-born population - Somalia (%)
Place of birth for the foreign-born population - Uganda (%)
Place of birth for the foreign-born population - Zimbabwe (%)
Place of birth for the foreign-born population - Other Eastern Africa (%)
Place of birth for the foreign-born population - Cameroon (%)
Place of birth for the foreign-born population - Congo (%)
Place of birth for the foreign-born population - Democratic Republic of Congo (Zaire) (%)
Place of birth for the foreign-born population - Other Middle Africa (%)
Place of birth for the foreign-born population - Egypt (%)
Place of birth for the foreign-born population - Morocco (%)
Place of birth for the foreign-born population - Sudan (%)
Place of birth for the foreign-born population - Other Northern Africa (%)
Place of birth for the foreign-born population - South Africa (%)
Place of birth for the foreign-born population - Other Southern Africa (%)
Place of birth for the foreign-born population - Cabo Verde (%)
Place of birth for the foreign-born population - Ghana (%)
Place of birth for the foreign-born population - Liberia (%)
Place of birth for the foreign-born population - Nigeria (%)
Place of birth for the foreign-born population - Senegal (%)
Place of birth for the foreign-born population - Sierra Leone (%)
Place of birth for the foreign-born population - Other Western Africa (%)
Place of birth for the foreign-born population - Australia (%)
Place of birth for the foreign-born population - New Zealand (%)
Place of birth for the foreign-born population - Fiji (%)
Place of birth for the foreign-born population - Micronesia (%)
Place of birth for the foreign-born population - Bahamas (%)
Place of birth for the foreign-born population - Barbados (%)
Place of birth for the foreign-born population - Cuba (%)
Place of birth for the foreign-born population - Dominica (%)
Place of birth for the foreign-born population - Dominican Republic (%)
Place of birth for the foreign-born population - Grenada (%)
Place of birth for the foreign-born population - Haiti (%)
Place of birth for the foreign-born population - Jamaica (%)
Place of birth for the foreign-born population - St. Vincent and the Grenadines (%)
Place of birth for the foreign-born population - Trinidad and Tobago (%)
Place of birth for the foreign-born population - West Indies (%)
Place of birth for the foreign-born population - Other Caribbean (%)
Place of birth for the foreign-born population - Belize (%)
Place of birth for the foreign-born population - Costa Rica (%)
Place of birth for the foreign-born population - El Salvador (%)
Place of birth for the foreign-born population - Guatemala (%)
Place of birth for the foreign-born population - Honduras (%)
Place of birth for the foreign-born population - Mexico (%)
Place of birth for the foreign-born population - Nicaragua (%)
Place of birth for the foreign-born population - Panama (%)
Place of birth for the foreign-born population - Other Central America (%)
Place of birth for the foreign-born population - Argentina (%)
Place of birth for the foreign-born population - Bolivia (%)
Place of birth for the foreign-born population - Brazil (%)
Place of birth for the foreign-born population - Chile (%)
Place of birth for the foreign-born population - Colombia (%)
Place of birth for the foreign-born population - Ecuador (%)
Place of birth for the foreign-born population - Guyana (%)
Place of birth for the foreign-born population - Peru (%)
Place of birth for the foreign-born population - Uruguay (%)
Place of birth for the foreign-born population - Venezuela (%)
Place of birth for the foreign-born population - Other South America (%)
Place of birth for the foreign-born population - Canada (%)
Place of birth for the foreign-born population - Other Northern America (%)
Place of birth for the foreign-born population - Other (%)
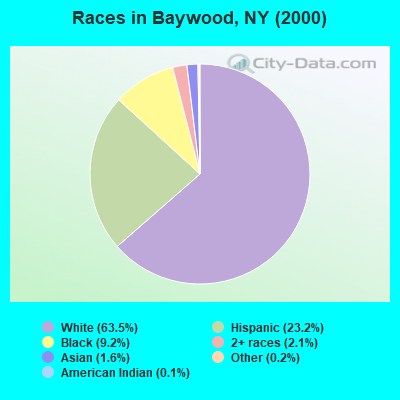
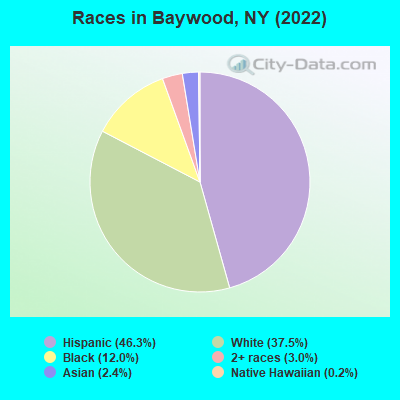
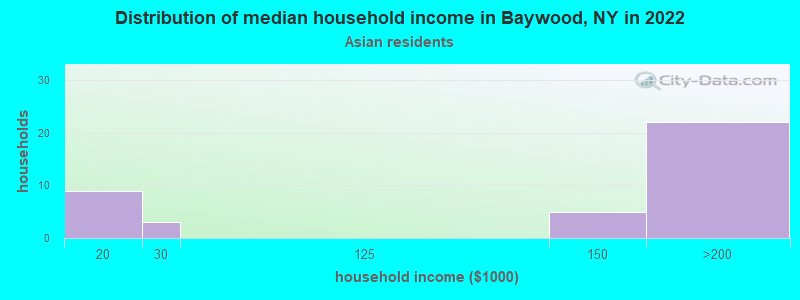
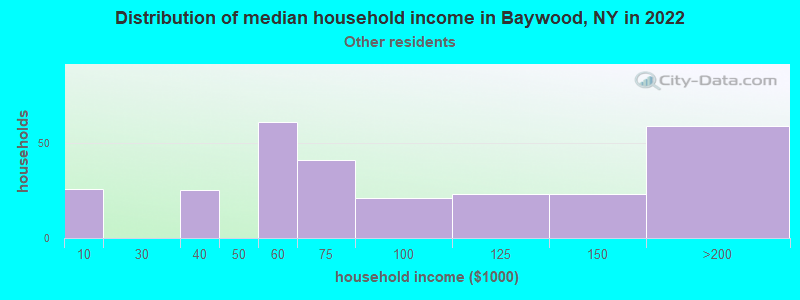
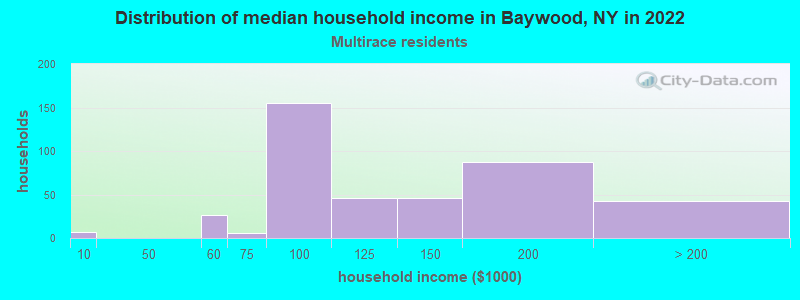
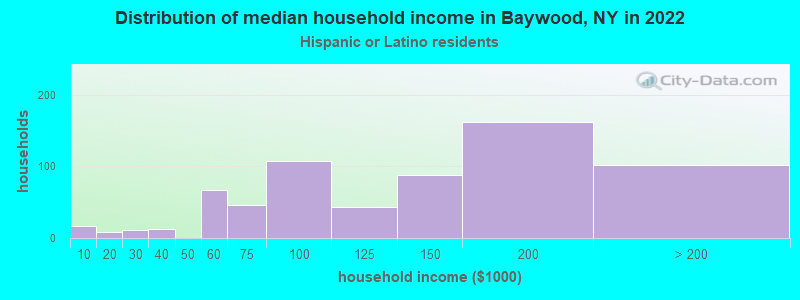
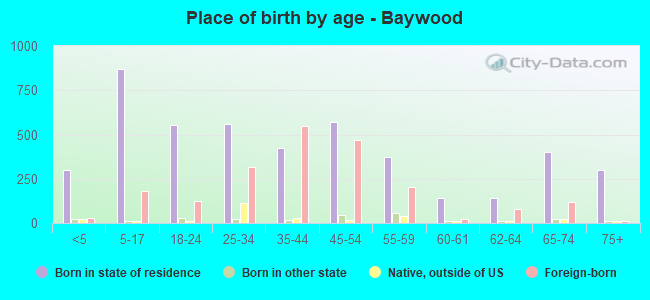
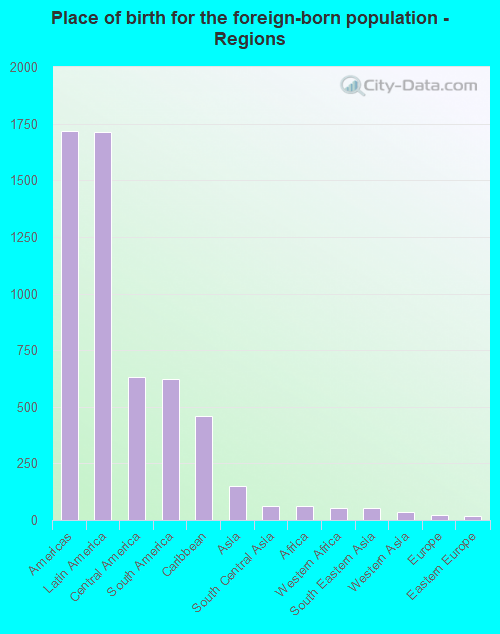
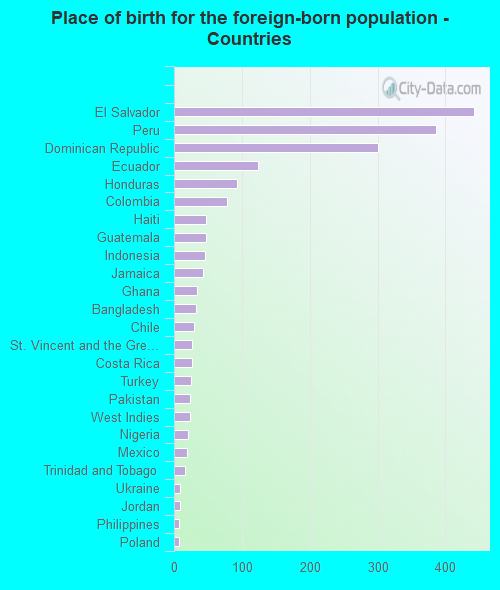
According to 2022 data, the most numerous races in Baywood, NY are White alone (2,695 residents), Hispanic (3,330 residents), and Black alone (864 residents). 58.2% of Baywood residents speak English at home. 27.1% of Baywood, NY residents are foreign-born (24.1% born in Latin America), which is 18.8% greater than the foreign-born rate of 22.0% across the entire state of New York.
Race distribution in Baywood
2000 2022
11,760,981 62.0% White alone 2,867,583 15.1% Hispanic 2,812,623 14.8% Black alone 1,035,926 5.5% Asian alone 366,116 1.9% Two or more races 75,499 0.4% Other race alone 52,499 0.3% American Indian alone 5,230 0.03% Native Hawaiian and Other
10,408,933 52.9% White alone 3,867,299 19.7% Hispanic 2,633,840 13.4% Black alone 1,776,286 9.0% Asian alone 732,670 3.7% Two or more races 216,110 1.1% Other race alone 35,082 0.2% American Indian alone 6,931 0.04% Native Hawaiian and Other
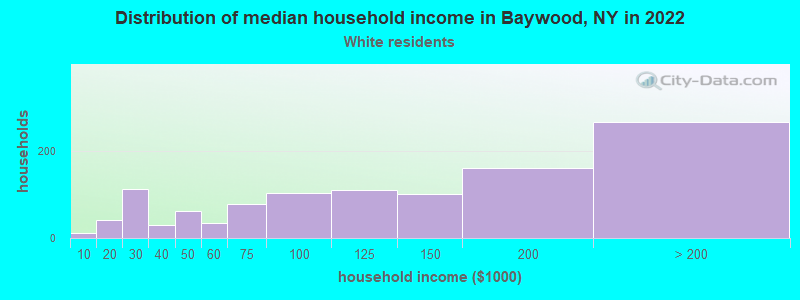
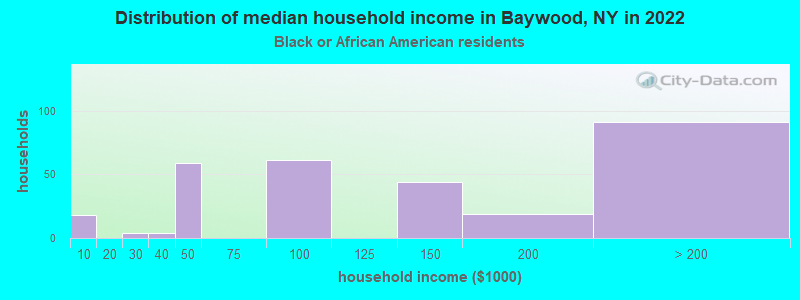
Income and house value in Baywood Median household income in 2022 $102,581 White non-Hispanic householders$139,687 Black householders$159,850 Asian householders$67,638 Some other race householders$114,154 Two or more races householders$123,039 Hispanic or Latino race householdersMedian 2022 house value $409,791 White Non-Hispanic householders$444,839 Black or African American householders $541,595 Asian householders$411,888 Some other race householders$453,526 Two or more races householders$420,875 Hispanic or Latino householders
Median age by race in Baywood
43.6 Median age for White residents41.6 46.6 39.0 Median age for Black or African American residents39.0 35.5 -748,832,865.7 Median age for American Indian / Alaska Native residents-807,017,543.1 -513,692,161.9 45.7 Median age for Asian residents33.6 52.4 -742,816,091.2 Median age for Native Hawaiian / Pacific Islander residents-831,187,409.8 -771,300,447.7 36.8 Median age for Other race residents36.9 37.8 34.2 Median age for Two or more races residents31.2 36.4 49.4 Median age for White alone residents48.5 53.3 35.3 Median age for Hispanic or Latino residents33.6 37.6
Owner/renter occupied households by race in Baywood
House owners and renters - White residents 1,041 91.9% Owner occupied91 8.1% Renter occupiedHouse owners and renters - Black or African American residents 284 96.1% Owner occupied11 3.9% Renter occupiedHouse owners and renters - American Indian / Alaska Native residents 4 100.0% Owner occupiedHouse owners and renters - Asian residents 35 100.0% Owner occupiedHouse owners and renters - Other race residents 176 70.6% Owner occupied73 29.4% Renter occupiedHouse owners and renters - Two or more races residents 254 67.0% Owner occupied125 33.0% Renter occupiedHouse owners and renters - White alone residents 860 92.9% Owner occupied66 7.1% Renter occupiedHouse owners and renters - Hispanic or Latino residents 506 76.4% Owner occupied157 23.6% Renter occupied
Language usage in Baywood
English speakers - Total 58.2% of residents of Baywood speak English at home.
38.4% of residents speak Spanish at home 1,412 54.1% Speak English very well1,198 45.9% Speak English less than very well4.2% of residents speak other language at home 155 54.2% Speak English very well131 45.8% Speak English less than very well
English speakers - Born in the United States 73.6% of residents of Baywood speak English at home.
21.3% of residents speak Spanish at home 42 100.0% Speak English very well2.5% of residents speak other language at home 5 100.0% Speak English very well
English speakers - Native, born elsewhere 46.4% of residents of Baywood speak English at home.
47.9% of residents speak Spanish at home 45 35.2% Speak English very well83 64.8% Speak English less than very well
English speakers - Foreign-born 12.7% of residents of Baywood speak English at home.
76.0% of residents speak Spanish at home 744 47.1% Speak English very well836 52.9% Speak English less than very well10.7% of residents speak other language at home 101 45.5% Speak English very well121 54.5% Speak English less than very well
White (Caucasian) - Speak only English Native:
82.6% (2,563)Foreign-born:
9.6% (49)
White (Caucasian) - Speak another language Native:
14.1% (439)Foreign-born:
84.3% (426)
Black or African American - Speak only English Native:
95.8% (582)Foreign-born:
58.5% (148)
Black or African American - Speak another language Native:
1.7% (10)Foreign-born:
42.3% (107)
American Indian / Alaska Native - Speak only English Native:
57.4% (2)Foreign-born:
48.4% (4)
Asian - Speak only English Native:
91.6% (38)Foreign-born:
25.5% (31)
Other race - Speak only English Native:
57.6% (312)Foreign-born:
4.4% (32)
Other race - Speak another language Native:
44.5% (241)Foreign-born:
96.3% (702)
Two or more races - Speak only English Native:
44.7% (293)Foreign-born:
2.0% (11)
Two or more races - Speak another language Native:
54.5% (358)Foreign-born:
99.3% (513)
White alone - Speak only English Native:
91.5% (2,372)Foreign-born:
37.1% (20)
White alone - Speak another language Native:
8.9% (230)Foreign-born:
62.9% (33)
Hispanic or Latino - Speak only English Native:
40.5% (553)Foreign-born:
4.3% (73)
Hispanic or Latino - Speak another language Native:
59.0% (805)Foreign-born:
96.0% (1,650)
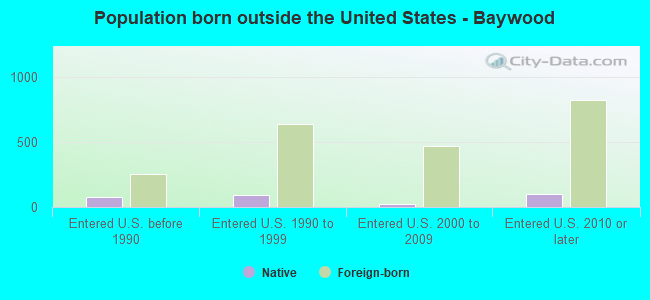
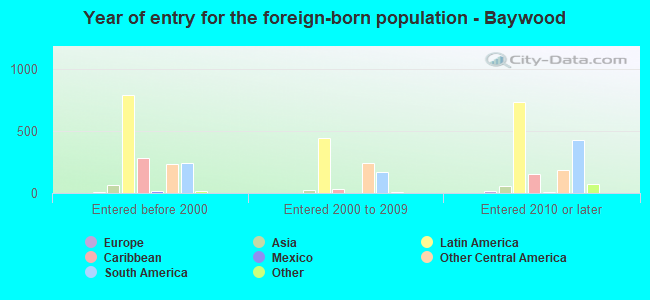
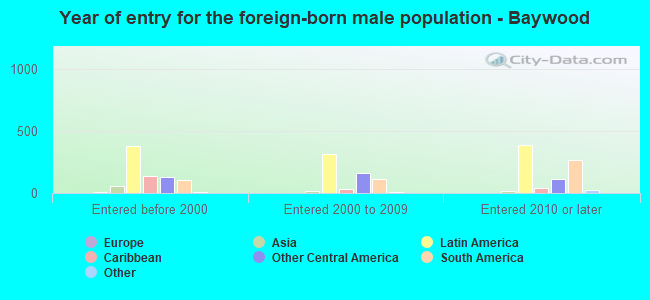
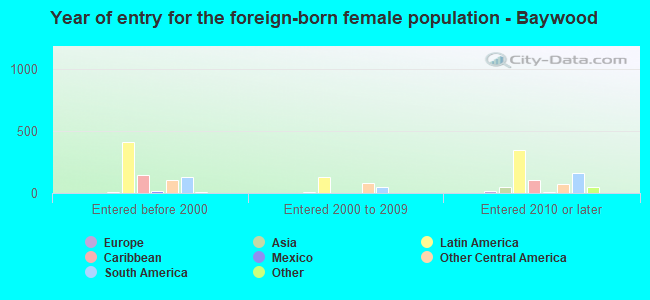
Foreign-born residents in Baywood 1,949 residents are foreign born (24.1% Latin America ).
This city:
27.1%New York:
22.6%
Marital status for residents in Baywood Marital status - White (Caucasian) population 15 years and over
Males 43.2% Never married39.1% Now married3.2% Separated3.6% Widowed10.8% DivorcedFemales 34.9% Never married44.4% Now married1.6% Separated8.1% Widowed10.9% DivorcedWomen who gave birth in the past 12 months Now married:
0.0% (0)Unmarried:
100.0% (21)
Women who did not give birth in the past 12 months Now married:
37.7% (251)Unmarried:
62.3% (413)
Marital status - Black or African American population 15 years and over
Males 27.8% Never married50.9% Now married8.9% Separated0.0% Widowed12.3% DivorcedFemales 54.1% Never married27.2% Now married0.0% Separated11.9% Widowed6.7% DivorcedWomen who gave birth in the past 12 months Now married:
0.0% (0)Unmarried:
100.0% (61)
Women who did not give birth in the past 12 months Now married:
24.0% (35)Unmarried:
76.0% (110)
Marital status - Asian population 15 years and over
Males 27.9% Never married72.1% Now married0.0% Separated0.0% Widowed0.0% DivorcedFemales 4.7% Never married91.8% Now married0.0% Separated3.5% Widowed0.0% DivorcedWomen who did not give birth in the past 12 months Now married:
94.4% (71)Unmarried:
5.6% (4)
Marital status - Other race population 15 years and over
Males 45.4% Never married54.6% Now married0.0% Separated0.0% Widowed0.0% DivorcedFemales 24.7% Never married48.9% Now married0.0% Separated5.1% Widowed21.3% DivorcedWomen who gave birth in the past 12 months Now married:
77.6% (66)Unmarried:
22.4% (19)
Women who did not give birth in the past 12 months Now married:
37.1% (130)Unmarried:
62.9% (220)
Marital status - Two or more races population 15 years and over
Males 35.9% Never married54.4% Now married0.0% Separated1.8% Widowed7.9% DivorcedFemales 45.8% Never married32.0% Now married0.0% Separated8.3% Widowed13.9% DivorcedWomen who gave birth in the past 12 months Now married:
28.1% (13)Unmarried:
71.9% (34)
Women who did not give birth in the past 12 months Now married:
35.9% (138)Unmarried:
64.1% (246)
Marital status - White alone, not Hispanic / Latino population 15 years and over
Males 44.8% Never married35.3% Now married3.2% Separated5.3% Widowed11.4% DivorcedFemales 35.7% Never married40.1% Now married1.2% Separated9.1% Widowed13.8% DivorcedWomen who gave birth in the past 12 months Now married:
0.0% (0)Unmarried:
100.0% (23)
Women who did not give birth in the past 12 months Now married:
22.6% (87)Unmarried:
77.4% (300)
Marital status - Hispanic or Latino population 15 years and over
Males 40.6% Never married50.6% Now married1.6% Separated0.5% Widowed6.8% DivorcedFemales 32.0% Never married47.1% Now married1.0% Separated6.5% Widowed13.4% DivorcedWomen who gave birth in the past 12 months Now married:
76.1% (56)Unmarried:
23.9% (18)
Women who did not give birth in the past 12 months Now married:
45.1% (374)Unmarried:
54.9% (455)
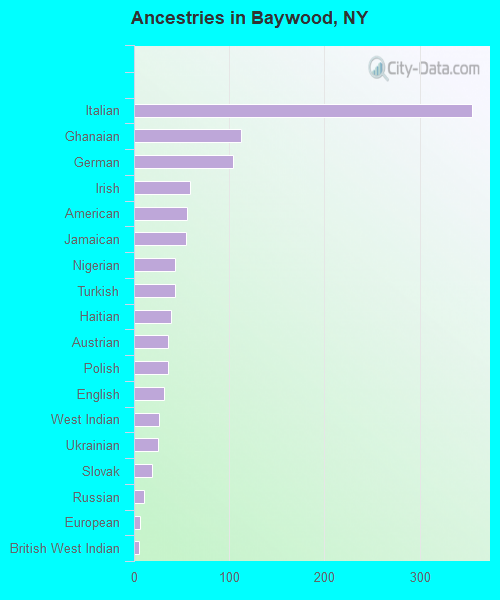
Ancestries in Baywood
355 10.6% Italian112 3.3% Ghanaian104 3.1% German59 1.8% Irish56 1.7% American55 1.6% Jamaican43 1.3% Nigerian43 1.3% Turkish39 1.2% Haitian36 1.1% Austrian36 1.1% Polish31 0.9% English26 0.8% West Indian25 0.7% Ukrainian19 0.6% Slovak11 0.3% Russian6 0.2% European5 0.1% British West Indian3 0.09% Danish
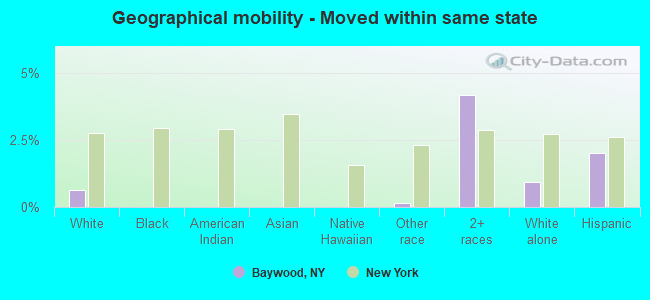
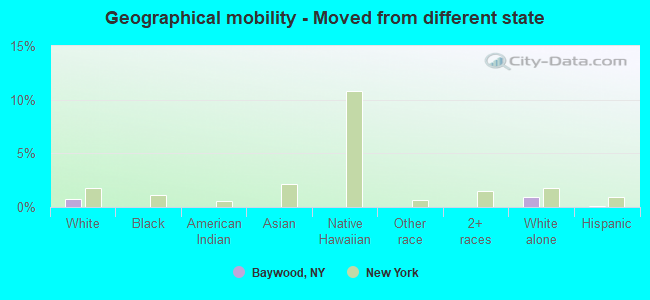
Geographical mobility in Baywood Same house 1 year ago 3,638 95.2% White (Caucasian)815 93.5% Black or African American4 44.3% American Indian / Alaska Native154 89.5% Asian8 89.7% Native Hawaiian / Pacific Islander1,193 92.9% Other race1,265 94.9% Two or more races2,485 92.7% White alone, not Hispanic / Latino3,153 95.8% Hispanic or LatinoMoved within same county 120 3.1% White / Caucasian41 4.7% Black or African American4 38.2% American Indian / Alaska Native17 9.6% Asian34 2.6% Other race8 0.6% Two or more races132 4.9% White alone, not Hispanic / Latino32 1.0% Hispanic or LatinoMoved within same state 24 0.6% White / Caucasian2 0.1% Other race56 4.2% Two or more races25 0.9% White alone, not Hispanic / Latino67 2.0% Hispanic or LatinoMoved from different state 29 0.7% White / Caucasian25 0.9% White alone, not Hispanic / Latino3 0.1% Hispanic or LatinoMoved from abroad 10 0.3% White5 0.5% Black or African American37 2.9% Other race13 0.5% White alone, not Hispanic / Latino22 0.7% Hispanic or Latino
Children Nativity (place of birth) in Baywood
Children under 6 years - Living with two parents Both parents native 51 66.0% Native26 34.0% Foreign-bornBoth parents foreign-born 100 72.7% Native38 27.3% Foreign-bornOne native, one foreign-born parent 47 100.0% NativeChildren under 6 years - Living with one parent Native parent 102 98.2% Native2 1.8% Foreign-bornForeign-born parent 23 58.1% Native16 41.9% Foreign-bornChildren 6 to 17 years - Living with two parents Both parents native 260 99.9% Native0 0.1% Foreign-bornBoth parents foreign-born 166 75.0% Native56 25.0% Foreign-bornOne native, one foreign-born parent 69 100.0% NativeChildren 6 to 17 years - Living with one parent Native parent 72 100.0% NativeForeign-born parent 159 58.7% Native112 41.3% Foreign-born
Grandparents responsible for own grandchildren in Baywood
Grandparents (30 to 59 years) White / Caucasian 9 100.0% Not responsible for grandchildrenBlack or African American 28 100.0% Responsible for grandchildrenOther race 95 100.0% Responsible for grandchildrenTwo or more races 96 100.0% Not responsible for grandchildrenHispanic or Latino 108 67.1% Responsible for grandchildren53 32.9% Not responsible for grandchildrenGrandparents (60 years and over) White / Caucasian 19 35.3% Responsible for grandchildren36 64.7% Not responsible for grandchildrenBlack or African American 18 40.3% Responsible for grandchildren26 59.7% Not responsible for grandchildrenOther race 40 100.0% Not responsible for grandchildrenTwo or more races 12 100.0% Not responsible for grandchildrenHispanic or Latino 39 100.0% Not responsible for grandchildren