Races in Azalea Park, Florida (FL) Detailed Stats
Data:
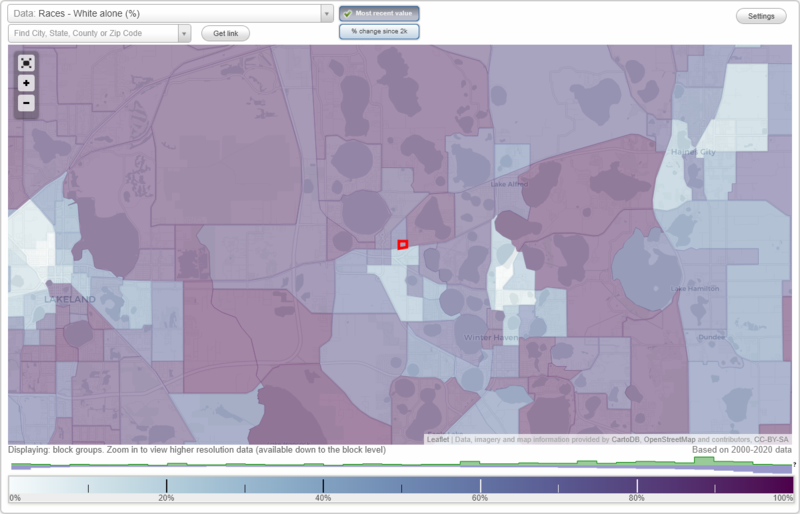
Races - White alone (%)
Races - White alone (% change since 2000)
Races - Black alone (%)
Races - Black alone (% change since 2000)
Races - American Indian alone (%)
Races - American Indian alone (% change since 2000)
Races - Asian alone (%)
Races - Asian alone (% change since 2000)
Races - Hispanic (%)
Races - Hispanic (% change since 2000)
Races - Native Hawaiian and Other Pacific Islander alone (%)
Races - Native Hawaiian and Other Pacific Islander alone (% change since 2000)
Races - Two or more races(%)
Races - Two or more races(% change since 2000)
Races - Other race alone (%)
Races - Other race alone (% change since 2000)
Racial diversity
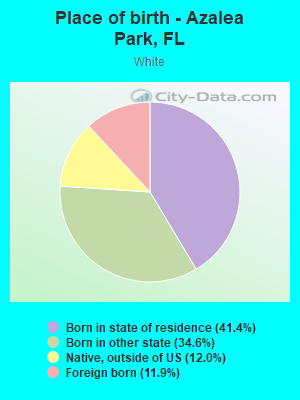
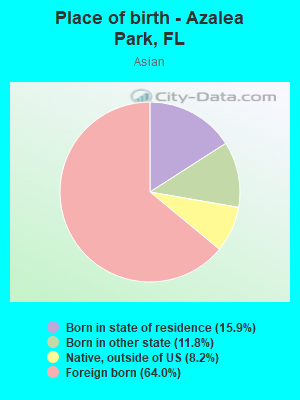
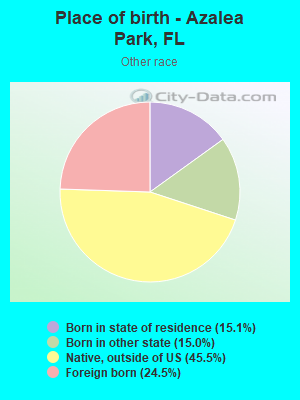
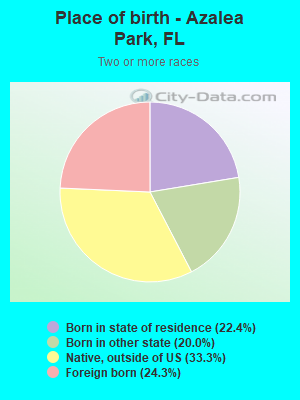
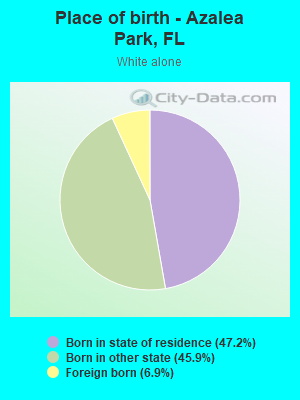
Place of birth - Born in state of residence (%)
Place of birth - Born in state of residence (%) - White
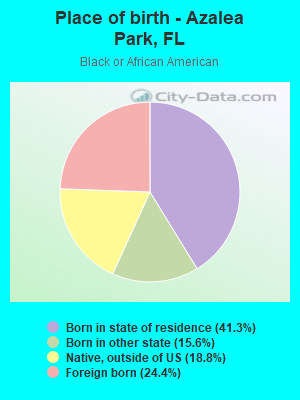
Place of birth - Born in state of residence (%) - Black or African American
Place of birth - Born in state of residence (%) - Asian
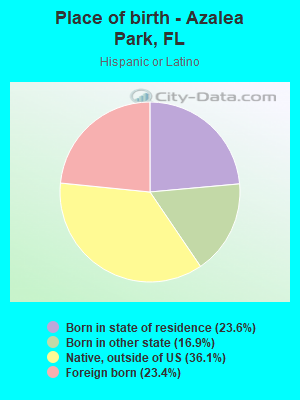
Place of birth - Born in state of residence (%) - Hispanic or Latino
Place of birth - Born in state of residence (%) - American Indian and Alaska Native
Place of birth - Born in state of residence (%) - Multirace
Place of birth - Born in state of residence (%) - Other Race
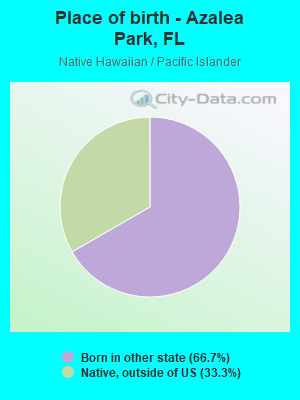
Place of birth - Born in other state (%)
Place of birth - Born in other state (%) - White
Place of birth - Born in other state (%) - Black or African American
Place of birth - Born in other state (%) - Asian
Place of birth - Born in other state (%) - Hispanic or Latino
Place of birth - Born in other state (%) - American Indian and Alaska Native
Place of birth - Born in other state (%) - Multirace
Place of birth - Born in other state (%) - Other Race
Place of birth - Native, outside of US (%)
Place of birth - Native, outside of US (%) - White
Place of birth - Native, outside of US (%) - Black or African American
Place of birth - Native, outside of US (%) - Asian
Place of birth - Native, outside of US (%) - Hispanic or Latino
Place of birth - Native, outside of US (%) - American Indian and Alaska Native
Place of birth - Native, outside of US (%) - Multirace
Place of birth - Native, outside of US (%) - Other Race
Place of birth - Foreign born (%)
Place of birth - Foreign born (%) - White
Place of birth - Foreign born (%) - Black or African American
Place of birth - Foreign born (%) - Asian
Place of birth - Foreign born (%) - Hispanic or Latino
Place of birth - Foreign born (%) - American Indian and Alaska Native
Place of birth - Foreign born (%) - Multirace
Place of birth - Foreign born (%) - Other Race
Residents speaking English at home (%)
Residents speaking English at home - Born in the United States (%)
Residents speaking English at home - Native, born elsewhere (%)
Residents speaking English at home - Foreign born (%)
Residents speaking Spanish at home (%)
Residents speaking Spanish at home - Born in the United States (%)
Residents speaking Spanish at home - Native, born elsewhere (%)
Residents speaking Spanish at home - Foreign born (%)
Residents speaking other language at home (%)
Residents speaking other language at home - Born in the United States (%)
Residents speaking other language at home - Native, born elsewhere (%)
Residents speaking other language at home - Foreign born (%)
Marital status - Never married (%)
Marital status - Now married (%)
Marital status - Separated (%)
Marital status - Widowed (%)
Marital status - Divorced (%)
Ancestries Reported - Arab (%)
Ancestries Reported - Czech (%)
Ancestries Reported - Danish (%)
Ancestries Reported - Dutch (%)
Ancestries Reported - English (%)
Ancestries Reported - French (%)
Ancestries Reported - French Canadian (%)
Ancestries Reported - German (%)
Ancestries Reported - Greek (%)
Ancestries Reported - Hungarian (%)
Ancestries Reported - Irish (%)
Ancestries Reported - Italian (%)
Ancestries Reported - Lithuanian (%)
Ancestries Reported - Norwegian (%)
Ancestries Reported - Polish (%)
Ancestries Reported - Portuguese (%)
Ancestries Reported - Russian (%)
Ancestries Reported - Scotch-Irish (%)
Ancestries Reported - Scottish (%)
Ancestries Reported - Slovak (%)
Ancestries Reported - Subsaharan African (%)
Ancestries Reported - Swedish (%)
Ancestries Reported - Swiss (%)
Ancestries Reported - Ukrainian (%)
Ancestries Reported - United States (%)
Ancestries Reported - Welsh (%)
Ancestries Reported - West Indian (%)
Ancestries Reported - Other (%)
Geographical mobility - Same house 1 year ago (%)
Geographical mobility - Same house 1 year ago (%) - White
Geographical mobility - Same house 1 year ago (%) - Black or African American
Geographical mobility - Same house 1 year ago (%) - Asian
Geographical mobility - Same house 1 year ago (%) - Hispanic or Latino
Geographical mobility - Same house 1 year ago (%) - American Indian and Alaska Native
Geographical mobility - Same house 1 year ago (%) - Multirace
Geographical mobility - Same house 1 year ago (%) - Other Race
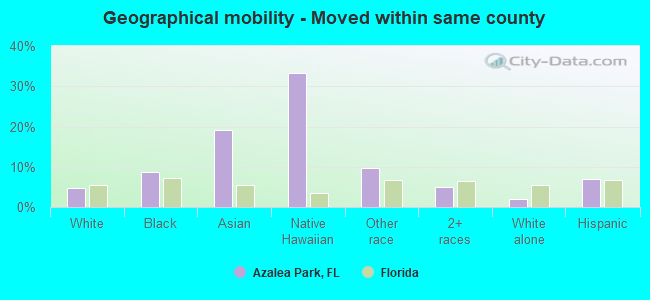
Geographical mobility - Moved within same county (%)
Geographical mobility - Moved within same county (%) - White
Geographical mobility - Moved within same county (%) - Black or African American
Geographical mobility - Moved within same county (%) - Asian
Geographical mobility - Moved within same county (%) - Hispanic or Latino
Geographical mobility - Moved within same county (%) - American Indian and Alaska Native
Geographical mobility - Moved within same county (%) - Multirace
Geographical mobility - Moved within same county (%) - Other Race
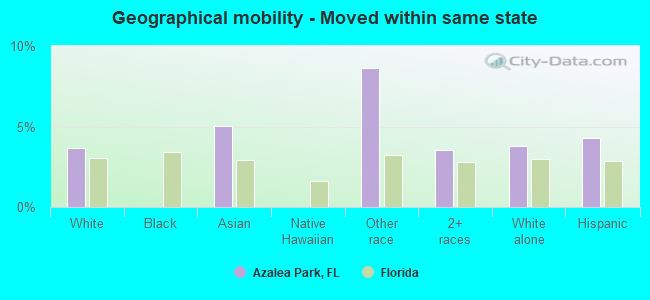
Geographical mobility - Moved from different county within same state (%)
Geographical mobility - Moved from different county within same state (%) - White
Geographical mobility - Moved from different county within same state (%) - Black or African American
Geographical mobility - Moved from different county within same state (%) - Asian
Geographical mobility - Moved from different county within same state (%) - Hispanic or Latino
Geographical mobility - Moved from different county within same state (%) - American Indian and Alaska Native
Geographical mobility - Moved from different county within same state (%) - Multirace
Geographical mobility - Moved from different county within same state (%) - Other Race
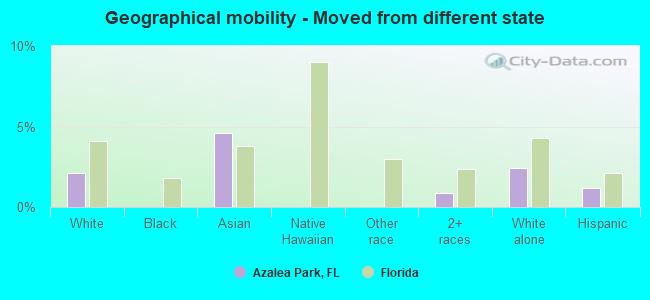
Geographical mobility - Moved from different state (%)
Geographical mobility - Moved from different state (%) - White
Geographical mobility - Moved from different state (%) - Black or African American
Geographical mobility - Moved from different state (%) - Asian
Geographical mobility - Moved from different state (%) - Hispanic or Latino
Geographical mobility - Moved from different state (%) - American Indian and Alaska Native
Geographical mobility - Moved from different state (%) - Multirace
Geographical mobility - Moved from different state (%) - Other Race
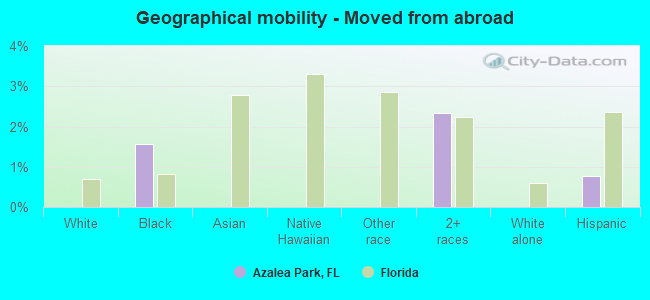
Geographical mobility - Moved from abroad (%)
Geographical mobility - Moved from abroad (%) - White
Geographical mobility - Moved from abroad (%) - Black or African American
Geographical mobility - Moved from abroad (%) - Asian
Geographical mobility - Moved from abroad (%) - Hispanic or Latino
Geographical mobility - Moved from abroad (%) - American Indian and Alaska Native
Geographical mobility - Moved from abroad (%) - Multirace
Geographical mobility - Moved from abroad (%) - Other Race
Place of birth for the foreign-born population - Ireland (%)
Place of birth for the foreign-born population - Denmark (%)
Place of birth for the foreign-born population - Norway (%)
Place of birth for the foreign-born population - Sweden (%)
Place of birth for the foreign-born population - United Kingdom (%)
Place of birth for the foreign-born population - England (%)
Place of birth for the foreign-born population - Scotland (%)
Place of birth for the foreign-born population - Other Northern Europe (%)
Place of birth for the foreign-born population - Austria (%)
Place of birth for the foreign-born population - Belgium (%)
Place of birth for the foreign-born population - France (%)
Place of birth for the foreign-born population - Germany (%)
Place of birth for the foreign-born population - Netherlands (%)
Place of birth for the foreign-born population - Switzerland (%)
Place of birth for the foreign-born population - Other Western Europe (%)
Place of birth for the foreign-born population - Greece (%)
Place of birth for the foreign-born population - Italy (%)
Place of birth for the foreign-born population - Portugal (%)
Place of birth for the foreign-born population - Spain (%)
Place of birth for the foreign-born population - Other Southern Europe (%)
Place of birth for the foreign-born population - Albania (%)
Place of birth for the foreign-born population - Belarus (%)
Place of birth for the foreign-born population - Bosnia and Herzegovina (%)
Place of birth for the foreign-born population - Bulgaria (%)
Place of birth for the foreign-born population - Croatia (%)
Place of birth for the foreign-born population - Czechoslovakia (%)
Place of birth for the foreign-born population - Hungary (%)
Place of birth for the foreign-born population - Latvia (%)
Place of birth for the foreign-born population - Lithuania (%)
Place of birth for the foreign-born population - North Macedonia (Macedonia) (%)
Place of birth for the foreign-born population - Moldova (%)
Place of birth for the foreign-born population - Poland (%)
Place of birth for the foreign-born population - Romania (%)
Place of birth for the foreign-born population - Russia (%)
Place of birth for the foreign-born population - Serbia (%)
Place of birth for the foreign-born population - Ukraine (%)
Place of birth for the foreign-born population - Other Eastern Europe (%)
Place of birth for the foreign-born population - China (%)
Place of birth for the foreign-born population - Hong Kong (%)
Place of birth for the foreign-born population - Taiwan (%)
Place of birth for the foreign-born population - Japan (%)
Place of birth for the foreign-born population - Korea (%)
Place of birth for the foreign-born population - Other Eastern Asia (%)
Place of birth for the foreign-born population - Afghanistan (%)
Place of birth for the foreign-born population - Bangladesh (%)
Place of birth for the foreign-born population - India (%)
Place of birth for the foreign-born population - Iran (%)
Place of birth for the foreign-born population - Kazakhstan (%)
Place of birth for the foreign-born population - Nepal (%)
Place of birth for the foreign-born population - Pakistan (%)
Place of birth for the foreign-born population - Sri Lanka (%)
Place of birth for the foreign-born population - Uzbekistan (%)
Place of birth for the foreign-born population - Other South Central Asia (%)
Place of birth for the foreign-born population - Burma (%)
Place of birth for the foreign-born population - Cambodia (%)
Place of birth for the foreign-born population - Indonesia (%)
Place of birth for the foreign-born population - Laos (%)
Place of birth for the foreign-born population - Malaysia (%)
Place of birth for the foreign-born population - Philippines (%)
Place of birth for the foreign-born population - Singapore (%)
Place of birth for the foreign-born population - Thailand (%)
Place of birth for the foreign-born population - Vietnam (%)
Place of birth for the foreign-born population - Other South Eastern Asia (%)
Place of birth for the foreign-born population - Armenia (%)
Place of birth for the foreign-born population - Iraq (%)
Place of birth for the foreign-born population - Israel (%)
Place of birth for the foreign-born population - Jordan (%)
Place of birth for the foreign-born population - Kuwait (%)
Place of birth for the foreign-born population - Lebanon (%)
Place of birth for the foreign-born population - Saudi Arabia (%)
Place of birth for the foreign-born population - Syria (%)
Place of birth for the foreign-born population - Turkey (%)
Place of birth for the foreign-born population - Yemen (%)
Place of birth for the foreign-born population - Other Western Asia (%)
Place of birth for the foreign-born population - Eritrea (%)
Place of birth for the foreign-born population - Ethiopia (%)
Place of birth for the foreign-born population - Kenya (%)
Place of birth for the foreign-born population - Somalia (%)
Place of birth for the foreign-born population - Uganda (%)
Place of birth for the foreign-born population - Zimbabwe (%)
Place of birth for the foreign-born population - Other Eastern Africa (%)
Place of birth for the foreign-born population - Cameroon (%)
Place of birth for the foreign-born population - Congo (%)
Place of birth for the foreign-born population - Democratic Republic of Congo (Zaire) (%)
Place of birth for the foreign-born population - Other Middle Africa (%)
Place of birth for the foreign-born population - Egypt (%)
Place of birth for the foreign-born population - Morocco (%)
Place of birth for the foreign-born population - Sudan (%)
Place of birth for the foreign-born population - Other Northern Africa (%)
Place of birth for the foreign-born population - South Africa (%)
Place of birth for the foreign-born population - Other Southern Africa (%)
Place of birth for the foreign-born population - Cabo Verde (%)
Place of birth for the foreign-born population - Ghana (%)
Place of birth for the foreign-born population - Liberia (%)
Place of birth for the foreign-born population - Nigeria (%)
Place of birth for the foreign-born population - Senegal (%)
Place of birth for the foreign-born population - Sierra Leone (%)
Place of birth for the foreign-born population - Other Western Africa (%)
Place of birth for the foreign-born population - Australia (%)
Place of birth for the foreign-born population - New Zealand (%)
Place of birth for the foreign-born population - Fiji (%)
Place of birth for the foreign-born population - Micronesia (%)
Place of birth for the foreign-born population - Bahamas (%)
Place of birth for the foreign-born population - Barbados (%)
Place of birth for the foreign-born population - Cuba (%)
Place of birth for the foreign-born population - Dominica (%)
Place of birth for the foreign-born population - Dominican Republic (%)
Place of birth for the foreign-born population - Grenada (%)
Place of birth for the foreign-born population - Haiti (%)
Place of birth for the foreign-born population - Jamaica (%)
Place of birth for the foreign-born population - St. Vincent and the Grenadines (%)
Place of birth for the foreign-born population - Trinidad and Tobago (%)
Place of birth for the foreign-born population - West Indies (%)
Place of birth for the foreign-born population - Other Caribbean (%)
Place of birth for the foreign-born population - Belize (%)
Place of birth for the foreign-born population - Costa Rica (%)
Place of birth for the foreign-born population - El Salvador (%)
Place of birth for the foreign-born population - Guatemala (%)
Place of birth for the foreign-born population - Honduras (%)
Place of birth for the foreign-born population - Mexico (%)
Place of birth for the foreign-born population - Nicaragua (%)
Place of birth for the foreign-born population - Panama (%)
Place of birth for the foreign-born population - Other Central America (%)
Place of birth for the foreign-born population - Argentina (%)
Place of birth for the foreign-born population - Bolivia (%)
Place of birth for the foreign-born population - Brazil (%)
Place of birth for the foreign-born population - Chile (%)
Place of birth for the foreign-born population - Colombia (%)
Place of birth for the foreign-born population - Ecuador (%)
Place of birth for the foreign-born population - Guyana (%)
Place of birth for the foreign-born population - Peru (%)
Place of birth for the foreign-born population - Uruguay (%)
Place of birth for the foreign-born population - Venezuela (%)
Place of birth for the foreign-born population - Other South America (%)
Place of birth for the foreign-born population - Canada (%)
Place of birth for the foreign-born population - Other Northern America (%)
Place of birth for the foreign-born population - Other (%)
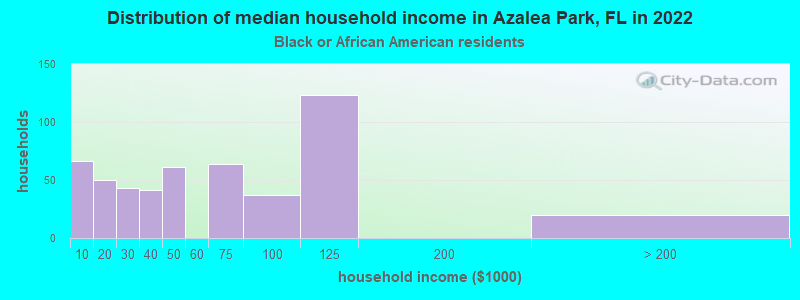
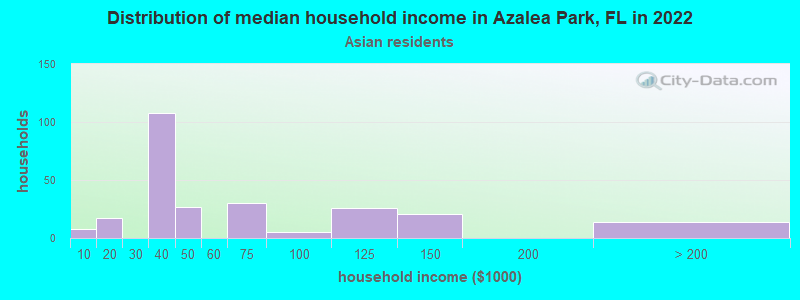
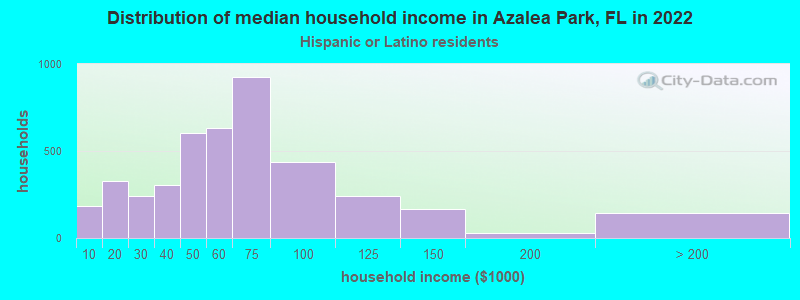
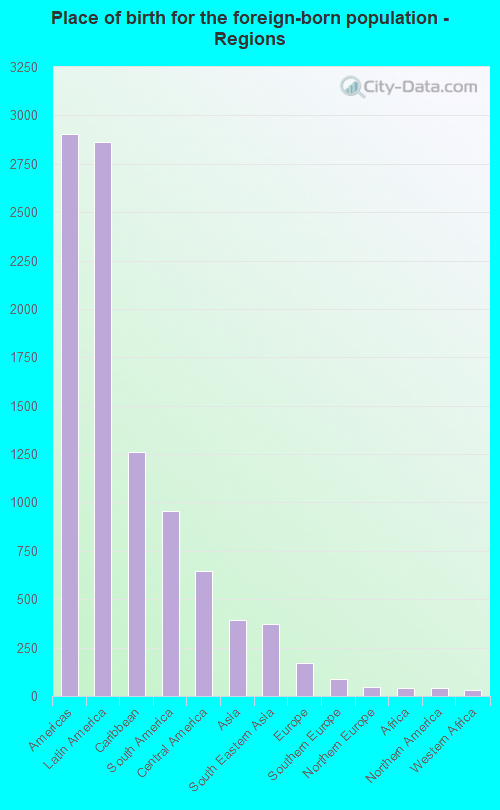
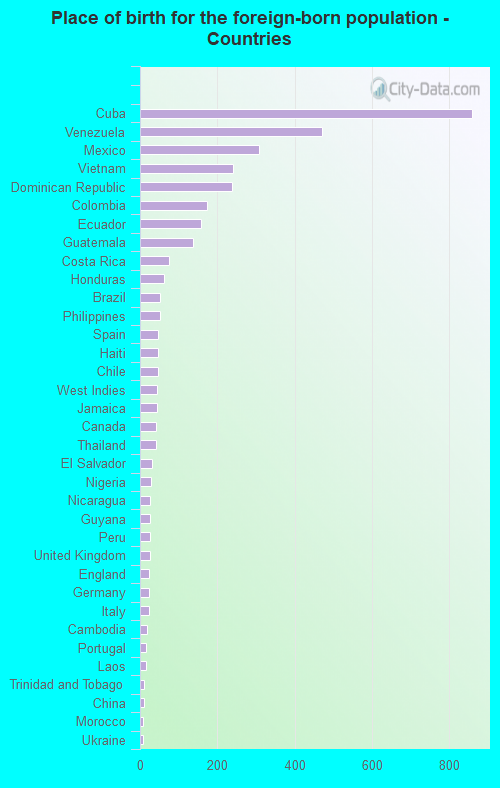
According to 2022 data, the most numerous races in Azalea Park, FL are White alone (2,921 residents), Hispanic (11,525 residents), and Black alone (955 residents). 40.0% of Azalea Park residents speak English at home. 21.5% of Azalea Park, FL residents are foreign-born (17.0% born in Latin America, 2.3% born in Asia), which is 2.5% greater than the foreign-born rate of 21.0% across the entire state of Florida.
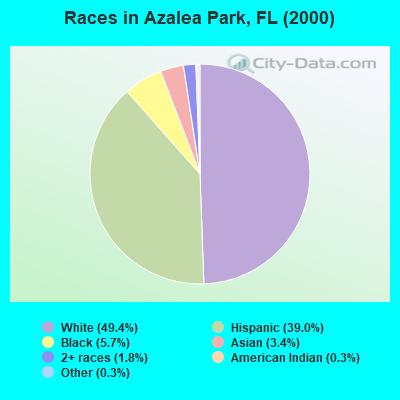
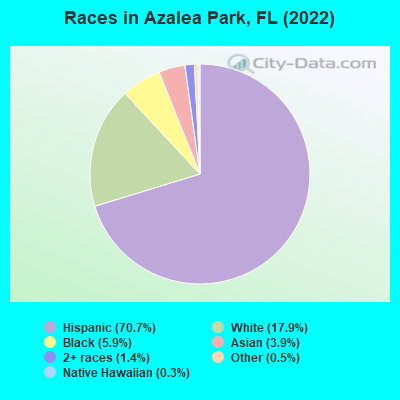
Race distribution in Azalea Park
2000 2022
10,458,509 65.4% White alone 2,682,715 16.8% Hispanic 2,264,268 14.2% Black alone 261,693 1.6% Asian alone 236,954 1.5% Two or more races 42,358 0.3% American Indian alone 28,994 0.2% Other race alone 6,887 0.04% Native Hawaiian and Other
11,309,403 50.8% White alone 6,025,039 27.1% Hispanic 3,241,015 14.6% Black alone 861,630 3.9% Two or more races 623,692 2.8% Asian alone 152,054 0.7% Other race alone 22,504 0.1% American Indian alone 9,486 0.04% Native Hawaiian and Other
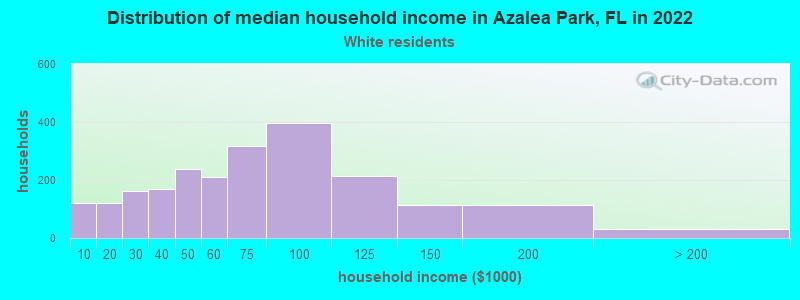
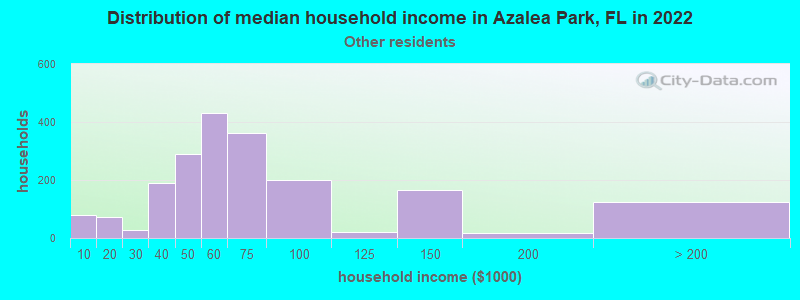
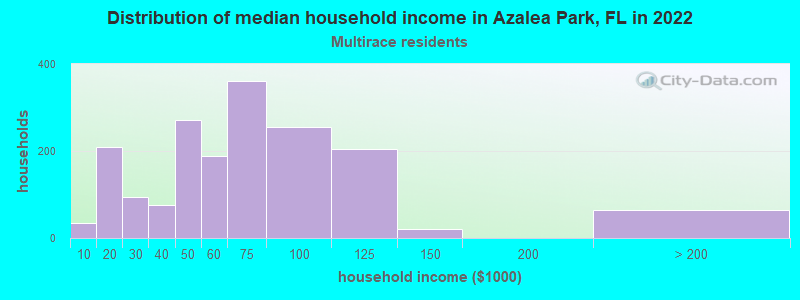
Income and house value in Azalea Park Median household income in 2022 $86,659 White non-Hispanic householders$50,615 Black householders$37,323 Asian householders$59,497 Some other race householders$63,017 Two or more races householders$58,519 Hispanic or Latino race householdersMedian 2022 house value $244,945 White Non-Hispanic householders$276,382 Black or African American householders$362,179 American Indian or Alaska Native householders $186,656 Asian householders$269,506 Some other race householders$320,918 Two or more races householders$274,418 Hispanic or Latino householders
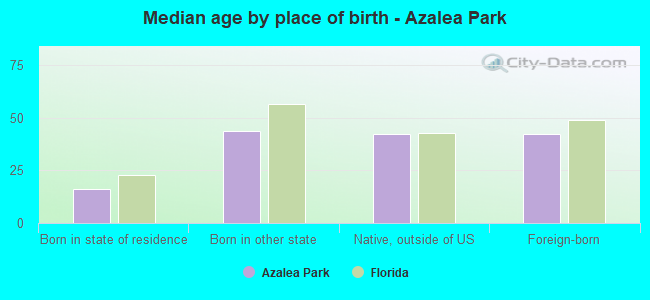
Median age by race in Azalea Park
39.1 Median age for White residents38.4 39.4 29.8 Median age for Black or African American residents29.4 33.2 -614,300,100.1 Median age for American Indian / Alaska Native residents-735,632,183.2 -529,680,364.8 29.0 Median age for Asian residents27.5 30.7 32.2 Median age for Native Hawaiian / Pacific Islander residents-1,327,635,326.3 -611,111,110.5 38.4 Median age for Other race residents28.4 53.3 36.0 Median age for Two or more races residents35.1 36.5 49.7 Median age for White alone residents49.6 50.0 36.0 Median age for Hispanic or Latino residents31.1 39.5
Owner/renter occupied households by race in Azalea Park
House owners and renters - White residents 1,403 62.0% Owner occupied860 38.0% Renter occupiedHouse owners and renters - Black or African American residents 154 28.6% Owner occupied385 71.4% Renter occupiedHouse owners and renters - Asian residents 233 89.4% Owner occupied28 10.6% Renter occupiedHouse owners and renters - Native Hawaiian / Pacific Islander residents 30 100.0% Renter occupiedHouse owners and renters - Other race residents 1,031 51.7% Owner occupied964 48.3% Renter occupiedHouse owners and renters - Two or more races residents 860 48.0% Owner occupied931 52.0% Renter occupiedHouse owners and renters - White alone residents 944 73.5% Owner occupied340 26.5% Renter occupiedHouse owners and renters - Hispanic or Latino residents 2,084 49.7% Owner occupied2,109 50.3% Renter occupied
Language usage in Azalea Park
English speakers - Total 40.0% of residents of Azalea Park speak English at home.
54.2% of residents speak Spanish at home 4,330 51.5% Speak English very well4,081 48.5% Speak English less than very well4.6% of residents speak other language at home 298 41.6% Speak English very well418 58.4% Speak English less than very well
English speakers - Born in the United States 71.0% of residents of Azalea Park speak English at home.
27.9% of residents speak Spanish at home 932 94.4% Speak English very well55 5.6% Speak English less than very well1.5% of residents speak other language at home 31 58.5% Speak English very well22 41.5% Speak English less than very well
English speakers - Native, born elsewhere 11.7% of residents of Azalea Park speak English at home.
83.5% of residents speak Spanish at home 1,825 52.4% Speak English very well1,655 47.6% Speak English less than very well1.3% of residents speak other language at home 5 9.3% Speak English very well49 90.7% Speak English less than very well
English speakers - Foreign-born 14.5% of residents of Azalea Park speak English at home.
71.2% of residents speak Spanish at home 646 25.5% Speak English very well1,888 74.5% Speak English less than very well14.4% of residents speak other language at home 148 28.9% Speak English very well364 71.1% Speak English less than very well
White (Caucasian) - Speak only English Native:
66.3% (3,259)Foreign-born:
21.4% (134)
White (Caucasian) - Speak another language Native:
21.8% (1,070)Foreign-born:
79.0% (497)
Black or African American - Speak only English Native:
60.8% (688)Foreign-born:
53.7% (194)
Black or African American - Speak another language Native:
43.3% (490)Foreign-born:
47.3% (171)
Asian - Speak only English Native:
49.9% (78)Foreign-born:
10.8% (44)
Asian - Speak another language Native:
48.0% (75)Foreign-born:
87.6% (360)
Other race - Speak only English Native:
16.1% (456)Foreign-born:
3.8% (35)
Other race - Speak another language Native:
81.9% (2,326)Foreign-born:
97.7% (896)
Two or more races - Speak only English Native:
36.8% (1,487)Foreign-born:
5.4% (74)
Two or more races - Speak another language Native:
63.9% (2,584)Foreign-born:
94.7% (1,298)
White alone - Speak only English Native:
97.6% (2,583)Foreign-born:
35.6% (71)
White alone - Speak another language Native:
2.5% (67)Foreign-born:
61.0% (122)
Hispanic or Latino - Speak only English Native:
29.6% (2,442)Foreign-born:
5.7% (149)
Hispanic or Latino - Speak another language Native:
69.2% (5,721)Foreign-born:
94.2% (2,462)
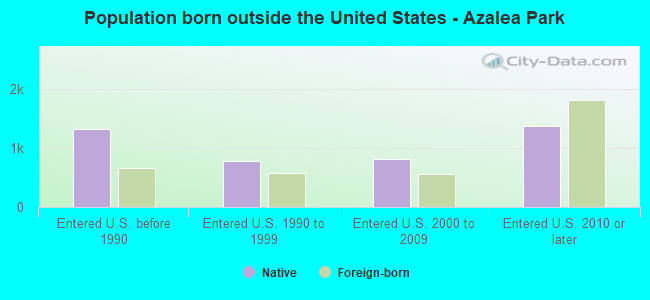
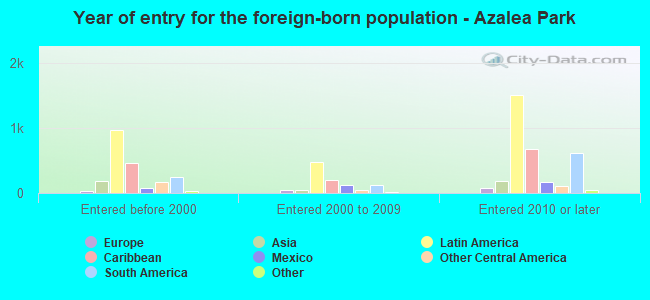
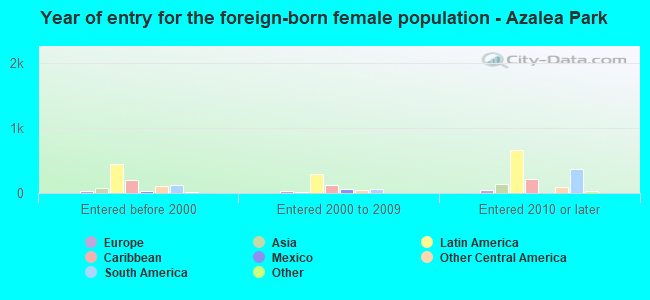
Foreign-born residents in Azalea Park 3,511 residents are foreign born (17.0% Latin America , 2.3% Asia ).
This city:
21.5%Florida:
21.1%
Marital status for residents in Azalea Park Marital status - White (Caucasian) population 15 years and over
Males 37.0% Never married42.5% Now married2.5% Separated1.5% Widowed16.5% DivorcedFemales 31.9% Never married44.0% Now married0.6% Separated5.7% Widowed17.8% DivorcedWomen who gave birth in the past 12 months Now married:
14.6% (5)Unmarried:
85.4% (28)
Women who did not give birth in the past 12 months Now married:
37.5% (478)Unmarried:
62.5% (797)
Marital status - Black or African American population 15 years and over
Males 45.1% Never married50.1% Now married0.0% Separated0.0% Widowed4.7% DivorcedFemales 38.6% Never married39.8% Now married7.7% Separated4.6% Widowed9.3% DivorcedWomen who gave birth in the past 12 months Now married:
100.0% (16)Unmarried:
0.0% (0)
Women who did not give birth in the past 12 months Now married:
45.9% (187)Unmarried:
54.1% (220)
Marital status - Asian population 15 years and over
Males 31.1% Never married66.0% Now married0.0% Separated0.0% Widowed2.9% DivorcedFemales 39.3% Never married51.8% Now married2.0% Separated0.0% Widowed6.9% DivorcedWomen who gave birth in the past 12 months Now married:
69.6% (32)Unmarried:
30.4% (14)
Women who did not give birth in the past 12 months Now married:
37.2% (56)Unmarried:
62.8% (94)
Marital status - Native Hawaiian / Pacific Islander population 15 years and over
Males 100.0% Never married0.0% Now married0.0% Separated0.0% Widowed0.0% DivorcedFemales 0.0% Never married0.0% Now married0.0% Separated100.0% Widowed0.0% DivorcedMarital status - Other race population 15 years and over
Males 53.7% Never married43.9% Now married0.7% Separated1.0% Widowed0.6% DivorcedFemales 29.4% Never married27.2% Now married0.0% Separated22.5% Widowed20.9% DivorcedWomen who gave birth in the past 12 months Now married:
0.0% (0)Unmarried:
100.0% (21)
Women who did not give birth in the past 12 months Now married:
44.2% (302)Unmarried:
55.8% (381)
Marital status - Two or more races population 15 years and over
Males 48.1% Never married36.3% Now married0.0% Separated0.0% Widowed15.6% DivorcedFemales 39.7% Never married45.0% Now married3.1% Separated6.6% Widowed5.6% DivorcedWomen who gave birth in the past 12 months Now married:
72.4% (109)Unmarried:
27.6% (42)
Women who did not give birth in the past 12 months Now married:
32.0% (425)Unmarried:
68.0% (905)
Marital status - White alone, not Hispanic / Latino population 15 years and over
Males 26.8% Never married49.7% Now married1.6% Separated3.2% Widowed18.8% DivorcedFemales 27.8% Never married47.0% Now married0.0% Separated8.8% Widowed16.3% DivorcedWomen who gave birth in the past 12 months Now married:
28.6% (6)Unmarried:
71.4% (14)
Women who did not give birth in the past 12 months Now married:
39.8% (250)Unmarried:
60.2% (379)
Marital status - Hispanic or Latino population 15 years and over
Males 48.4% Never married39.4% Now married1.2% Separated0.3% Widowed10.8% DivorcedFemales 34.1% Never married39.4% Now married2.5% Separated9.4% Widowed14.6% DivorcedWomen who gave birth in the past 12 months Now married:
59.0% (93)Unmarried:
41.0% (65)
Women who did not give birth in the past 12 months Now married:
38.8% (948)Unmarried:
61.2% (1,493)
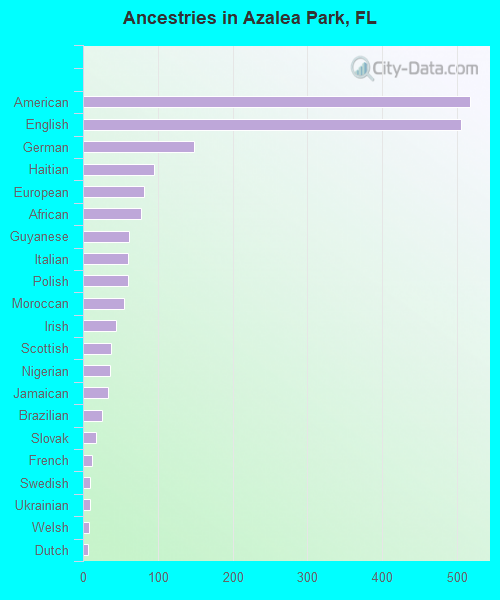
Ancestries in Azalea Park
517 5.7% American506 5.6% English149 1.6% German95 1.0% Haitian81 0.9% European77 0.8% African61 0.7% Guyanese60 0.7% Italian60 0.7% Polish55 0.6% Moroccan44 0.5% Irish37 0.4% Scottish36 0.4% Nigerian33 0.4% Jamaican26 0.3% Brazilian17 0.2% Slovak12 0.1% French10 0.1% Swedish9 0.10% Ukrainian8 0.09% Welsh7 0.08% Dutch
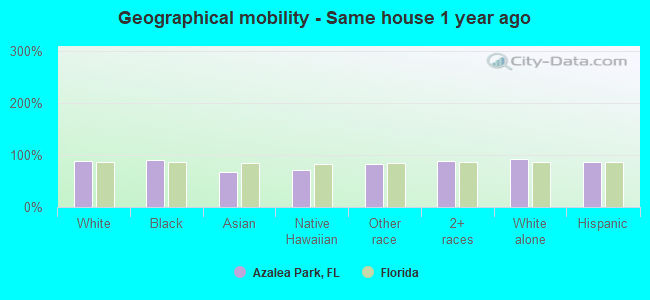
Geographical mobility in Azalea Park Same house 1 year ago 5,220 89.6% White (Caucasian)1,403 90.3% Black or African American413 67.9% Asian61 72.1% Native Hawaiian / Pacific Islander3,126 82.2% Other race5,027 89.0% Two or more races2,687 92.6% White alone, not Hispanic / Latino9,780 86.3% Hispanic or LatinoMoved within same county 274 4.7% White / Caucasian136 8.8% Black or African American116 19.1% Asian28 33.2% Native Hawaiian / Pacific Islander366 9.6% Other race277 4.9% Two or more races56 1.9% White alone, not Hispanic / Latino789 7.0% Hispanic or LatinoMoved within same state 214 3.7% White / Caucasian31 5.1% Asian328 8.6% Other race200 3.5% Two or more races110 3.8% White alone, not Hispanic / Latino485 4.3% Hispanic or LatinoMoved from different state 123 2.1% White / Caucasian28 4.6% Asian50 0.9% Two or more races70 2.4% White alone, not Hispanic / Latino136 1.2% Hispanic or LatinoMoved from abroad 24 1.6% Black or African American132 2.3% Two or more races88 0.8% Hispanic or Latino
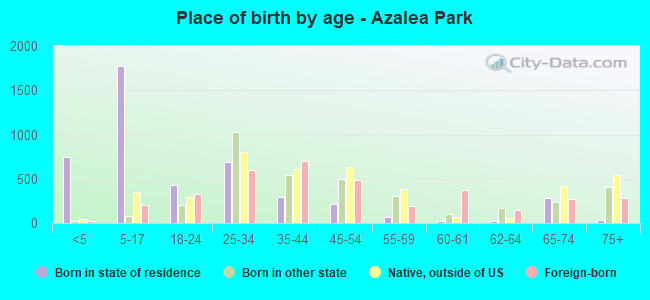
Children Nativity (place of birth) in Azalea Park
Children under 6 years - Living with two parents Both parents native 175 100.0% NativeBoth parents foreign-born 120 92.9% Native9 7.1% Foreign-bornOne native, one foreign-born parent 74 100.0% NativeChildren under 6 years - Living with one parent Native parent 362 99.9% Native0 0.1% Foreign-bornForeign-born parent 129 94.3% Native8 5.7% Foreign-bornChildren 6 to 17 years - Living with two parents Both parents native 770 99.9% Native1 0.1% Foreign-bornBoth parents foreign-born 139 53.7% Native120 46.3% Foreign-bornOne native, one foreign-born parent 96 100.0% NativeChildren 6 to 17 years - Living with one parent Native parent 642 100.0% NativeForeign-born parent 284 56.1% Native222 43.9% Foreign-born
Grandparents responsible for own grandchildren in Azalea Park
Grandparents (30 to 59 years) White / Caucasian 36 100.0% Not responsible for grandchildrenBlack or African American 35 100.0% Responsible for grandchildrenTwo or more races 27 27.7% Responsible for grandchildren71 72.3% Not responsible for grandchildrenWhite alone, not Hispanic / Latino 5 100.0% Not responsible for grandchildrenHispanic or Latino 24 20.2% Responsible for grandchildren94 79.8% Not responsible for grandchildrenGrandparents (60 years and over) White / Caucasian 3 5.1% Responsible for grandchildren58 94.9% Not responsible for grandchildrenTwo or more races 309 100.0% Not responsible for grandchildrenWhite alone, not Hispanic / Latino 5 100.0% Responsible for grandchildrenHispanic or Latino 299 100.0% Not responsible for grandchildren