Races in Avon Park, Florida (FL) Detailed Stats
Data:
Races - White alone (%)
Races - White alone (% change since 2000)
Races - Black alone (%)
Races - Black alone (% change since 2000)
Races - American Indian alone (%)
Races - American Indian alone (% change since 2000)
Races - Asian alone (%)
Races - Asian alone (% change since 2000)
Races - Hispanic (%)
Races - Hispanic (% change since 2000)
Races - Native Hawaiian and Other Pacific Islander alone (%)
Races - Native Hawaiian and Other Pacific Islander alone (% change since 2000)
Races - Two or more races(%)
Races - Two or more races(% change since 2000)
Races - Other race alone (%)
Races - Other race alone (% change since 2000)
Racial diversity
Place of birth - Born in state of residence (%)
Place of birth - Born in state of residence (%) - White
Place of birth - Born in state of residence (%) - Black or African American
Place of birth - Born in state of residence (%) - Asian
Place of birth - Born in state of residence (%) - Hispanic or Latino
Place of birth - Born in state of residence (%) - American Indian and Alaska Native
Place of birth - Born in state of residence (%) - Multirace
Place of birth - Born in state of residence (%) - Other Race
Place of birth - Born in other state (%)
Place of birth - Born in other state (%) - White
Place of birth - Born in other state (%) - Black or African American
Place of birth - Born in other state (%) - Asian
Place of birth - Born in other state (%) - Hispanic or Latino
Place of birth - Born in other state (%) - American Indian and Alaska Native
Place of birth - Born in other state (%) - Multirace
Place of birth - Born in other state (%) - Other Race
Place of birth - Native, outside of US (%)
Place of birth - Native, outside of US (%) - White
Place of birth - Native, outside of US (%) - Black or African American
Place of birth - Native, outside of US (%) - Asian
Place of birth - Native, outside of US (%) - Hispanic or Latino
Place of birth - Native, outside of US (%) - American Indian and Alaska Native
Place of birth - Native, outside of US (%) - Multirace
Place of birth - Native, outside of US (%) - Other Race
Place of birth - Foreign born (%)
Place of birth - Foreign born (%) - White
Place of birth - Foreign born (%) - Black or African American
Place of birth - Foreign born (%) - Asian
Place of birth - Foreign born (%) - Hispanic or Latino
Place of birth - Foreign born (%) - American Indian and Alaska Native
Place of birth - Foreign born (%) - Multirace
Place of birth - Foreign born (%) - Other Race
Residents speaking English at home (%)
Residents speaking English at home - Born in the United States (%)
Residents speaking English at home - Native, born elsewhere (%)
Residents speaking English at home - Foreign born (%)
Residents speaking Spanish at home (%)
Residents speaking Spanish at home - Born in the United States (%)
Residents speaking Spanish at home - Native, born elsewhere (%)
Residents speaking Spanish at home - Foreign born (%)
Residents speaking other language at home (%)
Residents speaking other language at home - Born in the United States (%)
Residents speaking other language at home - Native, born elsewhere (%)
Residents speaking other language at home - Foreign born (%)
Marital status - Never married (%)
Marital status - Now married (%)
Marital status - Separated (%)
Marital status - Widowed (%)
Marital status - Divorced (%)
Ancestries Reported - Arab (%)
Ancestries Reported - Czech (%)
Ancestries Reported - Danish (%)
Ancestries Reported - Dutch (%)
Ancestries Reported - English (%)
Ancestries Reported - French (%)
Ancestries Reported - French Canadian (%)
Ancestries Reported - German (%)
Ancestries Reported - Greek (%)
Ancestries Reported - Hungarian (%)
Ancestries Reported - Irish (%)
Ancestries Reported - Italian (%)
Ancestries Reported - Lithuanian (%)
Ancestries Reported - Norwegian (%)
Ancestries Reported - Polish (%)
Ancestries Reported - Portuguese (%)
Ancestries Reported - Russian (%)
Ancestries Reported - Scotch-Irish (%)
Ancestries Reported - Scottish (%)
Ancestries Reported - Slovak (%)
Ancestries Reported - Subsaharan African (%)
Ancestries Reported - Swedish (%)
Ancestries Reported - Swiss (%)
Ancestries Reported - Ukrainian (%)
Ancestries Reported - United States (%)
Ancestries Reported - Welsh (%)
Ancestries Reported - West Indian (%)
Ancestries Reported - Other (%)
Geographical mobility - Same house 1 year ago (%)
Geographical mobility - Same house 1 year ago (%) - White
Geographical mobility - Same house 1 year ago (%) - Black or African American
Geographical mobility - Same house 1 year ago (%) - Asian
Geographical mobility - Same house 1 year ago (%) - Hispanic or Latino
Geographical mobility - Same house 1 year ago (%) - American Indian and Alaska Native
Geographical mobility - Same house 1 year ago (%) - Multirace
Geographical mobility - Same house 1 year ago (%) - Other Race
Geographical mobility - Moved within same county (%)
Geographical mobility - Moved within same county (%) - White
Geographical mobility - Moved within same county (%) - Black or African American
Geographical mobility - Moved within same county (%) - Asian
Geographical mobility - Moved within same county (%) - Hispanic or Latino
Geographical mobility - Moved within same county (%) - American Indian and Alaska Native
Geographical mobility - Moved within same county (%) - Multirace
Geographical mobility - Moved within same county (%) - Other Race
Geographical mobility - Moved from different county within same state (%)
Geographical mobility - Moved from different county within same state (%) - White
Geographical mobility - Moved from different county within same state (%) - Black or African American
Geographical mobility - Moved from different county within same state (%) - Asian
Geographical mobility - Moved from different county within same state (%) - Hispanic or Latino
Geographical mobility - Moved from different county within same state (%) - American Indian and Alaska Native
Geographical mobility - Moved from different county within same state (%) - Multirace
Geographical mobility - Moved from different county within same state (%) - Other Race
Geographical mobility - Moved from different state (%)
Geographical mobility - Moved from different state (%) - White
Geographical mobility - Moved from different state (%) - Black or African American
Geographical mobility - Moved from different state (%) - Asian
Geographical mobility - Moved from different state (%) - Hispanic or Latino
Geographical mobility - Moved from different state (%) - American Indian and Alaska Native
Geographical mobility - Moved from different state (%) - Multirace
Geographical mobility - Moved from different state (%) - Other Race
Geographical mobility - Moved from abroad (%)
Geographical mobility - Moved from abroad (%) - White
Geographical mobility - Moved from abroad (%) - Black or African American
Geographical mobility - Moved from abroad (%) - Asian
Geographical mobility - Moved from abroad (%) - Hispanic or Latino
Geographical mobility - Moved from abroad (%) - American Indian and Alaska Native
Geographical mobility - Moved from abroad (%) - Multirace
Geographical mobility - Moved from abroad (%) - Other Race
Place of birth for the foreign-born population - Ireland (%)
Place of birth for the foreign-born population - Denmark (%)
Place of birth for the foreign-born population - Norway (%)
Place of birth for the foreign-born population - Sweden (%)
Place of birth for the foreign-born population - United Kingdom (%)
Place of birth for the foreign-born population - England (%)
Place of birth for the foreign-born population - Scotland (%)
Place of birth for the foreign-born population - Other Northern Europe (%)
Place of birth for the foreign-born population - Austria (%)
Place of birth for the foreign-born population - Belgium (%)
Place of birth for the foreign-born population - France (%)
Place of birth for the foreign-born population - Germany (%)
Place of birth for the foreign-born population - Netherlands (%)
Place of birth for the foreign-born population - Switzerland (%)
Place of birth for the foreign-born population - Other Western Europe (%)
Place of birth for the foreign-born population - Greece (%)
Place of birth for the foreign-born population - Italy (%)
Place of birth for the foreign-born population - Portugal (%)
Place of birth for the foreign-born population - Spain (%)
Place of birth for the foreign-born population - Other Southern Europe (%)
Place of birth for the foreign-born population - Albania (%)
Place of birth for the foreign-born population - Belarus (%)
Place of birth for the foreign-born population - Bosnia and Herzegovina (%)
Place of birth for the foreign-born population - Bulgaria (%)
Place of birth for the foreign-born population - Croatia (%)
Place of birth for the foreign-born population - Czechoslovakia (%)
Place of birth for the foreign-born population - Hungary (%)
Place of birth for the foreign-born population - Latvia (%)
Place of birth for the foreign-born population - Lithuania (%)
Place of birth for the foreign-born population - North Macedonia (Macedonia) (%)
Place of birth for the foreign-born population - Moldova (%)
Place of birth for the foreign-born population - Poland (%)
Place of birth for the foreign-born population - Romania (%)
Place of birth for the foreign-born population - Russia (%)
Place of birth for the foreign-born population - Serbia (%)
Place of birth for the foreign-born population - Ukraine (%)
Place of birth for the foreign-born population - Other Eastern Europe (%)
Place of birth for the foreign-born population - China (%)
Place of birth for the foreign-born population - Hong Kong (%)
Place of birth for the foreign-born population - Taiwan (%)
Place of birth for the foreign-born population - Japan (%)
Place of birth for the foreign-born population - Korea (%)
Place of birth for the foreign-born population - Other Eastern Asia (%)
Place of birth for the foreign-born population - Afghanistan (%)
Place of birth for the foreign-born population - Bangladesh (%)
Place of birth for the foreign-born population - India (%)
Place of birth for the foreign-born population - Iran (%)
Place of birth for the foreign-born population - Kazakhstan (%)
Place of birth for the foreign-born population - Nepal (%)
Place of birth for the foreign-born population - Pakistan (%)
Place of birth for the foreign-born population - Sri Lanka (%)
Place of birth for the foreign-born population - Uzbekistan (%)
Place of birth for the foreign-born population - Other South Central Asia (%)
Place of birth for the foreign-born population - Burma (%)
Place of birth for the foreign-born population - Cambodia (%)
Place of birth for the foreign-born population - Indonesia (%)
Place of birth for the foreign-born population - Laos (%)
Place of birth for the foreign-born population - Malaysia (%)
Place of birth for the foreign-born population - Philippines (%)
Place of birth for the foreign-born population - Singapore (%)
Place of birth for the foreign-born population - Thailand (%)
Place of birth for the foreign-born population - Vietnam (%)
Place of birth for the foreign-born population - Other South Eastern Asia (%)
Place of birth for the foreign-born population - Armenia (%)
Place of birth for the foreign-born population - Iraq (%)
Place of birth for the foreign-born population - Israel (%)
Place of birth for the foreign-born population - Jordan (%)
Place of birth for the foreign-born population - Kuwait (%)
Place of birth for the foreign-born population - Lebanon (%)
Place of birth for the foreign-born population - Saudi Arabia (%)
Place of birth for the foreign-born population - Syria (%)
Place of birth for the foreign-born population - Turkey (%)
Place of birth for the foreign-born population - Yemen (%)
Place of birth for the foreign-born population - Other Western Asia (%)
Place of birth for the foreign-born population - Eritrea (%)
Place of birth for the foreign-born population - Ethiopia (%)
Place of birth for the foreign-born population - Kenya (%)
Place of birth for the foreign-born population - Somalia (%)
Place of birth for the foreign-born population - Uganda (%)
Place of birth for the foreign-born population - Zimbabwe (%)
Place of birth for the foreign-born population - Other Eastern Africa (%)
Place of birth for the foreign-born population - Cameroon (%)
Place of birth for the foreign-born population - Congo (%)
Place of birth for the foreign-born population - Democratic Republic of Congo (Zaire) (%)
Place of birth for the foreign-born population - Other Middle Africa (%)
Place of birth for the foreign-born population - Egypt (%)
Place of birth for the foreign-born population - Morocco (%)
Place of birth for the foreign-born population - Sudan (%)
Place of birth for the foreign-born population - Other Northern Africa (%)
Place of birth for the foreign-born population - South Africa (%)
Place of birth for the foreign-born population - Other Southern Africa (%)
Place of birth for the foreign-born population - Cabo Verde (%)
Place of birth for the foreign-born population - Ghana (%)
Place of birth for the foreign-born population - Liberia (%)
Place of birth for the foreign-born population - Nigeria (%)
Place of birth for the foreign-born population - Senegal (%)
Place of birth for the foreign-born population - Sierra Leone (%)
Place of birth for the foreign-born population - Other Western Africa (%)
Place of birth for the foreign-born population - Australia (%)
Place of birth for the foreign-born population - New Zealand (%)
Place of birth for the foreign-born population - Fiji (%)
Place of birth for the foreign-born population - Micronesia (%)
Place of birth for the foreign-born population - Bahamas (%)
Place of birth for the foreign-born population - Barbados (%)
Place of birth for the foreign-born population - Cuba (%)
Place of birth for the foreign-born population - Dominica (%)
Place of birth for the foreign-born population - Dominican Republic (%)
Place of birth for the foreign-born population - Grenada (%)
Place of birth for the foreign-born population - Haiti (%)
Place of birth for the foreign-born population - Jamaica (%)
Place of birth for the foreign-born population - St. Vincent and the Grenadines (%)
Place of birth for the foreign-born population - Trinidad and Tobago (%)
Place of birth for the foreign-born population - West Indies (%)
Place of birth for the foreign-born population - Other Caribbean (%)
Place of birth for the foreign-born population - Belize (%)
Place of birth for the foreign-born population - Costa Rica (%)
Place of birth for the foreign-born population - El Salvador (%)
Place of birth for the foreign-born population - Guatemala (%)
Place of birth for the foreign-born population - Honduras (%)
Place of birth for the foreign-born population - Mexico (%)
Place of birth for the foreign-born population - Nicaragua (%)
Place of birth for the foreign-born population - Panama (%)
Place of birth for the foreign-born population - Other Central America (%)
Place of birth for the foreign-born population - Argentina (%)
Place of birth for the foreign-born population - Bolivia (%)
Place of birth for the foreign-born population - Brazil (%)
Place of birth for the foreign-born population - Chile (%)
Place of birth for the foreign-born population - Colombia (%)
Place of birth for the foreign-born population - Ecuador (%)
Place of birth for the foreign-born population - Guyana (%)
Place of birth for the foreign-born population - Peru (%)
Place of birth for the foreign-born population - Uruguay (%)
Place of birth for the foreign-born population - Venezuela (%)
Place of birth for the foreign-born population - Other South America (%)
Place of birth for the foreign-born population - Canada (%)
Place of birth for the foreign-born population - Other Northern America (%)
Place of birth for the foreign-born population - Other (%)
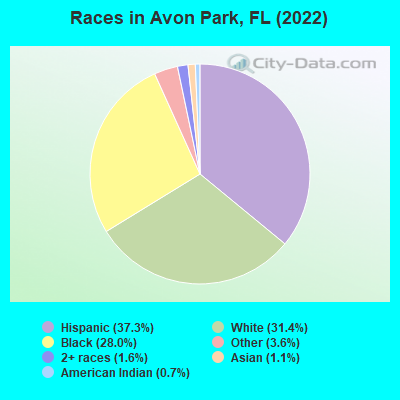
According to 2022 data, the most numerous races in Avon Park, FL are White alone (3,169 residents), Hispanic (3,766 residents), and Black alone (2,825 residents). 64.3% of Avon Park residents speak English at home. 14.2% of Avon Park, FL residents are foreign-born (12.0% born in Latin America), which is 47.8% less than the foreign-born rate of 21.0% across the entire state of Florida.
Race distribution in Avon Park
2000 2022
10,458,509 65.4% White alone 2,682,715 16.8% Hispanic 2,264,268 14.2% Black alone 261,693 1.6% Asian alone 236,954 1.5% Two or more races 42,358 0.3% American Indian alone 28,994 0.2% Other race alone 6,887 0.04% Native Hawaiian and Other
11,309,403 50.8% White alone 6,025,039 27.1% Hispanic 3,241,015 14.6% Black alone 861,630 3.9% Two or more races 623,692 2.8% Asian alone 152,054 0.7% Other race alone 22,504 0.1% American Indian alone 9,486 0.04% Native Hawaiian and Other
Income and house value in Avon Park Median household income in 2022 $50,561 White non-Hispanic householders$40,066 Black householders$20,969 Asian householders$27,219 Some other race householders$28,559 Two or more races householders$28,897 Hispanic or Latino race householdersMedian 2022 house value $137,244 White Non-Hispanic householders$98,221 Black or African American householders $79,638 Asian householders$59,729 Some other race householders$122,112 Two or more races householders$88,399 Hispanic or Latino householders
Median age by race in Avon Park
54.7 Median age for White residents54.8 57.8 34.3 Median age for Black or African American residents28.4 40.9 -918,387,413.0 Median age for American Indian / Alaska Native residents-1,043,771,042.7 -1,066,339,065.3 72.2 Median age for Asian residents-668,013,467.3 -783,988,957.1 -666,666,666.0 Median age for Native Hawaiian / Pacific Islander residents-666,666,666.0 -666,666,666.0 37.2 Median age for Other race residents34.4 43.4 51.6 Median age for Two or more races residents66.3 49.3 64.1 Median age for White alone residents63.8 66.5 33.6 Median age for Hispanic or Latino residents33.8 35.0
Owner/renter occupied households by race in Avon Park
House owners and renters - White residents 1,307 69.8% Owner occupied565 30.2% Renter occupiedHouse owners and renters - Black or African American residents 568 49.0% Owner occupied591 51.0% Renter occupiedHouse owners and renters - Asian residents 52 73.0% Owner occupied19 27.0% Renter occupiedHouse owners and renters - Other race residents 510 59.3% Owner occupied351 40.7% Renter occupiedHouse owners and renters - Two or more races residents 179 41.2% Owner occupied255 58.8% Renter occupiedHouse owners and renters - White alone residents 1,125 75.7% Owner occupied360 24.3% Renter occupiedHouse owners and renters - Hispanic or Latino residents 665 52.7% Owner occupied596 47.3% Renter occupied
Language usage in Avon Park
English speakers - Total 64.3% of residents of Avon Park speak English at home.
32.0% of residents speak Spanish at home 1,475 48.4% Speak English very well1,571 51.6% Speak English less than very well3.5% of residents speak other language at home 197 58.6% Speak English very well139 41.4% Speak English less than very well
English speakers - Born in the United States 82.2% of residents of Avon Park speak English at home.
16.3% of residents speak Spanish at home 432 83.2% Speak English very well87 16.8% Speak English less than very well1.3% of residents speak other language at home 42 100.0% Speak English very well
English speakers - Native, born elsewhere 7.9% of residents of Avon Park speak English at home.
87.5% of residents speak Spanish at home 278 34.0% Speak English very well539 66.0% Speak English less than very well0.9% of residents speak other language at home 3 37.5% Speak English very well5 62.5% Speak English less than very well
English speakers - Foreign-born 9.6% of residents of Avon Park speak English at home.
74.5% of residents speak Spanish at home 132 13.2% Speak English very well865 86.8% Speak English less than very well18.7% of residents speak other language at home 121 48.4% Speak English very well129 51.6% Speak English less than very well
White (Caucasian) - Speak only English Native:
87.7% (3,146)Foreign-born:
9.0% (22)
White (Caucasian) - Speak another language Native:
8.1% (292)Foreign-born:
98.4% (237)
Black or African American - Speak only English Native:
99.0% (2,070)Foreign-born:
33.2% (53)
Black or African American - Speak another language Native:
0.8% (16)Foreign-born:
67.3% (107)
Asian - Speak another language Native:
97.5% (25)Foreign-born:
93.3% (95)
Other race - Speak only English Native:
46.8% (781)Foreign-born:
1.9% (6)
Other race - Speak another language Native:
54.7% (913)Foreign-born:
99.7% (309)
Two or more races - Speak another language Native:
54.7% (547)Foreign-born:
98.5% (391)
White alone - Speak only English Native:
99.0% (2,945)Foreign-born:
39.2% (24)
White alone - Speak another language Native:
1.1% (32)Foreign-born:
85.1% (52)
Hispanic or Latino - Speak only English Native:
17.3% (471)Foreign-born:
1.4% (13)
Hispanic or Latino - Speak another language Native:
76.0% (2,072)Foreign-born:
98.5% (929)
Foreign-born residents in Avon Park 1,435 residents are foreign born (12.0% Latin America ).
This city:
14.2%Florida:
21.1%
Marital status for residents in Avon Park Marital status - White (Caucasian) population 15 years and over
Males 29.1% Never married51.8% Now married2.0% Separated5.8% Widowed11.2% DivorcedFemales 19.3% Never married45.4% Now married5.1% Separated15.8% Widowed14.4% DivorcedWomen who did not give birth in the past 12 months Now married:
36.2% (252)Unmarried:
63.8% (445)
Marital status - Black or African American population 15 years and over
Males 51.9% Never married41.5% Now married0.0% Separated0.0% Widowed6.6% DivorcedFemales 50.4% Never married22.7% Now married3.7% Separated2.8% Widowed20.4% DivorcedWomen who gave birth in the past 12 months Now married:
100.0% (9)Unmarried:
0.0% (0)
Women who did not give birth in the past 12 months Now married:
21.7% (158)Unmarried:
78.3% (572)
Marital status - Asian population 15 years and over
Males 0.0% Never married100.0% Now married0.0% Separated0.0% Widowed0.0% DivorcedFemales 0.0% Never married100.0% Now married0.0% Separated0.0% Widowed0.0% DivorcedWomen who did not give birth in the past 12 months Now married:
100.0% (26)Unmarried:
0.0% (0)
Marital status - Other race population 15 years and over
Males 46.0% Never married44.9% Now married0.0% Separated6.0% Widowed3.1% DivorcedFemales 43.1% Never married38.3% Now married3.0% Separated3.0% Widowed12.6% DivorcedWomen who did not give birth in the past 12 months Now married:
30.1% (206)Unmarried:
69.9% (479)
Marital status - Two or more races population 15 years and over
Males 35.6% Never married55.2% Now married0.0% Separated0.0% Widowed9.2% DivorcedFemales 37.0% Never married32.2% Now married10.7% Separated4.7% Widowed15.4% DivorcedWomen who did not give birth in the past 12 months Now married:
19.2% (42)Unmarried:
80.8% (178)
Marital status - White alone, not Hispanic / Latino population 15 years and over
Males 19.7% Never married57.5% Now married3.0% Separated8.6% Widowed11.2% DivorcedFemales 11.9% Never married50.5% Now married4.2% Separated16.6% Widowed16.7% DivorcedWomen who did not give birth in the past 12 months Now married:
36.2% (163)Unmarried:
63.8% (288)
Marital status - Hispanic or Latino population 15 years and over
Males 48.9% Never married39.7% Now married0.0% Separated3.2% Widowed8.3% DivorcedFemales 46.7% Never married26.8% Now married6.8% Separated6.7% Widowed13.0% DivorcedWomen who did not give birth in the past 12 months Now married:
29.4% (278)Unmarried:
70.6% (668)
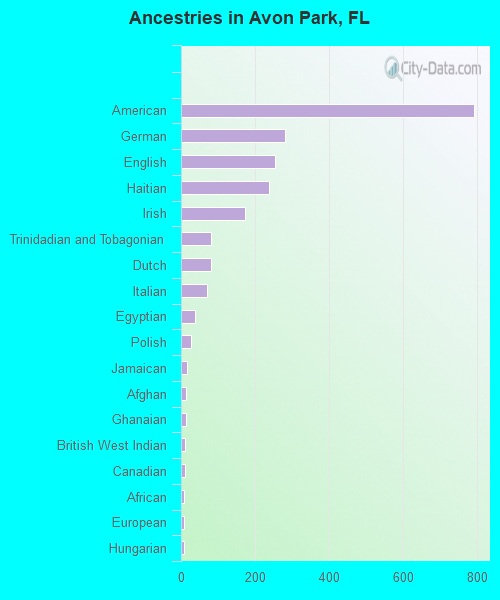
Ancestries in Avon Park
794 11.3% American282 4.0% German255 3.6% English238 3.4% Haitian172 2.4% Irish82 1.2% Trinidadian and Tobagonian80 1.1% Dutch71 1.0% Italian39 0.6% Egyptian28 0.4% Polish17 0.2% Jamaican13 0.2% Afghan13 0.2% Ghanaian11 0.2% British West Indian10 0.1% Canadian9 0.1% African8 0.1% European8 0.1% Hungarian7 0.10% Swedish6 0.09% French Canadian5 0.07% Portuguese5 0.07% Welsh5 0.07% West Indian4 0.06% French4 0.06% Scotch-Irish4 0.06% Scottish
Children Nativity (place of birth) in Avon Park
Children under 6 years - Living with two parents Both parents native 149 100.0% NativeBoth parents foreign-born 59 72.1% Native23 27.9% Foreign-bornOne native, one foreign-born parent 30 100.0% NativeChildren under 6 years - Living with one parent Native parent 377 100.0% NativeForeign-born parent 82 100.0% NativeChildren 6 to 17 years - Living with two parents Both parents native 315 100.0% NativeBoth parents foreign-born 16 100.0% Foreign-bornOne native, one foreign-born parent 185 100.0% NativeChildren 6 to 17 years - Living with one parent Native parent 430 100.0% NativeForeign-born parent 380 50.6% Native371 49.4% Foreign-born
Grandparents responsible for own grandchildren in Avon Park
Grandparents (30 to 59 years) Black or African American 40 100.0% Responsible for grandchildrenOther race 99 79.5% Responsible for grandchildren25 20.5% Not responsible for grandchildrenHispanic or Latino 77 80.4% Responsible for grandchildren19 19.6% Not responsible for grandchildren
Grandparents (60 years and over) Black or African American 4 100.0% Responsible for grandchildrenHispanic or Latino 22 100.0% Responsible for grandchildren