Races in Aventura, Florida (FL) Detailed Stats
Data:
Races - White alone (%)
Races - White alone (% change since 2000)
Races - Black alone (%)
Races - Black alone (% change since 2000)
Races - American Indian alone (%)
Races - American Indian alone (% change since 2000)
Races - Asian alone (%)
Races - Asian alone (% change since 2000)
Races - Hispanic (%)
Races - Hispanic (% change since 2000)
Races - Native Hawaiian and Other Pacific Islander alone (%)
Races - Native Hawaiian and Other Pacific Islander alone (% change since 2000)
Races - Two or more races(%)
Races - Two or more races(% change since 2000)
Races - Other race alone (%)
Races - Other race alone (% change since 2000)
Racial diversity
Place of birth - Born in state of residence (%)
Place of birth - Born in state of residence (%) - White
Place of birth - Born in state of residence (%) - Black or African American
Place of birth - Born in state of residence (%) - Asian
Place of birth - Born in state of residence (%) - Hispanic or Latino
Place of birth - Born in state of residence (%) - American Indian and Alaska Native
Place of birth - Born in state of residence (%) - Multirace
Place of birth - Born in state of residence (%) - Other Race
Place of birth - Born in other state (%)
Place of birth - Born in other state (%) - White
Place of birth - Born in other state (%) - Black or African American
Place of birth - Born in other state (%) - Asian
Place of birth - Born in other state (%) - Hispanic or Latino
Place of birth - Born in other state (%) - American Indian and Alaska Native
Place of birth - Born in other state (%) - Multirace
Place of birth - Born in other state (%) - Other Race
Place of birth - Native, outside of US (%)
Place of birth - Native, outside of US (%) - White
Place of birth - Native, outside of US (%) - Black or African American
Place of birth - Native, outside of US (%) - Asian
Place of birth - Native, outside of US (%) - Hispanic or Latino
Place of birth - Native, outside of US (%) - American Indian and Alaska Native
Place of birth - Native, outside of US (%) - Multirace
Place of birth - Native, outside of US (%) - Other Race
Place of birth - Foreign born (%)
Place of birth - Foreign born (%) - White
Place of birth - Foreign born (%) - Black or African American
Place of birth - Foreign born (%) - Asian
Place of birth - Foreign born (%) - Hispanic or Latino
Place of birth - Foreign born (%) - American Indian and Alaska Native
Place of birth - Foreign born (%) - Multirace
Place of birth - Foreign born (%) - Other Race
Residents speaking English at home (%)
Residents speaking English at home - Born in the United States (%)
Residents speaking English at home - Native, born elsewhere (%)
Residents speaking English at home - Foreign born (%)
Residents speaking Spanish at home (%)
Residents speaking Spanish at home - Born in the United States (%)
Residents speaking Spanish at home - Native, born elsewhere (%)
Residents speaking Spanish at home - Foreign born (%)
Residents speaking other language at home (%)
Residents speaking other language at home - Born in the United States (%)
Residents speaking other language at home - Native, born elsewhere (%)
Residents speaking other language at home - Foreign born (%)
Marital status - Never married (%)
Marital status - Now married (%)
Marital status - Separated (%)
Marital status - Widowed (%)
Marital status - Divorced (%)
Ancestries Reported - Arab (%)
Ancestries Reported - Czech (%)
Ancestries Reported - Danish (%)
Ancestries Reported - Dutch (%)
Ancestries Reported - English (%)
Ancestries Reported - French (%)
Ancestries Reported - French Canadian (%)
Ancestries Reported - German (%)
Ancestries Reported - Greek (%)
Ancestries Reported - Hungarian (%)
Ancestries Reported - Irish (%)
Ancestries Reported - Italian (%)
Ancestries Reported - Lithuanian (%)
Ancestries Reported - Norwegian (%)
Ancestries Reported - Polish (%)
Ancestries Reported - Portuguese (%)
Ancestries Reported - Russian (%)
Ancestries Reported - Scotch-Irish (%)
Ancestries Reported - Scottish (%)
Ancestries Reported - Slovak (%)
Ancestries Reported - Subsaharan African (%)
Ancestries Reported - Swedish (%)
Ancestries Reported - Swiss (%)
Ancestries Reported - Ukrainian (%)
Ancestries Reported - United States (%)
Ancestries Reported - Welsh (%)
Ancestries Reported - West Indian (%)
Ancestries Reported - Other (%)
Geographical mobility - Same house 1 year ago (%)
Geographical mobility - Same house 1 year ago (%) - White
Geographical mobility - Same house 1 year ago (%) - Black or African American
Geographical mobility - Same house 1 year ago (%) - Asian
Geographical mobility - Same house 1 year ago (%) - Hispanic or Latino
Geographical mobility - Same house 1 year ago (%) - American Indian and Alaska Native
Geographical mobility - Same house 1 year ago (%) - Multirace
Geographical mobility - Same house 1 year ago (%) - Other Race
Geographical mobility - Moved within same county (%)
Geographical mobility - Moved within same county (%) - White
Geographical mobility - Moved within same county (%) - Black or African American
Geographical mobility - Moved within same county (%) - Asian
Geographical mobility - Moved within same county (%) - Hispanic or Latino
Geographical mobility - Moved within same county (%) - American Indian and Alaska Native
Geographical mobility - Moved within same county (%) - Multirace
Geographical mobility - Moved within same county (%) - Other Race
Geographical mobility - Moved from different county within same state (%)
Geographical mobility - Moved from different county within same state (%) - White
Geographical mobility - Moved from different county within same state (%) - Black or African American
Geographical mobility - Moved from different county within same state (%) - Asian
Geographical mobility - Moved from different county within same state (%) - Hispanic or Latino
Geographical mobility - Moved from different county within same state (%) - American Indian and Alaska Native
Geographical mobility - Moved from different county within same state (%) - Multirace
Geographical mobility - Moved from different county within same state (%) - Other Race
Geographical mobility - Moved from different state (%)
Geographical mobility - Moved from different state (%) - White
Geographical mobility - Moved from different state (%) - Black or African American
Geographical mobility - Moved from different state (%) - Asian
Geographical mobility - Moved from different state (%) - Hispanic or Latino
Geographical mobility - Moved from different state (%) - American Indian and Alaska Native
Geographical mobility - Moved from different state (%) - Multirace
Geographical mobility - Moved from different state (%) - Other Race
Geographical mobility - Moved from abroad (%)
Geographical mobility - Moved from abroad (%) - White
Geographical mobility - Moved from abroad (%) - Black or African American
Geographical mobility - Moved from abroad (%) - Asian
Geographical mobility - Moved from abroad (%) - Hispanic or Latino
Geographical mobility - Moved from abroad (%) - American Indian and Alaska Native
Geographical mobility - Moved from abroad (%) - Multirace
Geographical mobility - Moved from abroad (%) - Other Race
Place of birth for the foreign-born population - Ireland (%)
Place of birth for the foreign-born population - Denmark (%)
Place of birth for the foreign-born population - Norway (%)
Place of birth for the foreign-born population - Sweden (%)
Place of birth for the foreign-born population - United Kingdom (%)
Place of birth for the foreign-born population - England (%)
Place of birth for the foreign-born population - Scotland (%)
Place of birth for the foreign-born population - Other Northern Europe (%)
Place of birth for the foreign-born population - Austria (%)
Place of birth for the foreign-born population - Belgium (%)
Place of birth for the foreign-born population - France (%)
Place of birth for the foreign-born population - Germany (%)
Place of birth for the foreign-born population - Netherlands (%)
Place of birth for the foreign-born population - Switzerland (%)
Place of birth for the foreign-born population - Other Western Europe (%)
Place of birth for the foreign-born population - Greece (%)
Place of birth for the foreign-born population - Italy (%)
Place of birth for the foreign-born population - Portugal (%)
Place of birth for the foreign-born population - Spain (%)
Place of birth for the foreign-born population - Other Southern Europe (%)
Place of birth for the foreign-born population - Albania (%)
Place of birth for the foreign-born population - Belarus (%)
Place of birth for the foreign-born population - Bosnia and Herzegovina (%)
Place of birth for the foreign-born population - Bulgaria (%)
Place of birth for the foreign-born population - Croatia (%)
Place of birth for the foreign-born population - Czechoslovakia (%)
Place of birth for the foreign-born population - Hungary (%)
Place of birth for the foreign-born population - Latvia (%)
Place of birth for the foreign-born population - Lithuania (%)
Place of birth for the foreign-born population - North Macedonia (Macedonia) (%)
Place of birth for the foreign-born population - Moldova (%)
Place of birth for the foreign-born population - Poland (%)
Place of birth for the foreign-born population - Romania (%)
Place of birth for the foreign-born population - Russia (%)
Place of birth for the foreign-born population - Serbia (%)
Place of birth for the foreign-born population - Ukraine (%)
Place of birth for the foreign-born population - Other Eastern Europe (%)
Place of birth for the foreign-born population - China (%)
Place of birth for the foreign-born population - Hong Kong (%)
Place of birth for the foreign-born population - Taiwan (%)
Place of birth for the foreign-born population - Japan (%)
Place of birth for the foreign-born population - Korea (%)
Place of birth for the foreign-born population - Other Eastern Asia (%)
Place of birth for the foreign-born population - Afghanistan (%)
Place of birth for the foreign-born population - Bangladesh (%)
Place of birth for the foreign-born population - India (%)
Place of birth for the foreign-born population - Iran (%)
Place of birth for the foreign-born population - Kazakhstan (%)
Place of birth for the foreign-born population - Nepal (%)
Place of birth for the foreign-born population - Pakistan (%)
Place of birth for the foreign-born population - Sri Lanka (%)
Place of birth for the foreign-born population - Uzbekistan (%)
Place of birth for the foreign-born population - Other South Central Asia (%)
Place of birth for the foreign-born population - Burma (%)
Place of birth for the foreign-born population - Cambodia (%)
Place of birth for the foreign-born population - Indonesia (%)
Place of birth for the foreign-born population - Laos (%)
Place of birth for the foreign-born population - Malaysia (%)
Place of birth for the foreign-born population - Philippines (%)
Place of birth for the foreign-born population - Singapore (%)
Place of birth for the foreign-born population - Thailand (%)
Place of birth for the foreign-born population - Vietnam (%)
Place of birth for the foreign-born population - Other South Eastern Asia (%)
Place of birth for the foreign-born population - Armenia (%)
Place of birth for the foreign-born population - Iraq (%)
Place of birth for the foreign-born population - Israel (%)
Place of birth for the foreign-born population - Jordan (%)
Place of birth for the foreign-born population - Kuwait (%)
Place of birth for the foreign-born population - Lebanon (%)
Place of birth for the foreign-born population - Saudi Arabia (%)
Place of birth for the foreign-born population - Syria (%)
Place of birth for the foreign-born population - Turkey (%)
Place of birth for the foreign-born population - Yemen (%)
Place of birth for the foreign-born population - Other Western Asia (%)
Place of birth for the foreign-born population - Eritrea (%)
Place of birth for the foreign-born population - Ethiopia (%)
Place of birth for the foreign-born population - Kenya (%)
Place of birth for the foreign-born population - Somalia (%)
Place of birth for the foreign-born population - Uganda (%)
Place of birth for the foreign-born population - Zimbabwe (%)
Place of birth for the foreign-born population - Other Eastern Africa (%)
Place of birth for the foreign-born population - Cameroon (%)
Place of birth for the foreign-born population - Congo (%)
Place of birth for the foreign-born population - Democratic Republic of Congo (Zaire) (%)
Place of birth for the foreign-born population - Other Middle Africa (%)
Place of birth for the foreign-born population - Egypt (%)
Place of birth for the foreign-born population - Morocco (%)
Place of birth for the foreign-born population - Sudan (%)
Place of birth for the foreign-born population - Other Northern Africa (%)
Place of birth for the foreign-born population - South Africa (%)
Place of birth for the foreign-born population - Other Southern Africa (%)
Place of birth for the foreign-born population - Cabo Verde (%)
Place of birth for the foreign-born population - Ghana (%)
Place of birth for the foreign-born population - Liberia (%)
Place of birth for the foreign-born population - Nigeria (%)
Place of birth for the foreign-born population - Senegal (%)
Place of birth for the foreign-born population - Sierra Leone (%)
Place of birth for the foreign-born population - Other Western Africa (%)
Place of birth for the foreign-born population - Australia (%)
Place of birth for the foreign-born population - New Zealand (%)
Place of birth for the foreign-born population - Fiji (%)
Place of birth for the foreign-born population - Micronesia (%)
Place of birth for the foreign-born population - Bahamas (%)
Place of birth for the foreign-born population - Barbados (%)
Place of birth for the foreign-born population - Cuba (%)
Place of birth for the foreign-born population - Dominica (%)
Place of birth for the foreign-born population - Dominican Republic (%)
Place of birth for the foreign-born population - Grenada (%)
Place of birth for the foreign-born population - Haiti (%)
Place of birth for the foreign-born population - Jamaica (%)
Place of birth for the foreign-born population - St. Vincent and the Grenadines (%)
Place of birth for the foreign-born population - Trinidad and Tobago (%)
Place of birth for the foreign-born population - West Indies (%)
Place of birth for the foreign-born population - Other Caribbean (%)
Place of birth for the foreign-born population - Belize (%)
Place of birth for the foreign-born population - Costa Rica (%)
Place of birth for the foreign-born population - El Salvador (%)
Place of birth for the foreign-born population - Guatemala (%)
Place of birth for the foreign-born population - Honduras (%)
Place of birth for the foreign-born population - Mexico (%)
Place of birth for the foreign-born population - Nicaragua (%)
Place of birth for the foreign-born population - Panama (%)
Place of birth for the foreign-born population - Other Central America (%)
Place of birth for the foreign-born population - Argentina (%)
Place of birth for the foreign-born population - Bolivia (%)
Place of birth for the foreign-born population - Brazil (%)
Place of birth for the foreign-born population - Chile (%)
Place of birth for the foreign-born population - Colombia (%)
Place of birth for the foreign-born population - Ecuador (%)
Place of birth for the foreign-born population - Guyana (%)
Place of birth for the foreign-born population - Peru (%)
Place of birth for the foreign-born population - Uruguay (%)
Place of birth for the foreign-born population - Venezuela (%)
Place of birth for the foreign-born population - Other South America (%)
Place of birth for the foreign-born population - Canada (%)
Place of birth for the foreign-born population - Other Northern America (%)
Place of birth for the foreign-born population - Other (%)
Latest news about races in Aventura, FL collected exclusively by city-data.com from local newspapers, TV, and radio stations
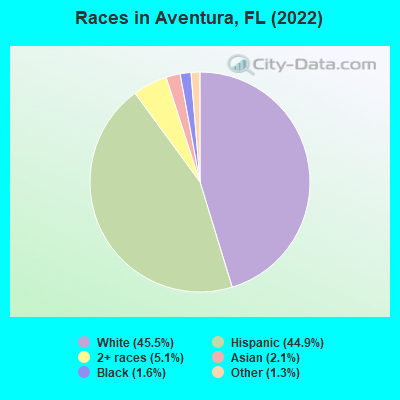
According to 2022 data, the most numerous races in Aventura, FL are White alone (17,912 residents), Hispanic (17,678 residents), and Black alone (630 residents). 32.1% of Aventura residents speak English at home. 51.6% of Aventura, FL residents are foreign-born (35.0% born in Latin America, 8.1% born in Europe, 5.8% born in Asia), which is 59.3% greater than the foreign-born rate of 21.0% across the entire state of Florida.
Race distribution in Aventura
2000 2022
10,458,509 65.4% White alone 2,682,715 16.8% Hispanic 2,264,268 14.2% Black alone 261,693 1.6% Asian alone 236,954 1.5% Two or more races 42,358 0.3% American Indian alone 28,994 0.2% Other race alone 6,887 0.04% Native Hawaiian and Other
11,309,403 50.8% White alone 6,025,039 27.1% Hispanic 3,241,015 14.6% Black alone 861,630 3.9% Two or more races 623,692 2.8% Asian alone 152,054 0.7% Other race alone 22,504 0.1% American Indian alone 9,486 0.04% Native Hawaiian and Other
Income and house value in Aventura Median household income in 2022 $86,852 White non-Hispanic householders$41,429 Black householders$65,096 Asian householders$82,659 Some other race householders$80,469 Two or more races householders$64,760 Hispanic or Latino race householdersMedian 2022 house value $965,220 White Non-Hispanic householdersover $1,000,000 Black or African American householders$541,263 American Indian or Alaska Native householders $541,263 Asian householders$597,554 Some other race householders$296,809 Two or more races householders$671,953 Hispanic or Latino householders
Median age by race in Aventura
47.6 Median age for White residents47.4 48.8 42.5 Median age for Black or African American residents31.3 58.9 -653,446,647.1 Median age for American Indian / Alaska Native residents-543,352,600.6 -762,696,213.5 47.4 Median age for Asian residents41.5 49.4 -679,849,340.2 Median age for Native Hawaiian / Pacific Islander residents-858,307,848.3 -443,298,968.6 39.0 Median age for Other race residents40.1 36.7 48.2 Median age for Two or more races residents45.7 48.6 52.6 Median age for White alone residents51.7 54.2 50.2 Median age for Hispanic or Latino residents47.7 51.0
Owner/renter occupied households by race in Aventura
House owners and renters - White residents 5,679 71.7% Owner occupied2,245 28.3% Renter occupiedHouse owners and renters - Black or African American residents 67 16.0% Owner occupied351 84.0% Renter occupiedHouse owners and renters - American Indian / Alaska Native residents 31 100.0% Owner occupiedHouse owners and renters - Asian residents 326 77.5% Owner occupied95 22.5% Renter occupiedHouse owners and renters - Other race residents 413 63.3% Owner occupied240 36.7% Renter occupiedHouse owners and renters - Two or more races residents 3,868 58.7% Owner occupied2,720 41.3% Renter occupiedHouse owners and renters - White alone residents 6,327 70.5% Owner occupied2,652 29.5% Renter occupiedHouse owners and renters - Hispanic or Latino residents 5,301 63.1% Owner occupied3,102 36.9% Renter occupied
Language usage in Aventura
English speakers - Total 32.1% of residents of Aventura speak English at home.
47.0% of residents speak Spanish at home 11,173 63.0% Speak English very well6,560 37.0% Speak English less than very well20.8% of residents speak other language at home 5,288 67.3% Speak English very well2,571 32.7% Speak English less than very well
English speakers - Born in the United States 75.4% of residents of Aventura speak English at home.
14.8% of residents speak Spanish at home 1,353 89.7% Speak English very well156 10.3% Speak English less than very well11.1% of residents speak other language at home 838 74.0% Speak English very well294 26.0% Speak English less than very well
English speakers - Native, born elsewhere 14.8% of residents of Aventura speak English at home.
67.8% of residents speak Spanish at home 699 78.9% Speak English very well187 21.1% Speak English less than very well14.5% of residents speak other language at home 189 100.0% Speak English very well
English speakers - Foreign-born 10.3% of residents of Aventura speak English at home.
60.3% of residents speak Spanish at home 6,232 51.3% Speak English very well5,913 48.7% Speak English less than very well28.9% of residents speak other language at home 3,566 61.3% Speak English very well2,256 38.7% Speak English less than very well
White (Caucasian) - Speak only English Native:
77.5% (8,244)Foreign-born:
15.0% (762)
White (Caucasian) - Speak another language Native:
30.3% (3,229)Foreign-born:
86.9% (4,419)
Black or African American - Speak only English Native:
99.2% (449)Foreign-born:
4.8% (7)
Black or African American - Speak another language Native:
0.8% (4)Foreign-born:
92.7% (135)
Asian - Speak only English Native:
30.5% (41)Foreign-born:
9.0% (59)
Asian - Speak another language Native:
68.2% (91)Foreign-born:
92.9% (609)
Other race - Speak only English Native:
40.2% (260)Foreign-born:
2.8% (35)
Other race - Speak another language Native:
60.0% (389)Foreign-born:
97.3% (1,228)
Two or more races - Speak only English Native:
21.1% (765)Foreign-born:
12.6% (1,314)
Two or more races - Speak another language Native:
78.9% (2,865)Foreign-born:
88.5% (9,200)
White alone - Speak only English Native:
74.5% (8,688)Foreign-born:
21.6% (1,190)
White alone - Speak another language Native:
25.4% (2,965)Foreign-born:
77.2% (4,253)
Hispanic or Latino - Speak only English Native:
10.8% (493)Foreign-born:
3.1% (388)
Hispanic or Latino - Speak another language Native:
88.9% (4,038)Foreign-born:
96.8% (12,012)
Foreign-born residents in Aventura 20,345 residents are foreign born (35.0% Latin America , 8.1% Europe , 5.8% Asia ).
This city:
51.6%Florida:
21.1%
Marital status for residents in Aventura Marital status - White (Caucasian) population 15 years and over
Males 27.1% Never married55.5% Now married1.7% Separated3.9% Widowed11.9% DivorcedFemales 20.1% Never married45.6% Now married1.5% Separated12.5% Widowed20.2% DivorcedWomen who gave birth in the past 12 months Now married:
100.0% (128)Unmarried:
0.0% (0)
Women who did not give birth in the past 12 months Now married:
46.2% (1,186)Unmarried:
53.8% (1,379)
Marital status - Black or African American population 15 years and over
Males 29.8% Never married54.4% Now married0.0% Separated0.0% Widowed15.7% DivorcedFemales 73.2% Never married8.9% Now married3.1% Separated11.0% Widowed3.8% DivorcedWomen who did not give birth in the past 12 months Now married:
0.0% (0)Unmarried:
100.0% (167)
Marital status - Asian population 15 years and over
Males 33.2% Never married56.4% Now married0.0% Separated6.6% Widowed3.8% DivorcedFemales 12.6% Never married72.6% Now married3.4% Separated0.0% Widowed11.3% DivorcedWomen who did not give birth in the past 12 months Now married:
73.2% (137)Unmarried:
26.8% (50)
Marital status - Other race population 15 years and over
Males 21.6% Never married61.9% Now married1.8% Separated3.3% Widowed11.4% DivorcedFemales 24.5% Never married57.6% Now married0.0% Separated5.9% Widowed12.0% DivorcedWomen who gave birth in the past 12 months Now married:
100.0% (11)Unmarried:
0.0% (0)
Women who did not give birth in the past 12 months Now married:
83.5% (316)Unmarried:
16.5% (63)
Marital status - Two or more races population 15 years and over
Males 22.2% Never married66.3% Now married1.3% Separated0.8% Widowed9.4% DivorcedFemales 22.5% Never married46.4% Now married1.3% Separated12.9% Widowed17.0% DivorcedWomen who gave birth in the past 12 months Now married:
40.0% (57)Unmarried:
60.0% (86)
Women who did not give birth in the past 12 months Now married:
47.3% (1,865)Unmarried:
52.7% (2,081)
Marital status - White alone, not Hispanic / Latino population 15 years and over
Males 26.5% Never married56.8% Now married1.1% Separated4.7% Widowed10.9% DivorcedFemales 19.3% Never married46.6% Now married1.1% Separated15.6% Widowed17.4% DivorcedWomen who gave birth in the past 12 months Now married:
100.0% (126)Unmarried:
0.0% (0)
Women who did not give birth in the past 12 months Now married:
45.5% (1,232)Unmarried:
54.5% (1,477)
Marital status - Hispanic or Latino population 15 years and over
Males 25.6% Never married58.0% Now married2.3% Separated1.5% Widowed12.7% DivorcedFemales 22.3% Never married44.1% Now married1.9% Separated10.3% Widowed21.5% DivorcedWomen who gave birth in the past 12 months Now married:
100.0% (143)Unmarried:
0.0% (0)
Women who did not give birth in the past 12 months Now married:
45.0% (1,733)Unmarried:
55.0% (2,119)
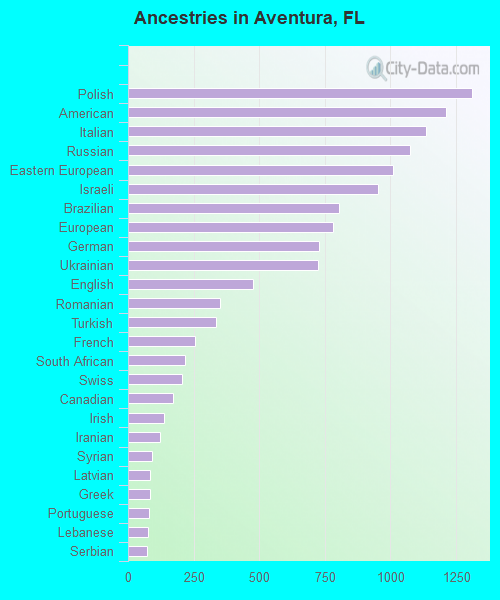
Ancestries in Aventura
1,310 5.4% Polish1,213 5.0% American1,137 4.7% Italian1,074 4.4% Russian1,008 4.1% Eastern European952 3.9% Israeli805 3.3% Brazilian781 3.2% European727 3.0% German724 3.0% Ukrainian476 2.0% English352 1.4% Romanian334 1.4% Turkish256 1.1% French216 0.9% South African207 0.9% Swiss170 0.7% Canadian137 0.6% Irish122 0.5% Iranian90 0.4% Syrian83 0.3% Latvian82 0.3% Greek80 0.3% Portuguese76 0.3% Lebanese74 0.3% Serbian67 0.3% Hungarian66 0.3% Austrian66 0.3% Swedish57 0.2% Moroccan51 0.2% Trinidadian and Tobagonian36 0.1% Egyptian35 0.1% Haitian34 0.1% Lithuanian31 0.1% Iraqi30 0.1% Scottish29 0.1% Cypriot27 0.1% Bulgarian26 0.1% Scotch-Irish25 0.1% Northern European24 0.10% Slovene24 0.10% Dutch22 0.09% Welsh22 0.09% Afghan22 0.09% Australian16 0.07% African16 0.07% French Canadian15 0.06% Norwegian14 0.06% Croatian14 0.06% Yugoslavian11 0.05% Jordanian10 0.04% Danish9 0.04% British9 0.04% Palestinian5 0.02% Jamaican4 0.02% Slovak
Geographical mobility in Aventura Same house 1 year ago 13,603 87.6% White (Caucasian)642 92.5% Black or African American43 100.0% American Indian / Alaska Native536 63.5% Asian1,677 83.5% Other race12,741 87.5% Two or more races15,637 88.3% White alone, not Hispanic / Latino15,311 87.1% Hispanic or LatinoMoved within same county 745 4.8% White / Caucasian38 5.4% Black or African American16 1.9% Asian112 5.6% Other race495 3.4% Two or more races943 5.3% White alone, not Hispanic / Latino712 4.1% Hispanic or LatinoMoved within same state 225 1.4% White / Caucasian3 0.4% Black or African American18 0.9% Other race262 1.8% Two or more races239 1.4% White alone, not Hispanic / Latino223 1.3% Hispanic or LatinoMoved from different state 608 3.9% White / Caucasian128 15.1% Asian253 1.7% Two or more races567 3.2% White alone, not Hispanic / Latino185 1.1% Hispanic or LatinoMoved from abroad 551 3.5% White190 22.6% Asian280 14.0% Other race1,013 7.0% Two or more races205 1.2% White alone, not Hispanic / Latino1,881 10.7% Hispanic or Latino
Children Nativity (place of birth) in Aventura
Children under 6 years - Living with two parents Both parents native 186 93.1% Native14 6.9% Foreign-bornBoth parents foreign-born 1,066 92.2% Native91 7.8% Foreign-bornOne native, one foreign-born parent 316 77.9% Native90 22.1% Foreign-bornChildren under 6 years - Living with one parent Native parent 80 95.6% Native4 4.4% Foreign-bornForeign-born parent 224 73.8% Native80 26.2% Foreign-bornChildren 6 to 17 years - Living with two parents Both parents native 572 100.0% NativeBoth parents foreign-born 968 52.8% Native865 47.2% Foreign-bornOne native, one foreign-born parent 993 93.4% Native70 6.6% Foreign-bornChildren 6 to 17 years - Living with one parent Native parent 197 100.0% NativeForeign-born parent 867 54.6% Native721 45.4% Foreign-born
Place of birth for residents in Aventura 14,136 Americas13,844 Latin America10,562 South America3,195 Europe2,288 Asia2,006 Eastern Europe1,797 Caribbean1,483 Central America1,451 Western Asia725 Africa707 Western Europe501 Southern Africa393 South Central Asia376 Southern Europe291 Northern America280 Eastern Asia219 China198 Northern Africa161 South Eastern Asia104 Northern Europe13 Eastern Africa10 Middle Africa3,658 Colombia2,391 Venezuela1,467 Cuba1,413 Brazil1,243 Argentina1,111 Israel901 Peru641 Russia594 Mexico501 South Africa439 Ukraine403 Chile376 Panama312 France305 Romania291 Canada258 Ecuador238 Guatemala221 Germany221 Dominican Republic193 Turkey184 Spain175 China171 Morocco167 Uruguay136 Italy133 India128 Honduras116 Moldova106 Kazakhstan106 Switzerland101 Costa Rica98 Iran96 Bolivia95 Hungary83 Philippines78 Poland71 Georgia69 Belarus62 Haiti61 Serbia60 Korea53 Austria50 Singapore49 Latvia44 United Kingdom43 Hong Kong37 Trinidad and Tobago36 Greece33 Sweden27 Iraq26 Vietnam25 Denmark25 Uzbekistan22 El Salvador19 Nicaragua17 Portugal16 Jordan16 Egypt13 Ethiopia12 Syria11 Afghanistan11 Bulgaria11 Belgium10 Democratic Republic of Congo (Zaire)9 Algeria8 Croatia8 Bosnia and Herzegovina6 Czechoslovakia6 Jamaica
Grandparents responsible for own grandchildren in Aventura
Grandparents (30 to 59 years) White / Caucasian 15 100.0% Not responsible for grandchildrenTwo or more races 83 100.0% Not responsible for grandchildrenWhite alone, not Hispanic / Latino 19 100.0% Not responsible for grandchildrenHispanic or Latino 45 100.0% Not responsible for grandchildrenGrandparents (60 years and over) White / Caucasian 13 13.9% Responsible for grandchildren80 86.1% Not responsible for grandchildrenWhite alone, not Hispanic / Latino 16 36.0% Responsible for grandchildren28 64.0% Not responsible for grandchildrenHispanic or Latino 187 100.0% Not responsible for grandchildren