Races in Austin, Minnesota (MN) Detailed Stats
Data:
Races - White alone (%)
Races - White alone (% change since 2000)
Races - Black alone (%)
Races - Black alone (% change since 2000)
Races - American Indian alone (%)
Races - American Indian alone (% change since 2000)
Races - Asian alone (%)
Races - Asian alone (% change since 2000)
Races - Hispanic (%)
Races - Hispanic (% change since 2000)
Races - Native Hawaiian and Other Pacific Islander alone (%)
Races - Native Hawaiian and Other Pacific Islander alone (% change since 2000)
Races - Two or more races(%)
Races - Two or more races(% change since 2000)
Races - Other race alone (%)
Races - Other race alone (% change since 2000)
Racial diversity
Place of birth - Born in state of residence (%)
Place of birth - Born in state of residence (%) - White
Place of birth - Born in state of residence (%) - Black or African American
Place of birth - Born in state of residence (%) - Asian
Place of birth - Born in state of residence (%) - Hispanic or Latino
Place of birth - Born in state of residence (%) - American Indian and Alaska Native
Place of birth - Born in state of residence (%) - Multirace
Place of birth - Born in state of residence (%) - Other Race
Place of birth - Born in other state (%)
Place of birth - Born in other state (%) - White
Place of birth - Born in other state (%) - Black or African American
Place of birth - Born in other state (%) - Asian
Place of birth - Born in other state (%) - Hispanic or Latino
Place of birth - Born in other state (%) - American Indian and Alaska Native
Place of birth - Born in other state (%) - Multirace
Place of birth - Born in other state (%) - Other Race
Place of birth - Native, outside of US (%)
Place of birth - Native, outside of US (%) - White
Place of birth - Native, outside of US (%) - Black or African American
Place of birth - Native, outside of US (%) - Asian
Place of birth - Native, outside of US (%) - Hispanic or Latino
Place of birth - Native, outside of US (%) - American Indian and Alaska Native
Place of birth - Native, outside of US (%) - Multirace
Place of birth - Native, outside of US (%) - Other Race
Place of birth - Foreign born (%)
Place of birth - Foreign born (%) - White
Place of birth - Foreign born (%) - Black or African American
Place of birth - Foreign born (%) - Asian
Place of birth - Foreign born (%) - Hispanic or Latino
Place of birth - Foreign born (%) - American Indian and Alaska Native
Place of birth - Foreign born (%) - Multirace
Place of birth - Foreign born (%) - Other Race
Residents speaking English at home (%)
Residents speaking English at home - Born in the United States (%)
Residents speaking English at home - Native, born elsewhere (%)
Residents speaking English at home - Foreign born (%)
Residents speaking Spanish at home (%)
Residents speaking Spanish at home - Born in the United States (%)
Residents speaking Spanish at home - Native, born elsewhere (%)
Residents speaking Spanish at home - Foreign born (%)
Residents speaking other language at home (%)
Residents speaking other language at home - Born in the United States (%)
Residents speaking other language at home - Native, born elsewhere (%)
Residents speaking other language at home - Foreign born (%)
Marital status - Never married (%)
Marital status - Now married (%)
Marital status - Separated (%)
Marital status - Widowed (%)
Marital status - Divorced (%)
Ancestries Reported - Arab (%)
Ancestries Reported - Czech (%)
Ancestries Reported - Danish (%)
Ancestries Reported - Dutch (%)
Ancestries Reported - English (%)
Ancestries Reported - French (%)
Ancestries Reported - French Canadian (%)
Ancestries Reported - German (%)
Ancestries Reported - Greek (%)
Ancestries Reported - Hungarian (%)
Ancestries Reported - Irish (%)
Ancestries Reported - Italian (%)
Ancestries Reported - Lithuanian (%)
Ancestries Reported - Norwegian (%)
Ancestries Reported - Polish (%)
Ancestries Reported - Portuguese (%)
Ancestries Reported - Russian (%)
Ancestries Reported - Scotch-Irish (%)
Ancestries Reported - Scottish (%)
Ancestries Reported - Slovak (%)
Ancestries Reported - Subsaharan African (%)
Ancestries Reported - Swedish (%)
Ancestries Reported - Swiss (%)
Ancestries Reported - Ukrainian (%)
Ancestries Reported - United States (%)
Ancestries Reported - Welsh (%)
Ancestries Reported - West Indian (%)
Ancestries Reported - Other (%)
Geographical mobility - Same house 1 year ago (%)
Geographical mobility - Same house 1 year ago (%) - White
Geographical mobility - Same house 1 year ago (%) - Black or African American
Geographical mobility - Same house 1 year ago (%) - Asian
Geographical mobility - Same house 1 year ago (%) - Hispanic or Latino
Geographical mobility - Same house 1 year ago (%) - American Indian and Alaska Native
Geographical mobility - Same house 1 year ago (%) - Multirace
Geographical mobility - Same house 1 year ago (%) - Other Race
Geographical mobility - Moved within same county (%)
Geographical mobility - Moved within same county (%) - White
Geographical mobility - Moved within same county (%) - Black or African American
Geographical mobility - Moved within same county (%) - Asian
Geographical mobility - Moved within same county (%) - Hispanic or Latino
Geographical mobility - Moved within same county (%) - American Indian and Alaska Native
Geographical mobility - Moved within same county (%) - Multirace
Geographical mobility - Moved within same county (%) - Other Race
Geographical mobility - Moved from different county within same state (%)
Geographical mobility - Moved from different county within same state (%) - White
Geographical mobility - Moved from different county within same state (%) - Black or African American
Geographical mobility - Moved from different county within same state (%) - Asian
Geographical mobility - Moved from different county within same state (%) - Hispanic or Latino
Geographical mobility - Moved from different county within same state (%) - American Indian and Alaska Native
Geographical mobility - Moved from different county within same state (%) - Multirace
Geographical mobility - Moved from different county within same state (%) - Other Race
Geographical mobility - Moved from different state (%)
Geographical mobility - Moved from different state (%) - White
Geographical mobility - Moved from different state (%) - Black or African American
Geographical mobility - Moved from different state (%) - Asian
Geographical mobility - Moved from different state (%) - Hispanic or Latino
Geographical mobility - Moved from different state (%) - American Indian and Alaska Native
Geographical mobility - Moved from different state (%) - Multirace
Geographical mobility - Moved from different state (%) - Other Race
Geographical mobility - Moved from abroad (%)
Geographical mobility - Moved from abroad (%) - White
Geographical mobility - Moved from abroad (%) - Black or African American
Geographical mobility - Moved from abroad (%) - Asian
Geographical mobility - Moved from abroad (%) - Hispanic or Latino
Geographical mobility - Moved from abroad (%) - American Indian and Alaska Native
Geographical mobility - Moved from abroad (%) - Multirace
Geographical mobility - Moved from abroad (%) - Other Race
Place of birth for the foreign-born population - Ireland (%)
Place of birth for the foreign-born population - Denmark (%)
Place of birth for the foreign-born population - Norway (%)
Place of birth for the foreign-born population - Sweden (%)
Place of birth for the foreign-born population - United Kingdom (%)
Place of birth for the foreign-born population - England (%)
Place of birth for the foreign-born population - Scotland (%)
Place of birth for the foreign-born population - Other Northern Europe (%)
Place of birth for the foreign-born population - Austria (%)
Place of birth for the foreign-born population - Belgium (%)
Place of birth for the foreign-born population - France (%)
Place of birth for the foreign-born population - Germany (%)
Place of birth for the foreign-born population - Netherlands (%)
Place of birth for the foreign-born population - Switzerland (%)
Place of birth for the foreign-born population - Other Western Europe (%)
Place of birth for the foreign-born population - Greece (%)
Place of birth for the foreign-born population - Italy (%)
Place of birth for the foreign-born population - Portugal (%)
Place of birth for the foreign-born population - Spain (%)
Place of birth for the foreign-born population - Other Southern Europe (%)
Place of birth for the foreign-born population - Albania (%)
Place of birth for the foreign-born population - Belarus (%)
Place of birth for the foreign-born population - Bosnia and Herzegovina (%)
Place of birth for the foreign-born population - Bulgaria (%)
Place of birth for the foreign-born population - Croatia (%)
Place of birth for the foreign-born population - Czechoslovakia (%)
Place of birth for the foreign-born population - Hungary (%)
Place of birth for the foreign-born population - Latvia (%)
Place of birth for the foreign-born population - Lithuania (%)
Place of birth for the foreign-born population - North Macedonia (Macedonia) (%)
Place of birth for the foreign-born population - Moldova (%)
Place of birth for the foreign-born population - Poland (%)
Place of birth for the foreign-born population - Romania (%)
Place of birth for the foreign-born population - Russia (%)
Place of birth for the foreign-born population - Serbia (%)
Place of birth for the foreign-born population - Ukraine (%)
Place of birth for the foreign-born population - Other Eastern Europe (%)
Place of birth for the foreign-born population - China (%)
Place of birth for the foreign-born population - Hong Kong (%)
Place of birth for the foreign-born population - Taiwan (%)
Place of birth for the foreign-born population - Japan (%)
Place of birth for the foreign-born population - Korea (%)
Place of birth for the foreign-born population - Other Eastern Asia (%)
Place of birth for the foreign-born population - Afghanistan (%)
Place of birth for the foreign-born population - Bangladesh (%)
Place of birth for the foreign-born population - India (%)
Place of birth for the foreign-born population - Iran (%)
Place of birth for the foreign-born population - Kazakhstan (%)
Place of birth for the foreign-born population - Nepal (%)
Place of birth for the foreign-born population - Pakistan (%)
Place of birth for the foreign-born population - Sri Lanka (%)
Place of birth for the foreign-born population - Uzbekistan (%)
Place of birth for the foreign-born population - Other South Central Asia (%)
Place of birth for the foreign-born population - Burma (%)
Place of birth for the foreign-born population - Cambodia (%)
Place of birth for the foreign-born population - Indonesia (%)
Place of birth for the foreign-born population - Laos (%)
Place of birth for the foreign-born population - Malaysia (%)
Place of birth for the foreign-born population - Philippines (%)
Place of birth for the foreign-born population - Singapore (%)
Place of birth for the foreign-born population - Thailand (%)
Place of birth for the foreign-born population - Vietnam (%)
Place of birth for the foreign-born population - Other South Eastern Asia (%)
Place of birth for the foreign-born population - Armenia (%)
Place of birth for the foreign-born population - Iraq (%)
Place of birth for the foreign-born population - Israel (%)
Place of birth for the foreign-born population - Jordan (%)
Place of birth for the foreign-born population - Kuwait (%)
Place of birth for the foreign-born population - Lebanon (%)
Place of birth for the foreign-born population - Saudi Arabia (%)
Place of birth for the foreign-born population - Syria (%)
Place of birth for the foreign-born population - Turkey (%)
Place of birth for the foreign-born population - Yemen (%)
Place of birth for the foreign-born population - Other Western Asia (%)
Place of birth for the foreign-born population - Eritrea (%)
Place of birth for the foreign-born population - Ethiopia (%)
Place of birth for the foreign-born population - Kenya (%)
Place of birth for the foreign-born population - Somalia (%)
Place of birth for the foreign-born population - Uganda (%)
Place of birth for the foreign-born population - Zimbabwe (%)
Place of birth for the foreign-born population - Other Eastern Africa (%)
Place of birth for the foreign-born population - Cameroon (%)
Place of birth for the foreign-born population - Congo (%)
Place of birth for the foreign-born population - Democratic Republic of Congo (Zaire) (%)
Place of birth for the foreign-born population - Other Middle Africa (%)
Place of birth for the foreign-born population - Egypt (%)
Place of birth for the foreign-born population - Morocco (%)
Place of birth for the foreign-born population - Sudan (%)
Place of birth for the foreign-born population - Other Northern Africa (%)
Place of birth for the foreign-born population - South Africa (%)
Place of birth for the foreign-born population - Other Southern Africa (%)
Place of birth for the foreign-born population - Cabo Verde (%)
Place of birth for the foreign-born population - Ghana (%)
Place of birth for the foreign-born population - Liberia (%)
Place of birth for the foreign-born population - Nigeria (%)
Place of birth for the foreign-born population - Senegal (%)
Place of birth for the foreign-born population - Sierra Leone (%)
Place of birth for the foreign-born population - Other Western Africa (%)
Place of birth for the foreign-born population - Australia (%)
Place of birth for the foreign-born population - New Zealand (%)
Place of birth for the foreign-born population - Fiji (%)
Place of birth for the foreign-born population - Micronesia (%)
Place of birth for the foreign-born population - Bahamas (%)
Place of birth for the foreign-born population - Barbados (%)
Place of birth for the foreign-born population - Cuba (%)
Place of birth for the foreign-born population - Dominica (%)
Place of birth for the foreign-born population - Dominican Republic (%)
Place of birth for the foreign-born population - Grenada (%)
Place of birth for the foreign-born population - Haiti (%)
Place of birth for the foreign-born population - Jamaica (%)
Place of birth for the foreign-born population - St. Vincent and the Grenadines (%)
Place of birth for the foreign-born population - Trinidad and Tobago (%)
Place of birth for the foreign-born population - West Indies (%)
Place of birth for the foreign-born population - Other Caribbean (%)
Place of birth for the foreign-born population - Belize (%)
Place of birth for the foreign-born population - Costa Rica (%)
Place of birth for the foreign-born population - El Salvador (%)
Place of birth for the foreign-born population - Guatemala (%)
Place of birth for the foreign-born population - Honduras (%)
Place of birth for the foreign-born population - Mexico (%)
Place of birth for the foreign-born population - Nicaragua (%)
Place of birth for the foreign-born population - Panama (%)
Place of birth for the foreign-born population - Other Central America (%)
Place of birth for the foreign-born population - Argentina (%)
Place of birth for the foreign-born population - Bolivia (%)
Place of birth for the foreign-born population - Brazil (%)
Place of birth for the foreign-born population - Chile (%)
Place of birth for the foreign-born population - Colombia (%)
Place of birth for the foreign-born population - Ecuador (%)
Place of birth for the foreign-born population - Guyana (%)
Place of birth for the foreign-born population - Peru (%)
Place of birth for the foreign-born population - Uruguay (%)
Place of birth for the foreign-born population - Venezuela (%)
Place of birth for the foreign-born population - Other South America (%)
Place of birth for the foreign-born population - Canada (%)
Place of birth for the foreign-born population - Other Northern America (%)
Place of birth for the foreign-born population - Other (%)
Latest news about races in Austin, MN collected exclusively by city-data.com from local newspapers, TV, and radio stations
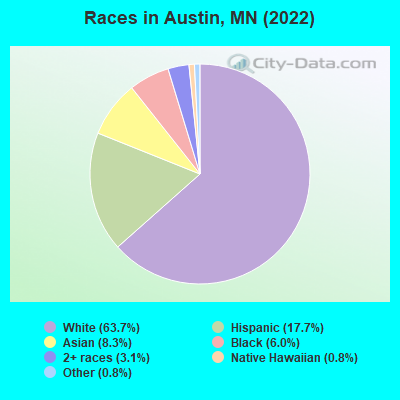
According to 2022 data, the most numerous races in Austin, MN are White alone (16,735 residents), Black alone (1,570 residents), and Hispanic (4,655 residents). 73.5% of Austin residents speak English at home. 16.6% of Austin, MN residents are foreign-born (7.4% born in Latin America, 5.4% born in Asia, 2.6% born in Africa), which is 51.8% greater than the foreign-born rate of 8.0% across the entire state of Minnesota.
Race distribution in Austin
2000 2022
4,337,143 88.2% White alone 168,813 3.4% Black alone 143,382 2.9% Hispanic 141,083 2.9% Asian alone 70,304 1.4% Two or more races 52,009 1.1% American Indian alone 5,031 0.1% Other race alone 1,714 0.03% Native Hawaiian and Other
4,356,347 76.2% White alone 395,179 6.9% Black alone 333,830 5.8% Hispanic 294,800 5.2% Asian alone 259,649 4.5% Two or more races 42,125 0.7% American Indian alone 32,976 0.6% Other race alone 2,278 0.04% Native Hawaiian and Other
Income and house value in Austin Median household income in 2022 $59,545 White non-Hispanic householders$45,449 Black householders$57,480 Asian householders$80,381 Some other race householders$79,899 Two or more races householders$68,001 Hispanic or Latino race householdersMedian 2022 house value $153,478 White Non-Hispanic householders$193,078 Black or African American householders$130,434 American Indian or Alaska Native householders $178,983 Asian householders$83,898 Some other race householders$154,820 Two or more races householders$93,742 Hispanic or Latino householders
Median age by race in Austin
43.7 Median age for White residents42.2 45.0 25.5 Median age for Black or African American residents30.1 17.1 14.3 Median age for American Indian / Alaska Native residents31.6 12.7 26.0 Median age for Asian residents26.5 21.9 14.4 Median age for Native Hawaiian / Pacific Islander residents16.6 28.1 24.5 Median age for Other race residents26.7 22.3 28.4 Median age for Two or more races residents27.5 23.0 47.7 Median age for White alone residents43.6 48.7 21.3 Median age for Hispanic or Latino residents22.9 19.9
Owner/renter occupied households by race in Austin
House owners and renters - White residents 5,927 73.4% Owner occupied2,153 26.6% Renter occupiedHouse owners and renters - Black or African American residents 95 17.7% Owner occupied441 82.3% Renter occupiedHouse owners and renters - Asian residents 257 42.9% Owner occupied343 57.1% Renter occupiedHouse owners and renters - Native Hawaiian / Pacific Islander residents 23 100.0% Renter occupiedHouse owners and renters - Other race residents 481 84.6% Owner occupied88 15.4% Renter occupiedHouse owners and renters - Two or more races residents 539 63.6% Owner occupied309 36.4% Renter occupiedHouse owners and renters - White alone residents 5,699 74.4% Owner occupied1,959 25.6% Renter occupiedHouse owners and renters - Hispanic or Latino residents 876 66.3% Owner occupied446 33.7% Renter occupied
Language usage in Austin
English speakers - Total 73.5% of residents of Austin speak English at home.
14.3% of residents speak Spanish at home 1,643 47.3% Speak English very well1,829 52.7% Speak English less than very well12.4% of residents speak other language at home 1,413 46.7% Speak English very well1,611 53.3% Speak English less than very well
English speakers - Born in the United States 85.5% of residents of Austin speak English at home.
9.6% of residents speak Spanish at home 495 96.5% Speak English very well18 3.5% Speak English less than very well4.6% of residents speak other language at home 194 79.8% Speak English very well49 20.2% Speak English less than very well
English speakers - Native, born elsewhere 29.0% of residents of Austin speak English at home.
31.6% of residents speak Spanish at home 109 75.7% Speak English very well35 24.3% Speak English less than very well42.2% of residents speak other language at home 164 85.4% Speak English very well28 14.6% Speak English less than very well
English speakers - Foreign-born 5.3% of residents of Austin speak English at home.
45.4% of residents speak Spanish at home 380 19.4% Speak English very well1,578 80.6% Speak English less than very well49.2% of residents speak other language at home 775 36.6% Speak English very well1,345 63.4% Speak English less than very well
White (Caucasian) - Speak only English Native:
95.1% (15,878)Foreign-born:
6.0% (44)
White (Caucasian) - Speak another language Native:
4.3% (717)Foreign-born:
83.1% (620)
Black or African American - Speak only English Native:
54.5% (352)Foreign-born:
14.4% (106)
Black or African American - Speak another language Native:
51.7% (333)Foreign-born:
86.1% (628)
Asian - Speak only English Native:
18.1% (91)Foreign-born:
2.2% (31)
Asian - Speak another language Native:
78.7% (394)Foreign-born:
98.4% (1,387)
Native Hawaiian / Pacific Islander - Speak another language Native:
84.8% (14)Foreign-born:
91.2% (207)
Other race - Speak only English Native:
30.8% (263)Foreign-born:
4.5% (28)
Other race - Speak another language Native:
66.6% (568)Foreign-born:
93.8% (579)
Two or more races - Speak only English Native:
70.2% (1,069)Foreign-born:
3.5% (24)
Two or more races - Speak another language Native:
28.9% (439)Foreign-born:
99.2% (682)
White alone - Speak only English Native:
98.4% (15,588)Foreign-born:
71.7% (47)
White alone - Speak another language Native:
1.6% (248)Foreign-born:
31.0% (20)
Hispanic or Latino - Speak only English Native:
34.1% (749)Foreign-born:
1.9% (36)
Hispanic or Latino - Speak another language Native:
63.9% (1,402)Foreign-born:
95.4% (1,862)
Foreign-born residents in Austin 4,362 residents are foreign born (7.4% Latin America , 5.4% Asia , 2.6% Africa ).
This city:
16.6%Minnesota:
8.5%
Marital status for residents in Austin Marital status - White (Caucasian) population 15 years and over
Males 30.2% Never married55.1% Now married2.5% Separated2.6% Widowed9.6% DivorcedFemales 25.9% Never married48.9% Now married2.2% Separated11.0% Widowed12.0% DivorcedWomen who gave birth in the past 12 months Now married:
46.9% (208)Unmarried:
53.1% (235)
Women who did not give birth in the past 12 months Now married:
49.8% (1,567)Unmarried:
50.2% (1,579)
Marital status - Black or African American population 15 years and over
Males 38.3% Never married46.9% Now married1.1% Separated0.0% Widowed13.7% DivorcedFemales 37.1% Never married59.9% Now married0.0% Separated0.0% Widowed2.9% DivorcedWomen who gave birth in the past 12 months Now married:
100.0% (38)Unmarried:
0.0% (0)
Women who did not give birth in the past 12 months Now married:
55.6% (195)Unmarried:
44.4% (156)
Marital status - Asian population 15 years and over
Males 46.5% Never married44.7% Now married0.0% Separated5.1% Widowed3.7% DivorcedFemales 31.1% Never married66.0% Now married0.6% Separated1.7% Widowed0.6% DivorcedWomen who gave birth in the past 12 months Now married:
85.3% (66)Unmarried:
14.7% (11)
Women who did not give birth in the past 12 months Now married:
62.3% (261)Unmarried:
37.7% (158)
Marital status - Native Hawaiian / Pacific Islander population 15 years and over
Males 52.9% Never married47.1% Now married0.0% Separated0.0% Widowed0.0% DivorcedFemales 0.0% Never married100.0% Now married0.0% Separated0.0% Widowed0.0% DivorcedWomen who did not give birth in the past 12 months Now married:
100.0% (39)Unmarried:
0.0% (0)
Marital status - Other race population 15 years and over
Males 41.3% Never married55.4% Now married0.0% Separated0.0% Widowed3.4% DivorcedFemales 52.2% Never married29.4% Now married6.9% Separated0.0% Widowed11.5% DivorcedWomen who gave birth in the past 12 months Now married:
100.0% (30)Unmarried:
0.0% (0)
Women who did not give birth in the past 12 months Now married:
28.0% (147)Unmarried:
72.0% (377)
Marital status - Two or more races population 15 years and over
Males 58.2% Never married23.0% Now married0.0% Separated0.0% Widowed18.7% DivorcedFemales 53.0% Never married38.1% Now married2.3% Separated0.0% Widowed6.6% DivorcedWomen who did not give birth in the past 12 months Now married:
31.3% (163)Unmarried:
68.7% (356)
Marital status - White alone, not Hispanic / Latino population 15 years and over
Males 29.6% Never married56.3% Now married1.0% Separated2.9% Widowed10.1% DivorcedFemales 23.7% Never married51.1% Now married0.9% Separated11.8% Widowed12.5% DivorcedWomen who gave birth in the past 12 months Now married:
62.5% (211)Unmarried:
37.5% (126)
Women who did not give birth in the past 12 months Now married:
49.4% (1,369)Unmarried:
50.6% (1,405)
Marital status - Hispanic or Latino population 15 years and over
Males 42.1% Never married42.8% Now married7.0% Separated0.0% Widowed8.1% DivorcedFemales 54.8% Never married26.6% Now married12.2% Separated0.0% Widowed6.3% DivorcedWomen who gave birth in the past 12 months Now married:
15.5% (25)Unmarried:
84.5% (133)
Women who did not give birth in the past 12 months Now married:
38.4% (417)Unmarried:
61.6% (668)
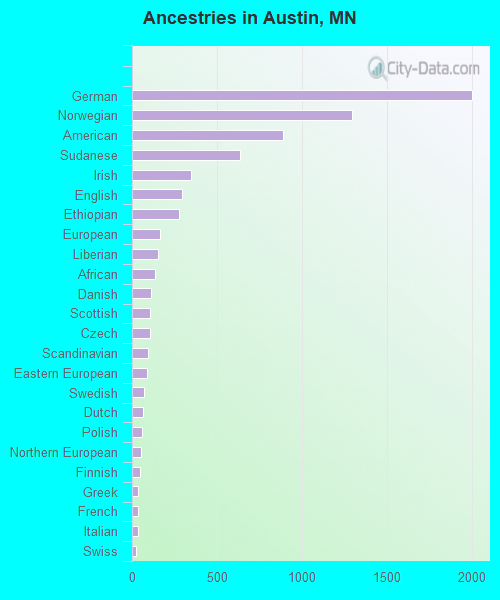
Ancestries in Austin
2,002 15.5% German1,296 10.0% Norwegian890 6.9% American633 4.9% Sudanese345 2.7% Irish296 2.3% English274 2.1% Ethiopian163 1.3% European156 1.2% Liberian136 1.1% African114 0.9% Danish106 0.8% Scottish105 0.8% Czech93 0.7% Scandinavian90 0.7% Eastern European68 0.5% Swedish67 0.5% Dutch60 0.5% Polish54 0.4% Northern European50 0.4% Finnish36 0.3% Greek35 0.3% French34 0.3% Italian26 0.2% Swiss13 0.1% Russian9 0.07% Austrian9 0.07% Ukrainian7 0.05% Lithuanian6 0.05% Scotch-Irish6 0.05% Welsh4 0.03% Guyanese1 0.01% French Canadian
Geographical mobility in Austin Same house 1 year ago 15,842 86.0% White (Caucasian)1,165 76.2% Black or African American51 93.9% American Indian / Alaska Native1,513 71.5% Asian1,217 78.1% Other race1,643 72.9% Two or more races14,472 87.4% White alone, not Hispanic / Latino3,215 71.9% Hispanic or LatinoMoved within same county 1,390 7.5% White / Caucasian33 2.2% Black or African American1 1.5% American Indian / Alaska Native505 23.9% Asian133 65.7% Native Hawaiian / Pacific Islander88 5.6% Other race500 22.2% Two or more races1,100 6.6% White alone, not Hispanic / Latino797 17.8% Hispanic or LatinoMoved within same state 558 3.0% White / Caucasian233 15.2% Black or African American2 4.2% American Indian / Alaska Native65 32.0% Native Hawaiian / Pacific Islander242 15.6% Other race24 1.1% Two or more races482 2.9% White alone, not Hispanic / Latino305 6.8% Hispanic or LatinoMoved from different state 577 3.1% White / Caucasian75 4.9% Black or African American1 1.7% American Indian / Alaska Native30 1.4% Asian466 2.8% White alone, not Hispanic / Latino120 2.7% Hispanic or LatinoMoved from abroad 23 0.1% White24 1.5% Black or African American9 0.4% Asian17 1.1% Other race42 1.8% Two or more races25 0.1% White alone, not Hispanic / Latino54 1.2% Hispanic or Latino
Children Nativity (place of birth) in Austin
Children under 6 years - Living with two parents Both parents native 705 99.8% Native1 0.2% Foreign-bornBoth parents foreign-born 651 96.3% Native25 3.7% Foreign-bornOne native, one foreign-born parent 22 100.0% NativeChildren under 6 years - Living with one parent Native parent 731 98.5% Native11 1.5% Foreign-bornForeign-born parent 136 87.7% Native19 12.3% Foreign-bornChildren 6 to 17 years - Living with two parents Both parents native 1,392 99.7% Native4 0.3% Foreign-bornBoth parents foreign-born 438 52.6% Native395 47.4% Foreign-bornOne native, one foreign-born parent 310 100.0% NativeChildren 6 to 17 years - Living with one parent Native parent 668 100.0% NativeForeign-born parent 719 55.4% Native578 44.6% Foreign-born
Grandparents responsible for own grandchildren in Austin
Grandparents (30 to 59 years) White / Caucasian 37 100.0% Responsible for grandchildrenAsian 16 43.7% Responsible for grandchildren21 56.3% Not responsible for grandchildrenOther race 22 100.0% Not responsible for grandchildrenTwo or more races 9 100.0% Not responsible for grandchildrenWhite alone, not Hispanic / Latino 38 100.0% Responsible for grandchildrenHispanic or Latino 14 100.0% Not responsible for grandchildrenGrandparents (60 years and over) White / Caucasian 67 31.7% Responsible for grandchildren143 68.3% Not responsible for grandchildrenWhite alone, not Hispanic / Latino 69 36.1% Responsible for grandchildren122 63.9% Not responsible for grandchildrenHispanic or Latino 17 100.0% Not responsible for grandchildren