Races in Augusta, Maine (ME) Detailed Stats
Ancestries, Foreign-born residents, place of birth
Settings
X


Recent posts about races in Augusta, Maine on our local forum with over 2,400,000 registered users:
 | Great article about Augusta (25 replies) |
| Help!!! finding temp housing around Lewiston - Augusta (8 replies) |
| Maine weather thread (3207 replies) |
| Life is short, let’s check out Maine! (14 replies) |
| Augusta ?'s about revitalization (29 replies) |
| Done with Colorado (12 replies) |
Latest news about races in Augusta, ME collected exclusively by city-data.com from local newspapers, TV, and radio stations
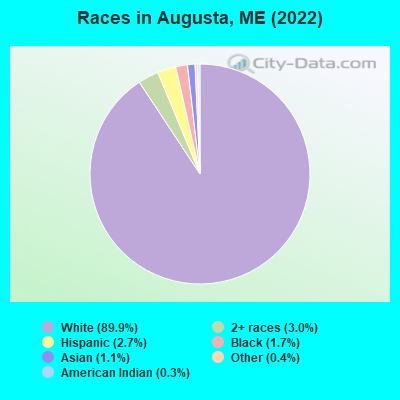
According to 2022 data, the most numerous races in Augusta, ME are White alone (17,234 residents), Two or more races (577 residents), and Hispanic (519 residents). 92.6% of Augusta residents speak English at home. 2.8% of Augusta, ME residents are foreign-born (0.9% born in Europe, 0.8% born in Asia, 0.6% born in North America, 0.3% born in Africa), which is 8.7% less than the foreign-born rate of 3.0% across the entire state of Maine.
Race distribution in Augusta
2000
2022

- 17,74095.6%White alone
- 2451.3%Asian alone
- 2271.2%Two or more races
- 1600.9%Hispanic
- 870.5%Black alone
- 890.5%American Indian alone
- 100.05%Other race alone
- 20.01%Native Hawaiian and Other
Pacific Islander alone

-
- 17,23489.9%White alone
- 5773.0%Two or more races
- 5192.7%Hispanic
- 3301.7%Black alone
- 2181.1%Asian alone
- 790.4%Other race alone
- 490.3%American Indian alone
2000
2022
-
- 1,230,29796.5%White alone
- 11,7310.9%Two or more races
- 9,3600.7%Hispanic
- 9,0140.7%Asian alone
- 6,4400.5%Black alone
- 6,9110.5%American Indian alone
- 8360.07%Other race alone
- 3340.03%Native Hawaiian and Other
Pacific Islander alone

-
- 1,249,23390.2%White alone
- 58,3574.2%Two or more races
- 28,7172.1%Hispanic
- 21,5831.6%Black alone
- 16,1511.2%Asian alone
- 5,8730.4%Other race alone
- 5,2050.4%American Indian alone
- 2210.02%Native Hawaiian and Other
Pacific Islander alone

Income and house value in Augusta
- Median household income in 2022
- $46,833White non-Hispanic householders
- $27,674Black householders
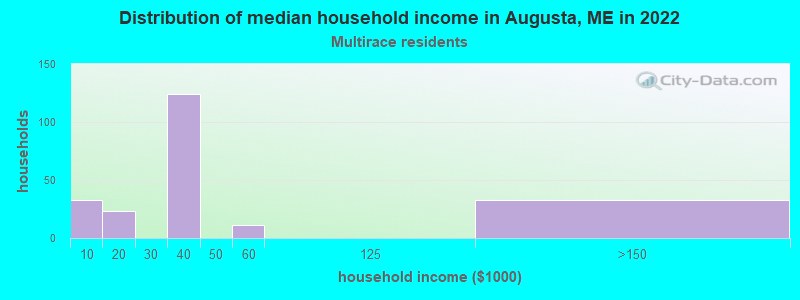
- $34,693Two or more races householders
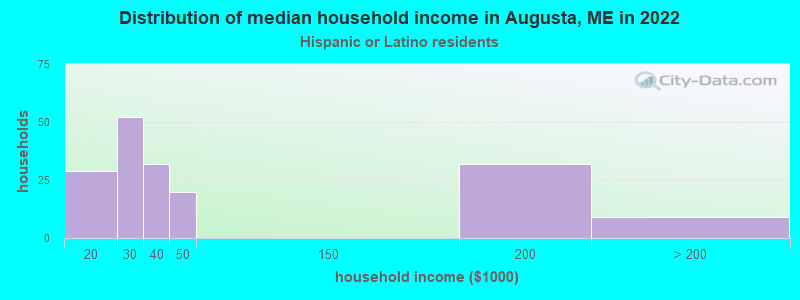
- $24,304Hispanic or Latino race householders
- Median 2022 house value
- $197,370White Non-Hispanic householders
- $337,123Black or African American householders
- $297,403American Indian or Alaska Native householders
- $222,623Asian householders
- $185,356Two or more races householders
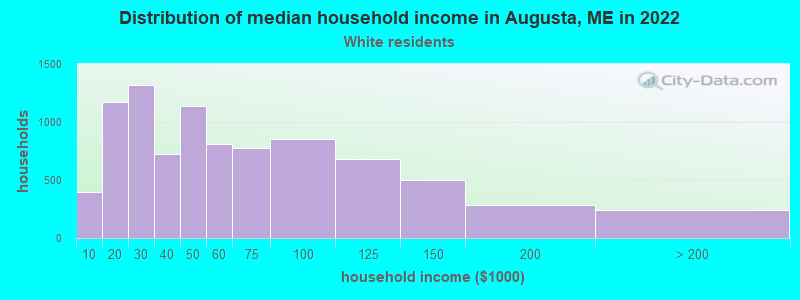
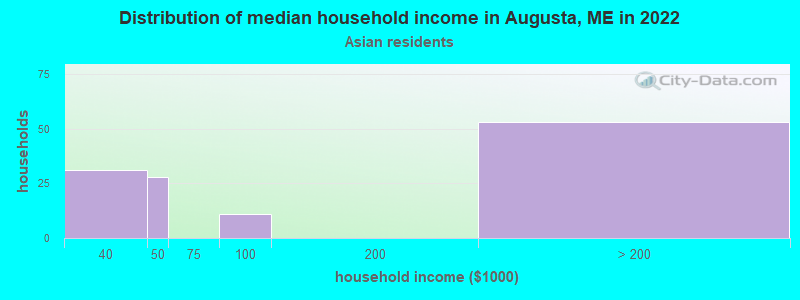
Household income for White non-Hispanic householders
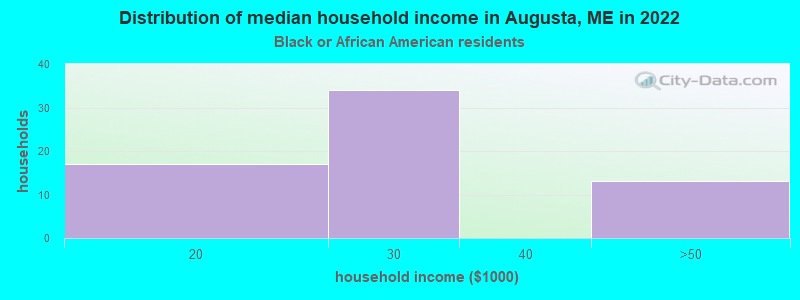
Household income for Black householders
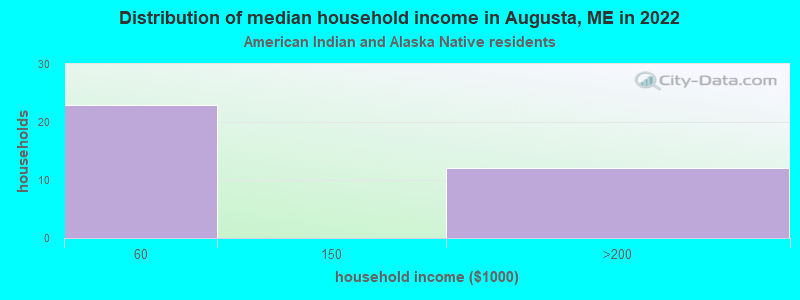
Household income for American Indian and Alaska Native householders
Household income for Asian householders
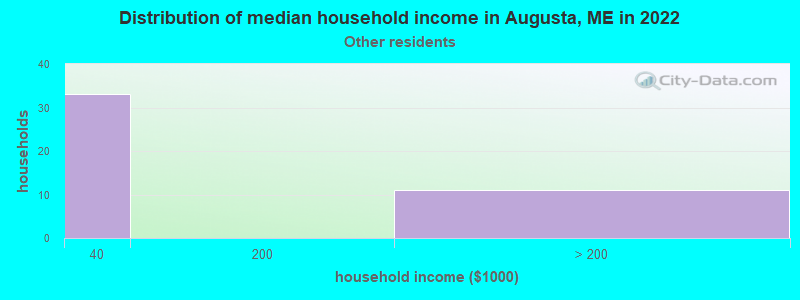
Household income for Some other race householders
Household income for Two or more races householders
Household income for Hispanic or Latino race householders
Median age by race in Augusta
- 46.9Median age for White residents
- 45.6Males
- 47.1Females
- 22.7Median age for Black or African American residents
- 16.5Males
- 27.4Females
- 60.4Median age for American Indian / Alaska Native residents
- 68.2Males
- -708,108,107.4Females
- 67.6Median age for Asian residents
- 81.5Males
- 35.2Females
- -666,666,666.0Median age for Native Hawaiian / Pacific Islander residents
- -666,666,666.0Males
- -666,666,666.0Females
- 17.3Median age for Other race residents
- 23.1Males
- 17.3Females
- 29.6Median age for Two or more races residents
- 18.3Males
- 36.3Females
- 46.9Median age for White alone residents
- 45.6Males
- 47.1Females
- 41.1Median age for Hispanic or Latino residents
- 44.0Males
- 52.4Females
Owner/renter occupied households by race in Augusta
- House owners and renters - White residents
- 4,76254.4%Owner occupied
- 3,99645.6%Renter occupied
- House owners and renters - Black or African American residents
- 5557.2%Owner occupied
- 4142.8%Renter occupied
- House owners and renters - American Indian / Alaska Native residents
- 4576.3%Owner occupied
- 1423.7%Renter occupied
- House owners and renters - Asian residents
- 7150.1%Owner occupied
- 7149.9%Renter occupied
- House owners and renters - Other race residents
- 920.4%Owner occupied
- 3579.6%Renter occupied
- House owners and renters - Two or more races residents
- 13673.5%Owner occupied
- 4926.5%Renter occupied
- House owners and renters - White alone residents
- 4,72454.4%Owner occupied
- 3,95845.6%Renter occupied
- House owners and renters - Hispanic or Latino residents
- 8553.7%Owner occupied
- 7446.3%Renter occupied
Language usage in Augusta
- English speakers - Total
- 92.6% of residents of Augusta speak English at home.
- 1.5% of residents speak Spanish at home
- 24693.2%Speak English very well
- 186.8%Speak English less than very well
- 6.3% of residents speak other language at home
- 81071.6%Speak English very well
- 32128.4%Speak English less than very well
- English speakers - Born in the United States
- 96.5% of residents of Augusta speak English at home.
- 1.2% of residents speak Spanish at home
- 72100.0%Speak English very well
- 2.1% of residents speak other language at home
- 9073.8%Speak English very well
- 3226.2%Speak English less than very well
- English speakers - Native, born elsewhere
- 91.7% of residents of Augusta speak English at home.
- 6.6% of residents speak Spanish at home
- 8100.0%Speak English less than very well
- 19.8% of residents speak other language at home
- 24100.0%Speak English very well
- English speakers - Foreign-born
- 37.1% of residents of Augusta speak English at home.
- 8.8% of residents speak Spanish at home
- 52100.0%Speak English less than very well
- 44.0% of residents speak other language at home
- 17466.7%Speak English very well
- 8733.3%Speak English less than very well
White (Caucasian) - Speak only English
| Native: | 94.5% (15,295) |
| Foreign-born: | 76.8% (210) |
White (Caucasian) - Speak another language
| Native: | 5.8% (939) |
| Foreign-born: | 27.5% (75) |
Black or African American - Speak only English
| Native: | 100.0% (208) |
| Foreign-born: | 10.7% (7) |
Asian - Speak only English
| Native: | 100.0% (81) |
| Foreign-born: | 5.4% (8) |
Asian - Speak another language
| Native: | 2.6% (2) |
| Foreign-born: | 100.0% (149) |
Other race - Speak another language
| Native: | 31.8% (37) |
| Foreign-born: | 82.2% (21) |
Two or more races - Speak another language
| Native: | 5.9% (37) |
| Foreign-born: | 94.2% (18) |
White alone - Speak only English
| Native: | 94.6% (15,110) |
| Foreign-born: | 70.5% (170) |
White alone - Speak another language
| Native: | 5.8% (922) |
| Foreign-born: | 32.1% (77) |
Hispanic or Latino - Speak only English
| Native: | 85.5% (377) |
| Foreign-born: | 77.2% (52) |
Hispanic or Latino - Speak another language
| Native: | 14.3% (63) |
| Foreign-born: | 33.4% (23) |
Foreign-born residents in Augusta
529 residents are foreign born (0.9% Europe, 0.8% Asia, 0.6% North America, 0.3% Africa).
| This city: | 2.8% |
| Maine: | 3.8% |


Marital status for residents in Augusta
Marital status - White (Caucasian) population 15 years and over
- Males
- 42.3%Never married
- 34.2%Now married
- 0.3%Separated
- 3.7%Widowed
- 19.5%Divorced
- Females
- 33.2%Never married
- 29.9%Now married
- 1.6%Separated
- 10.9%Widowed
- 24.4%Divorced
Women who gave birth in the past 12 months
| Now married: | 16.7% (30) |
| Unmarried: | 83.3% (151) |
Women who did not give birth in the past 12 months
| Now married: | 26.4% (950) |
| Unmarried: | 73.6% (2,643) |
Marital status - Black or African American population 15 years and over
- Males
- 84.2%Never married
- 0.0%Now married
- 0.0%Separated
- 0.0%Widowed
- 15.8%Divorced
- Females
- 89.5%Never married
- 0.0%Now married
- 0.0%Separated
- 10.5%Widowed
- 0.0%Divorced
Women who did not give birth in the past 12 months
| Now married: | 0.0% (0) |
| Unmarried: | 100.0% (50) |
Marital status - American Indian / Alaska Native population 15 years and over
- Males
- 86.3%Never married
- 13.7%Now married
- 0.0%Separated
- 0.0%Widowed
- 0.0%Divorced
- Females
- 0.0%Never married
- 0.0%Now married
- 0.0%Separated
- 100.0%Widowed
- 0.0%Divorced
Marital status - Asian population 15 years and over
- Males
- 90.4%Never married
- 9.6%Now married
- 0.0%Separated
- 0.0%Widowed
- 0.0%Divorced
- Females
- 74.2%Never married
- 25.8%Now married
- 0.0%Separated
- 0.0%Widowed
- 0.0%Divorced
Women who did not give birth in the past 12 months
| Now married: | 0.0% (0) |
| Unmarried: | 100.0% (65) |
Marital status - Other race population 15 years and over
- Males
- 30.5%Never married
- 8.5%Now married
- 0.0%Separated
- 0.0%Widowed
- 61.0%Divorced
- Females
- 76.9%Never married
- 0.0%Now married
- 0.0%Separated
- 23.1%Widowed
- 0.0%Divorced
Women who did not give birth in the past 12 months
| Now married: | 0.0% (0) |
| Unmarried: | 100.0% (26) |
Marital status - Two or more races population 15 years and over
- Males
- 62.1%Never married
- 30.0%Now married
- 0.0%Separated
- 0.0%Widowed
- 7.9%Divorced
- Females
- 62.9%Never married
- 34.9%Now married
- 0.0%Separated
- 0.0%Widowed
- 2.2%Divorced
Women who gave birth in the past 12 months
| Now married: | 100.0% (8) |
| Unmarried: | 0.0% (0) |
Women who did not give birth in the past 12 months
| Now married: | 21.5% (41) |
| Unmarried: | 78.5% (151) |
Marital status - White alone, not Hispanic / Latino population 15 years and over
- Males
- 42.2%Never married
- 34.5%Now married
- 0.3%Separated
- 3.6%Widowed
- 19.5%Divorced
- Females
- 33.2%Never married
- 29.9%Now married
- 1.7%Separated
- 11.1%Widowed
- 24.2%Divorced
Women who gave birth in the past 12 months
| Now married: | 16.7% (30) |
| Unmarried: | 83.3% (151) |
Women who did not give birth in the past 12 months
| Now married: | 26.9% (955) |
| Unmarried: | 73.1% (2,596) |
Marital status - Hispanic or Latino population 15 years and over
- Males
- 44.2%Never married
- 20.4%Now married
- 0.0%Separated
- 5.5%Widowed
- 29.8%Divorced
- Females
- 37.0%Never married
- 35.2%Now married
- 0.0%Separated
- 2.7%Widowed
- 25.1%Divorced
Women who did not give birth in the past 12 months
| Now married: | 26.2% (33) |
| Unmarried: | 73.8% (94) |
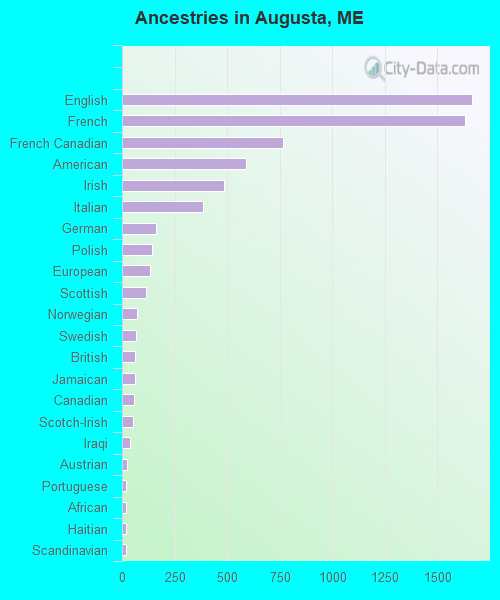
Ancestries in Augusta

- 1,66321.8%English
- 1,63221.4%French
- 76410.0%French Canadian
- 5897.7%American
- 4846.3%Irish
- 3845.0%Italian
- 1642.1%German
- 1421.9%Polish
- 1351.8%European
- 1141.5%Scottish
- 710.9%Norwegian
- 670.9%Swedish
- 610.8%British
- 610.8%Jamaican
- 590.8%Canadian
- 500.7%Scotch-Irish
- 360.5%Iraqi
- 220.3%Austrian
- 210.3%Portuguese
- 200.3%African
- 190.2%Haitian
- 170.2%Scandinavian
- 130.2%Czech
- 110.1%Russian
- 100.1%Northern European
- 90.1%Greek
- 70.09%British West Indian
- 50.07%Albanian
- 50.07%Dutch
- 20.03%Ukrainian
Geographical mobility in Augusta

- Same house 1 year ago
- 15,36988.5%White (Caucasian)
- 31192.7%Black or African American
- 10393.2%American Indian / Alaska Native
- 19787.0%Asian
- 140100.0%Other race
- 52175.1%Two or more races
- 15,14888.4%White alone, not Hispanic / Latino
- 42483.7%Hispanic or Latino

-
- Moved within same county
- 1,2927.4%White / Caucasian
- 257.4%Black or African American
- 104.5%Asian
- 12017.3%Two or more races
- 1,2867.5%White alone, not Hispanic / Latino
- 5711.3%Hispanic or Latino

-
- Moved within same state
- 3271.9%White / Caucasian
- 11.2%American Indian / Alaska Native
- 3271.9%White alone, not Hispanic / Latino

-
- Moved from different state
- 3402.0%White / Caucasian
- 51.5%Black or African American
- 87.5%American Indian / Alaska Native
- 2611.7%Asian
- 111.7%Two or more races
- 3422.0%White alone, not Hispanic / Latino

Children Nativity (place of birth) in Augusta
Place of birth for residents in Augusta
![Place of birth for the foreign-born population - Regions]()
- 172Europe
- 162Asia
- 135Americas
- 110Northern America
- 72Northern Europe
- 70South Central Asia
- 59Africa
- 46South Eastern Asia
- 45Southern Europe
- 37Western Asia
- 36Middle Africa
- 32Western Europe
- 25Latin America
- 25South America
- 21Eastern Europe
- 18Northern Africa
- 7Eastern Asia
- 7China
- 4Eastern Africa

![Place of birth for the foreign-born population - Countries]()
- 110Canada
- 70India
- 45England
- 45Spain
- 37Iraq
- 36Cameroon
- 25Ecuador
- 24Philippines
- 20Netherlands
- 18Sudan
- 17United Kingdom
- 16Vietnam
- 12Germany
- 12Poland
- 9Norway
- 9Russia
- 7China
- 6Burma (Myanmar)
- 4Ethiopia

Grandparents responsible for own grandchildren in Augusta
Zip codes: 04330.