Races in Auburndale, Florida (FL) Detailed Stats
Data:
Races - White alone (%)
Races - White alone (% change since 2000)
Races - Black alone (%)
Races - Black alone (% change since 2000)
Races - American Indian alone (%)
Races - American Indian alone (% change since 2000)
Races - Asian alone (%)
Races - Asian alone (% change since 2000)
Races - Hispanic (%)
Races - Hispanic (% change since 2000)
Races - Native Hawaiian and Other Pacific Islander alone (%)
Races - Native Hawaiian and Other Pacific Islander alone (% change since 2000)
Races - Two or more races(%)
Races - Two or more races(% change since 2000)
Races - Other race alone (%)
Races - Other race alone (% change since 2000)
Racial diversity
Place of birth - Born in state of residence (%)
Place of birth - Born in state of residence (%) - White
Place of birth - Born in state of residence (%) - Black or African American
Place of birth - Born in state of residence (%) - Asian
Place of birth - Born in state of residence (%) - Hispanic or Latino
Place of birth - Born in state of residence (%) - American Indian and Alaska Native
Place of birth - Born in state of residence (%) - Multirace
Place of birth - Born in state of residence (%) - Other Race
Place of birth - Born in other state (%)
Place of birth - Born in other state (%) - White
Place of birth - Born in other state (%) - Black or African American
Place of birth - Born in other state (%) - Asian
Place of birth - Born in other state (%) - Hispanic or Latino
Place of birth - Born in other state (%) - American Indian and Alaska Native
Place of birth - Born in other state (%) - Multirace
Place of birth - Born in other state (%) - Other Race
Place of birth - Native, outside of US (%)
Place of birth - Native, outside of US (%) - White
Place of birth - Native, outside of US (%) - Black or African American
Place of birth - Native, outside of US (%) - Asian
Place of birth - Native, outside of US (%) - Hispanic or Latino
Place of birth - Native, outside of US (%) - American Indian and Alaska Native
Place of birth - Native, outside of US (%) - Multirace
Place of birth - Native, outside of US (%) - Other Race
Place of birth - Foreign born (%)
Place of birth - Foreign born (%) - White
Place of birth - Foreign born (%) - Black or African American
Place of birth - Foreign born (%) - Asian
Place of birth - Foreign born (%) - Hispanic or Latino
Place of birth - Foreign born (%) - American Indian and Alaska Native
Place of birth - Foreign born (%) - Multirace
Place of birth - Foreign born (%) - Other Race
Residents speaking English at home (%)
Residents speaking English at home - Born in the United States (%)
Residents speaking English at home - Native, born elsewhere (%)
Residents speaking English at home - Foreign born (%)
Residents speaking Spanish at home (%)
Residents speaking Spanish at home - Born in the United States (%)
Residents speaking Spanish at home - Native, born elsewhere (%)
Residents speaking Spanish at home - Foreign born (%)
Residents speaking other language at home (%)
Residents speaking other language at home - Born in the United States (%)
Residents speaking other language at home - Native, born elsewhere (%)
Residents speaking other language at home - Foreign born (%)
Marital status - Never married (%)
Marital status - Now married (%)
Marital status - Separated (%)
Marital status - Widowed (%)
Marital status - Divorced (%)
Ancestries Reported - Arab (%)
Ancestries Reported - Czech (%)
Ancestries Reported - Danish (%)
Ancestries Reported - Dutch (%)
Ancestries Reported - English (%)
Ancestries Reported - French (%)
Ancestries Reported - French Canadian (%)
Ancestries Reported - German (%)
Ancestries Reported - Greek (%)
Ancestries Reported - Hungarian (%)
Ancestries Reported - Irish (%)
Ancestries Reported - Italian (%)
Ancestries Reported - Lithuanian (%)
Ancestries Reported - Norwegian (%)
Ancestries Reported - Polish (%)
Ancestries Reported - Portuguese (%)
Ancestries Reported - Russian (%)
Ancestries Reported - Scotch-Irish (%)
Ancestries Reported - Scottish (%)
Ancestries Reported - Slovak (%)
Ancestries Reported - Subsaharan African (%)
Ancestries Reported - Swedish (%)
Ancestries Reported - Swiss (%)
Ancestries Reported - Ukrainian (%)
Ancestries Reported - United States (%)
Ancestries Reported - Welsh (%)
Ancestries Reported - West Indian (%)
Ancestries Reported - Other (%)
Geographical mobility - Same house 1 year ago (%)
Geographical mobility - Same house 1 year ago (%) - White
Geographical mobility - Same house 1 year ago (%) - Black or African American
Geographical mobility - Same house 1 year ago (%) - Asian
Geographical mobility - Same house 1 year ago (%) - Hispanic or Latino
Geographical mobility - Same house 1 year ago (%) - American Indian and Alaska Native
Geographical mobility - Same house 1 year ago (%) - Multirace
Geographical mobility - Same house 1 year ago (%) - Other Race
Geographical mobility - Moved within same county (%)
Geographical mobility - Moved within same county (%) - White
Geographical mobility - Moved within same county (%) - Black or African American
Geographical mobility - Moved within same county (%) - Asian
Geographical mobility - Moved within same county (%) - Hispanic or Latino
Geographical mobility - Moved within same county (%) - American Indian and Alaska Native
Geographical mobility - Moved within same county (%) - Multirace
Geographical mobility - Moved within same county (%) - Other Race
Geographical mobility - Moved from different county within same state (%)
Geographical mobility - Moved from different county within same state (%) - White
Geographical mobility - Moved from different county within same state (%) - Black or African American
Geographical mobility - Moved from different county within same state (%) - Asian
Geographical mobility - Moved from different county within same state (%) - Hispanic or Latino
Geographical mobility - Moved from different county within same state (%) - American Indian and Alaska Native
Geographical mobility - Moved from different county within same state (%) - Multirace
Geographical mobility - Moved from different county within same state (%) - Other Race
Geographical mobility - Moved from different state (%)
Geographical mobility - Moved from different state (%) - White
Geographical mobility - Moved from different state (%) - Black or African American
Geographical mobility - Moved from different state (%) - Asian
Geographical mobility - Moved from different state (%) - Hispanic or Latino
Geographical mobility - Moved from different state (%) - American Indian and Alaska Native
Geographical mobility - Moved from different state (%) - Multirace
Geographical mobility - Moved from different state (%) - Other Race
Geographical mobility - Moved from abroad (%)
Geographical mobility - Moved from abroad (%) - White
Geographical mobility - Moved from abroad (%) - Black or African American
Geographical mobility - Moved from abroad (%) - Asian
Geographical mobility - Moved from abroad (%) - Hispanic or Latino
Geographical mobility - Moved from abroad (%) - American Indian and Alaska Native
Geographical mobility - Moved from abroad (%) - Multirace
Geographical mobility - Moved from abroad (%) - Other Race
Place of birth for the foreign-born population - Ireland (%)
Place of birth for the foreign-born population - Denmark (%)
Place of birth for the foreign-born population - Norway (%)
Place of birth for the foreign-born population - Sweden (%)
Place of birth for the foreign-born population - United Kingdom (%)
Place of birth for the foreign-born population - England (%)
Place of birth for the foreign-born population - Scotland (%)
Place of birth for the foreign-born population - Other Northern Europe (%)
Place of birth for the foreign-born population - Austria (%)
Place of birth for the foreign-born population - Belgium (%)
Place of birth for the foreign-born population - France (%)
Place of birth for the foreign-born population - Germany (%)
Place of birth for the foreign-born population - Netherlands (%)
Place of birth for the foreign-born population - Switzerland (%)
Place of birth for the foreign-born population - Other Western Europe (%)
Place of birth for the foreign-born population - Greece (%)
Place of birth for the foreign-born population - Italy (%)
Place of birth for the foreign-born population - Portugal (%)
Place of birth for the foreign-born population - Spain (%)
Place of birth for the foreign-born population - Other Southern Europe (%)
Place of birth for the foreign-born population - Albania (%)
Place of birth for the foreign-born population - Belarus (%)
Place of birth for the foreign-born population - Bosnia and Herzegovina (%)
Place of birth for the foreign-born population - Bulgaria (%)
Place of birth for the foreign-born population - Croatia (%)
Place of birth for the foreign-born population - Czechoslovakia (%)
Place of birth for the foreign-born population - Hungary (%)
Place of birth for the foreign-born population - Latvia (%)
Place of birth for the foreign-born population - Lithuania (%)
Place of birth for the foreign-born population - North Macedonia (Macedonia) (%)
Place of birth for the foreign-born population - Moldova (%)
Place of birth for the foreign-born population - Poland (%)
Place of birth for the foreign-born population - Romania (%)
Place of birth for the foreign-born population - Russia (%)
Place of birth for the foreign-born population - Serbia (%)
Place of birth for the foreign-born population - Ukraine (%)
Place of birth for the foreign-born population - Other Eastern Europe (%)
Place of birth for the foreign-born population - China (%)
Place of birth for the foreign-born population - Hong Kong (%)
Place of birth for the foreign-born population - Taiwan (%)
Place of birth for the foreign-born population - Japan (%)
Place of birth for the foreign-born population - Korea (%)
Place of birth for the foreign-born population - Other Eastern Asia (%)
Place of birth for the foreign-born population - Afghanistan (%)
Place of birth for the foreign-born population - Bangladesh (%)
Place of birth for the foreign-born population - India (%)
Place of birth for the foreign-born population - Iran (%)
Place of birth for the foreign-born population - Kazakhstan (%)
Place of birth for the foreign-born population - Nepal (%)
Place of birth for the foreign-born population - Pakistan (%)
Place of birth for the foreign-born population - Sri Lanka (%)
Place of birth for the foreign-born population - Uzbekistan (%)
Place of birth for the foreign-born population - Other South Central Asia (%)
Place of birth for the foreign-born population - Burma (%)
Place of birth for the foreign-born population - Cambodia (%)
Place of birth for the foreign-born population - Indonesia (%)
Place of birth for the foreign-born population - Laos (%)
Place of birth for the foreign-born population - Malaysia (%)
Place of birth for the foreign-born population - Philippines (%)
Place of birth for the foreign-born population - Singapore (%)
Place of birth for the foreign-born population - Thailand (%)
Place of birth for the foreign-born population - Vietnam (%)
Place of birth for the foreign-born population - Other South Eastern Asia (%)
Place of birth for the foreign-born population - Armenia (%)
Place of birth for the foreign-born population - Iraq (%)
Place of birth for the foreign-born population - Israel (%)
Place of birth for the foreign-born population - Jordan (%)
Place of birth for the foreign-born population - Kuwait (%)
Place of birth for the foreign-born population - Lebanon (%)
Place of birth for the foreign-born population - Saudi Arabia (%)
Place of birth for the foreign-born population - Syria (%)
Place of birth for the foreign-born population - Turkey (%)
Place of birth for the foreign-born population - Yemen (%)
Place of birth for the foreign-born population - Other Western Asia (%)
Place of birth for the foreign-born population - Eritrea (%)
Place of birth for the foreign-born population - Ethiopia (%)
Place of birth for the foreign-born population - Kenya (%)
Place of birth for the foreign-born population - Somalia (%)
Place of birth for the foreign-born population - Uganda (%)
Place of birth for the foreign-born population - Zimbabwe (%)
Place of birth for the foreign-born population - Other Eastern Africa (%)
Place of birth for the foreign-born population - Cameroon (%)
Place of birth for the foreign-born population - Congo (%)
Place of birth for the foreign-born population - Democratic Republic of Congo (Zaire) (%)
Place of birth for the foreign-born population - Other Middle Africa (%)
Place of birth for the foreign-born population - Egypt (%)
Place of birth for the foreign-born population - Morocco (%)
Place of birth for the foreign-born population - Sudan (%)
Place of birth for the foreign-born population - Other Northern Africa (%)
Place of birth for the foreign-born population - South Africa (%)
Place of birth for the foreign-born population - Other Southern Africa (%)
Place of birth for the foreign-born population - Cabo Verde (%)
Place of birth for the foreign-born population - Ghana (%)
Place of birth for the foreign-born population - Liberia (%)
Place of birth for the foreign-born population - Nigeria (%)
Place of birth for the foreign-born population - Senegal (%)
Place of birth for the foreign-born population - Sierra Leone (%)
Place of birth for the foreign-born population - Other Western Africa (%)
Place of birth for the foreign-born population - Australia (%)
Place of birth for the foreign-born population - New Zealand (%)
Place of birth for the foreign-born population - Fiji (%)
Place of birth for the foreign-born population - Micronesia (%)
Place of birth for the foreign-born population - Bahamas (%)
Place of birth for the foreign-born population - Barbados (%)
Place of birth for the foreign-born population - Cuba (%)
Place of birth for the foreign-born population - Dominica (%)
Place of birth for the foreign-born population - Dominican Republic (%)
Place of birth for the foreign-born population - Grenada (%)
Place of birth for the foreign-born population - Haiti (%)
Place of birth for the foreign-born population - Jamaica (%)
Place of birth for the foreign-born population - St. Vincent and the Grenadines (%)
Place of birth for the foreign-born population - Trinidad and Tobago (%)
Place of birth for the foreign-born population - West Indies (%)
Place of birth for the foreign-born population - Other Caribbean (%)
Place of birth for the foreign-born population - Belize (%)
Place of birth for the foreign-born population - Costa Rica (%)
Place of birth for the foreign-born population - El Salvador (%)
Place of birth for the foreign-born population - Guatemala (%)
Place of birth for the foreign-born population - Honduras (%)
Place of birth for the foreign-born population - Mexico (%)
Place of birth for the foreign-born population - Nicaragua (%)
Place of birth for the foreign-born population - Panama (%)
Place of birth for the foreign-born population - Other Central America (%)
Place of birth for the foreign-born population - Argentina (%)
Place of birth for the foreign-born population - Bolivia (%)
Place of birth for the foreign-born population - Brazil (%)
Place of birth for the foreign-born population - Chile (%)
Place of birth for the foreign-born population - Colombia (%)
Place of birth for the foreign-born population - Ecuador (%)
Place of birth for the foreign-born population - Guyana (%)
Place of birth for the foreign-born population - Peru (%)
Place of birth for the foreign-born population - Uruguay (%)
Place of birth for the foreign-born population - Venezuela (%)
Place of birth for the foreign-born population - Other South America (%)
Place of birth for the foreign-born population - Canada (%)
Place of birth for the foreign-born population - Other Northern America (%)
Place of birth for the foreign-born population - Other (%)
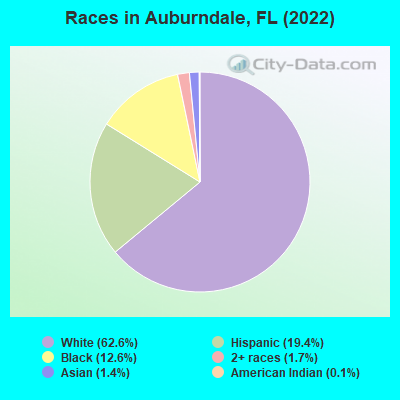
According to 2022 data, the most numerous races in Auburndale, FL are White alone (11,002 residents), Hispanic (3,402 residents), and Black alone (2,214 residents). 77.4% of Auburndale residents speak English at home. 9.1% of Auburndale, FL residents are foreign-born (7.3% born in Latin America, 1.2% born in Asia), which is 129.9% less than the foreign-born rate of 21.0% across the entire state of Florida.
Race distribution in Auburndale
2000 2022
10,458,509 65.4% White alone 2,682,715 16.8% Hispanic 2,264,268 14.2% Black alone 261,693 1.6% Asian alone 236,954 1.5% Two or more races 42,358 0.3% American Indian alone 28,994 0.2% Other race alone 6,887 0.04% Native Hawaiian and Other
11,309,403 50.8% White alone 6,025,039 27.1% Hispanic 3,241,015 14.6% Black alone 861,630 3.9% Two or more races 623,692 2.8% Asian alone 152,054 0.7% Other race alone 22,504 0.1% American Indian alone 9,486 0.04% Native Hawaiian and Other
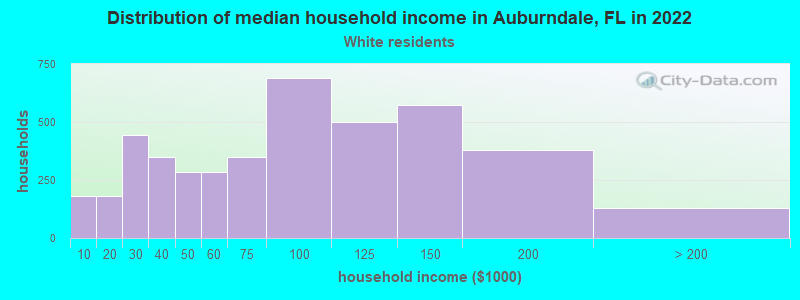
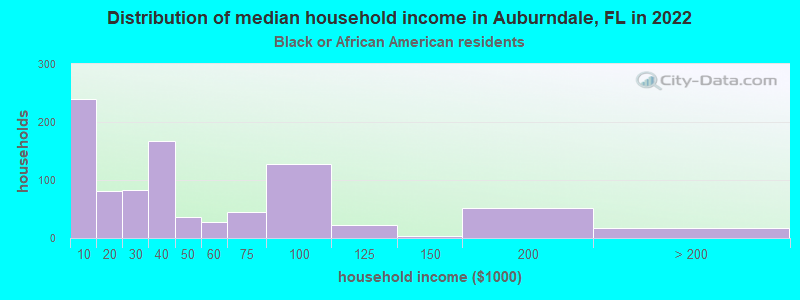
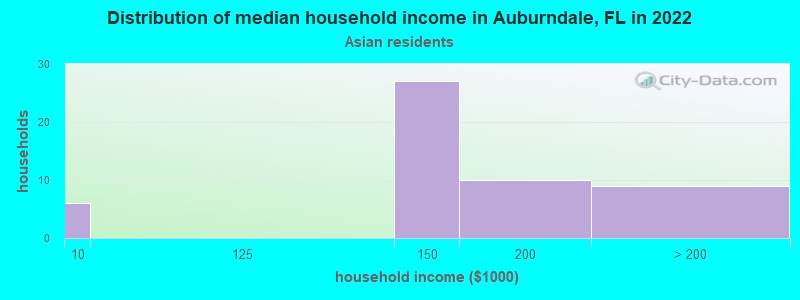
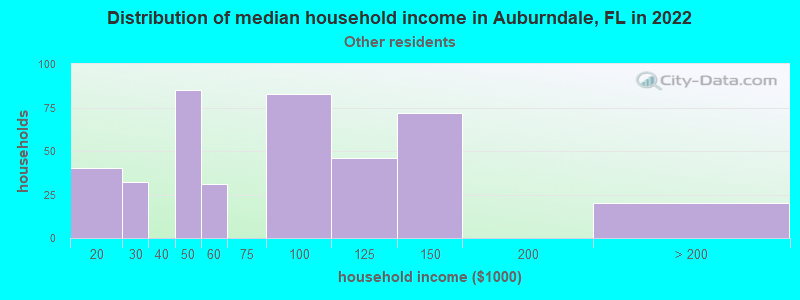
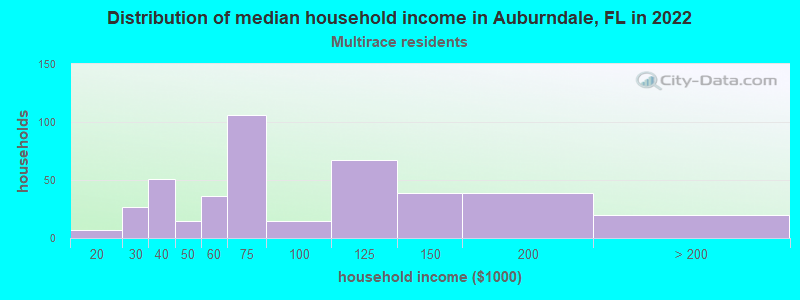
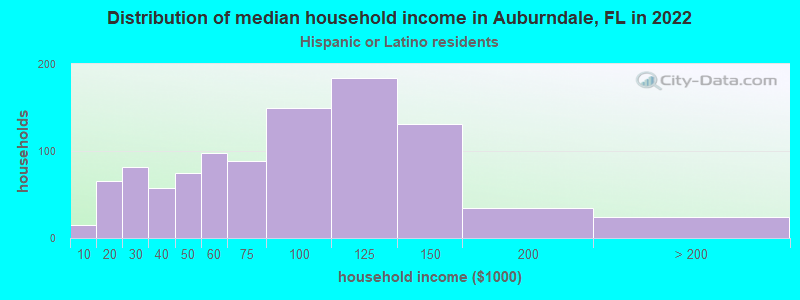
Income and house value in Auburndale Median household income in 2022 $74,985 White non-Hispanic householders$30,139 Black householders$144,026 Asian householders$82,925 Some other race householders$73,524 Two or more races householders$75,531 Hispanic or Latino race householdersMedian 2022 house value $312,980 White Non-Hispanic householders$194,827 Black or African American householders $739,925 Asian householders$576,102 Some other race householders$427,782 Two or more races householders$530,433 Hispanic or Latino householders
Median age by race in Auburndale
43.2 Median age for White residents42.1 46.1 38.1 Median age for Black or African American residents43.2 33.8 -898,856,639.4 Median age for American Indian / Alaska Native residents-899,908,171.7 -834,555,826.4 48.5 Median age for Asian residents51.3 32.7 -679,849,340.2 Median age for Native Hawaiian / Pacific Islander residents-858,307,848.3 -443,298,968.6 32.1 Median age for Other race residents22.7 44.7 33.5 Median age for Two or more races residents44.9 31.0 44.0 Median age for White alone residents42.7 45.4 32.6 Median age for Hispanic or Latino residents31.4 32.2
Owner/renter occupied households by race in Auburndale
House owners and renters - White residents 3,248 76.6% Owner occupied992 23.4% Renter occupiedHouse owners and renters - Black or African American residents 129 16.4% Owner occupied658 83.6% Renter occupiedHouse owners and renters - Asian residents 54 100.0% Owner occupiedHouse owners and renters - Other race residents 355 77.4% Owner occupied104 22.6% Renter occupiedHouse owners and renters - Two or more races residents 333 74.2% Owner occupied116 25.8% Renter occupiedHouse owners and renters - White alone residents 3,142 76.9% Owner occupied944 23.1% Renter occupiedHouse owners and renters - Hispanic or Latino residents 676 67.2% Owner occupied330 32.8% Renter occupied
Language usage in Auburndale
English speakers - Total 77.4% of residents of Auburndale speak English at home.
13.6% of residents speak Spanish at home 1,381 62.0% Speak English very well848 38.0% Speak English less than very well8.4% of residents speak other language at home 488 35.3% Speak English very well894 64.7% Speak English less than very well
English speakers - Born in the United States 91.1% of residents of Auburndale speak English at home.
7.8% of residents speak Spanish at home 440 96.9% Speak English very well14 3.1% Speak English less than very well1.1% of residents speak other language at home 66 100.0% Speak English very well
English speakers - Native, born elsewhere 23.4% of residents of Auburndale speak English at home.
59.6% of residents speak Spanish at home 450 53.7% Speak English very well388 46.3% Speak English less than very well20.6% of residents speak other language at home 126 43.6% Speak English very well163 56.4% Speak English less than very well
English speakers - Foreign-born 26.2% of residents of Auburndale speak English at home.
27.4% of residents speak Spanish at home 121 23.8% Speak English very well387 76.2% Speak English less than very well50.0% of residents speak other language at home 235 25.3% Speak English very well693 74.7% Speak English less than very well
White (Caucasian) - Speak only English Native:
96.5% (10,210)Foreign-born:
74.8% (193)
White (Caucasian) - Speak another language Native:
4.6% (489)Foreign-born:
40.9% (106)
Black or African American - Speak only English Native:
79.7% (1,145)Foreign-born:
20.3% (158)
Black or African American - Speak another language Native:
20.0% (287)Foreign-born:
82.8% (644)
Asian - Speak another language Native:
100.0% (33)Foreign-born:
84.7% (176)
Other race - Speak another language Native:
85.3% (718)Foreign-born:
100.0% (335)
Two or more races - Speak only English Native:
64.1% (527)Foreign-born:
80.3% (96)
Two or more races - Speak another language Native:
35.1% (288)Foreign-born:
41.7% (50)
White alone - Speak only English Native:
97.9% (9,962)Foreign-born:
89.2% (114)
White alone - Speak another language Native:
2.1% (214)Foreign-born:
18.6% (24)
Hispanic or Latino - Speak only English Native:
35.6% (892)Foreign-born:
20.7% (128)
Hispanic or Latino - Speak another language Native:
63.7% (1,594)Foreign-born:
81.1% (500)
Foreign-born residents in Auburndale 1,605 residents are foreign born (7.3% Latin America , 1.2% Asia ).
This city:
9.1%Florida:
21.1%
Marital status for residents in Auburndale Marital status - White (Caucasian) population 15 years and over
Males 29.7% Never married53.0% Now married3.6% Separated3.0% Widowed10.7% DivorcedFemales 23.3% Never married45.3% Now married0.8% Separated12.3% Widowed18.2% DivorcedWomen who gave birth in the past 12 months Now married:
72.5% (64)Unmarried:
27.5% (24)
Women who did not give birth in the past 12 months Now married:
35.9% (784)Unmarried:
64.1% (1,403)
Marital status - Black or African American population 15 years and over
Males 47.8% Never married34.1% Now married3.0% Separated2.7% Widowed12.4% DivorcedFemales 40.2% Never married21.7% Now married5.8% Separated22.1% Widowed10.1% DivorcedWomen who gave birth in the past 12 months Now married:
100.0% (14)Unmarried:
0.0% (0)
Women who did not give birth in the past 12 months Now married:
21.3% (170)Unmarried:
78.7% (627)
Marital status - Asian population 15 years and over
Males 22.0% Never married78.0% Now married0.0% Separated0.0% Widowed0.0% DivorcedFemales 16.5% Never married83.5% Now married0.0% Separated0.0% Widowed0.0% DivorcedWomen who did not give birth in the past 12 months Now married:
75.0% (59)Unmarried:
25.0% (20)
Marital status - Other race population 15 years and over
Males 57.3% Never married42.7% Now married0.0% Separated0.0% Widowed0.0% DivorcedFemales 33.6% Never married43.3% Now married5.8% Separated1.9% Widowed15.4% DivorcedWomen who gave birth in the past 12 months Now married:
100.0% (18)Unmarried:
0.0% (0)
Women who did not give birth in the past 12 months Now married:
45.9% (229)Unmarried:
54.1% (269)
Marital status - Two or more races population 15 years and over
Males 48.5% Never married43.6% Now married0.0% Separated2.9% Widowed5.0% DivorcedFemales 14.1% Never married64.8% Now married0.0% Separated0.0% Widowed21.1% DivorcedWomen who did not give birth in the past 12 months Now married:
44.6% (68)Unmarried:
55.4% (84)
Marital status - White alone, not Hispanic / Latino population 15 years and over
Males 28.4% Never married55.0% Now married3.9% Separated3.2% Widowed9.6% DivorcedFemales 22.9% Never married46.3% Now married0.9% Separated11.2% Widowed18.7% DivorcedWomen who gave birth in the past 12 months Now married:
75.3% (55)Unmarried:
24.7% (18)
Women who did not give birth in the past 12 months Now married:
36.5% (776)Unmarried:
63.5% (1,351)
Marital status - Hispanic or Latino population 15 years and over
Males 44.6% Never married41.1% Now married1.3% Separated1.6% Widowed11.4% DivorcedFemales 26.4% Never married44.0% Now married1.9% Separated11.7% Widowed15.9% DivorcedWomen who gave birth in the past 12 months Now married:
74.4% (35)Unmarried:
25.6% (12)
Women who did not give birth in the past 12 months Now married:
41.0% (375)Unmarried:
59.0% (541)
Ancestries in Auburndale
4,286 40.4% American947 8.9% Haitian583 5.5% English360 3.4% German263 2.5% Irish167 1.6% Italian127 1.2% French119 1.1% Jamaican70 0.7% Polish60 0.6% European60 0.6% Scottish43 0.4% Scandinavian41 0.4% West Indian33 0.3% Dutch31 0.3% Canadian30 0.3% Northern European29 0.3% Arab15 0.1% Norwegian11 0.1% Hungarian9 0.08% Danish9 0.08% Swiss7 0.07% Greek6 0.06% Czechoslovakian6 0.06% Scotch-Irish6 0.06% Ethiopian5 0.05% French Canadian3 0.03% Russian2 0.02% British
Children Nativity (place of birth) in Auburndale
Children under 6 years - Living with two parents Both parents native 609 100.0% NativeOne native, one foreign-born parent 51 100.0% NativeChildren under 6 years - Living with one parent Native parent 353 100.0% NativeForeign-born parent 180 100.0% NativeChildren 6 to 17 years - Living with two parents Both parents native 1,266 100.0% Native0 0.0% Foreign-bornBoth parents foreign-born 146 88.0% Native20 12.0% Foreign-bornOne native, one foreign-born parent 114 100.0% NativeChildren 6 to 17 years - Living with one parent Native parent 976 100.0% NativeForeign-born parent 141 65.5% Native74 34.5% Foreign-born
Grandparents responsible for own grandchildren in Auburndale
Grandparents (30 to 59 years) White / Caucasian 90 76.7% Responsible for grandchildren27 23.3% Not responsible for grandchildrenTwo or more races 19 100.0% Responsible for grandchildrenWhite alone, not Hispanic / Latino 105 78.0% Responsible for grandchildren30 22.0% Not responsible for grandchildrenHispanic or Latino 9 35.0% Responsible for grandchildren17 65.0% Not responsible for grandchildrenGrandparents (60 years and over) White / Caucasian 51 20.3% Responsible for grandchildren201 79.7% Not responsible for grandchildrenWhite alone, not Hispanic / Latino 60 23.9% Responsible for grandchildren191 76.1% Not responsible for grandchildrenHispanic or Latino 15 100.0% Not responsible for grandchildren