Races in Atlanta, Georgia (GA) Detailed Stats
Data:
Races - White alone (%)
Races - White alone (% change since 2000)
Races - Black alone (%)
Races - Black alone (% change since 2000)
Races - American Indian alone (%)
Races - American Indian alone (% change since 2000)
Races - Asian alone (%)
Races - Asian alone (% change since 2000)
Races - Hispanic (%)
Races - Hispanic (% change since 2000)
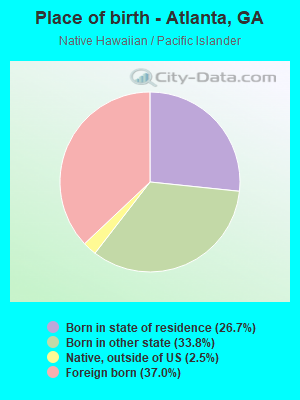
Races - Native Hawaiian and Other Pacific Islander alone (%)
Races - Native Hawaiian and Other Pacific Islander alone (% change since 2000)
Races - Two or more races(%)
Races - Two or more races(% change since 2000)
Races - Other race alone (%)
Races - Other race alone (% change since 2000)
Racial diversity
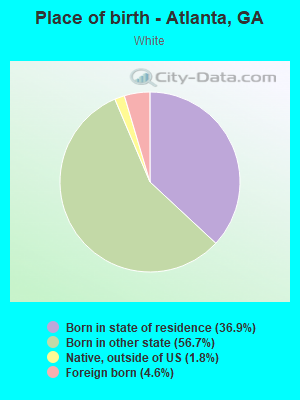
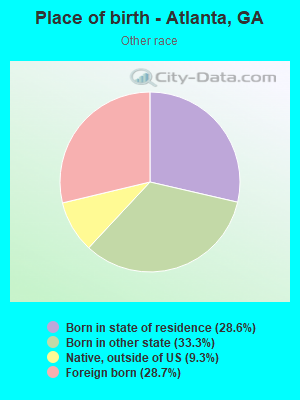
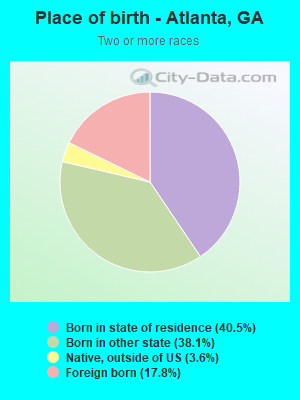
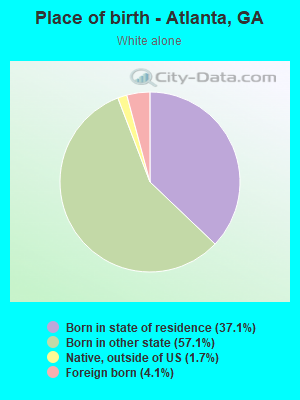
Place of birth - Born in state of residence (%)
Place of birth - Born in state of residence (%) - White
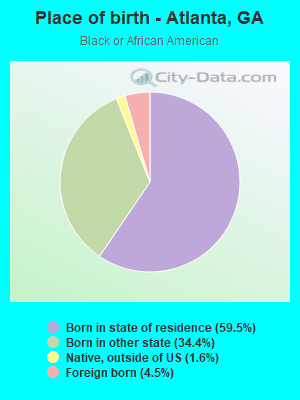
Place of birth - Born in state of residence (%) - Black or African American
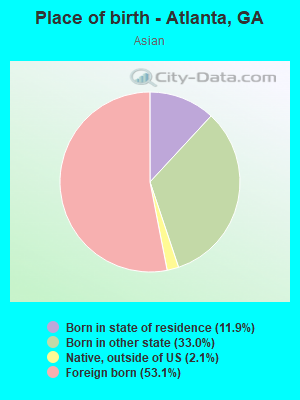
Place of birth - Born in state of residence (%) - Asian
Place of birth - Born in state of residence (%) - Hispanic or Latino
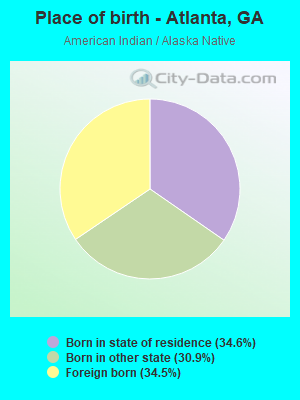
Place of birth - Born in state of residence (%) - American Indian and Alaska Native
Place of birth - Born in state of residence (%) - Multirace
Place of birth - Born in state of residence (%) - Other Race
Place of birth - Born in other state (%)
Place of birth - Born in other state (%) - White
Place of birth - Born in other state (%) - Black or African American
Place of birth - Born in other state (%) - Asian
Place of birth - Born in other state (%) - Hispanic or Latino
Place of birth - Born in other state (%) - American Indian and Alaska Native
Place of birth - Born in other state (%) - Multirace
Place of birth - Born in other state (%) - Other Race
Place of birth - Native, outside of US (%)
Place of birth - Native, outside of US (%) - White
Place of birth - Native, outside of US (%) - Black or African American
Place of birth - Native, outside of US (%) - Asian
Place of birth - Native, outside of US (%) - Hispanic or Latino
Place of birth - Native, outside of US (%) - American Indian and Alaska Native
Place of birth - Native, outside of US (%) - Multirace
Place of birth - Native, outside of US (%) - Other Race
Place of birth - Foreign born (%)
Place of birth - Foreign born (%) - White
Place of birth - Foreign born (%) - Black or African American
Place of birth - Foreign born (%) - Asian
Place of birth - Foreign born (%) - Hispanic or Latino
Place of birth - Foreign born (%) - American Indian and Alaska Native
Place of birth - Foreign born (%) - Multirace
Place of birth - Foreign born (%) - Other Race
Residents speaking English at home (%)
Residents speaking English at home - Born in the United States (%)
Residents speaking English at home - Native, born elsewhere (%)
Residents speaking English at home - Foreign born (%)
Residents speaking Spanish at home (%)
Residents speaking Spanish at home - Born in the United States (%)
Residents speaking Spanish at home - Native, born elsewhere (%)
Residents speaking Spanish at home - Foreign born (%)
Residents speaking other language at home (%)
Residents speaking other language at home - Born in the United States (%)
Residents speaking other language at home - Native, born elsewhere (%)
Residents speaking other language at home - Foreign born (%)
Marital status - Never married (%)
Marital status - Now married (%)
Marital status - Separated (%)
Marital status - Widowed (%)
Marital status - Divorced (%)
Ancestries Reported - Arab (%)
Ancestries Reported - Czech (%)
Ancestries Reported - Danish (%)
Ancestries Reported - Dutch (%)
Ancestries Reported - English (%)
Ancestries Reported - French (%)
Ancestries Reported - French Canadian (%)
Ancestries Reported - German (%)
Ancestries Reported - Greek (%)
Ancestries Reported - Hungarian (%)
Ancestries Reported - Irish (%)
Ancestries Reported - Italian (%)
Ancestries Reported - Lithuanian (%)
Ancestries Reported - Norwegian (%)
Ancestries Reported - Polish (%)
Ancestries Reported - Portuguese (%)
Ancestries Reported - Russian (%)
Ancestries Reported - Scotch-Irish (%)
Ancestries Reported - Scottish (%)
Ancestries Reported - Slovak (%)
Ancestries Reported - Subsaharan African (%)
Ancestries Reported - Swedish (%)
Ancestries Reported - Swiss (%)
Ancestries Reported - Ukrainian (%)
Ancestries Reported - United States (%)
Ancestries Reported - Welsh (%)
Ancestries Reported - West Indian (%)
Ancestries Reported - Other (%)
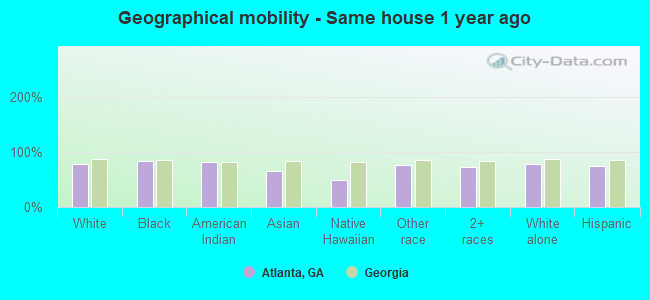
Geographical mobility - Same house 1 year ago (%)
Geographical mobility - Same house 1 year ago (%) - White
Geographical mobility - Same house 1 year ago (%) - Black or African American
Geographical mobility - Same house 1 year ago (%) - Asian
Geographical mobility - Same house 1 year ago (%) - Hispanic or Latino
Geographical mobility - Same house 1 year ago (%) - American Indian and Alaska Native
Geographical mobility - Same house 1 year ago (%) - Multirace
Geographical mobility - Same house 1 year ago (%) - Other Race
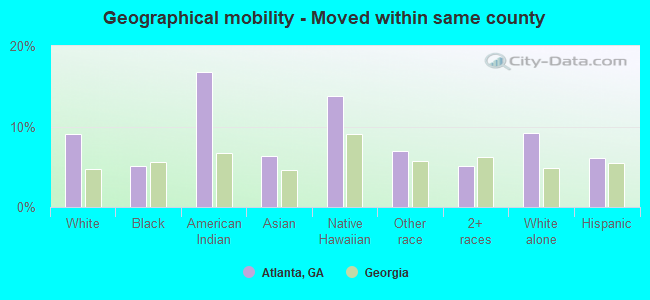
Geographical mobility - Moved within same county (%)
Geographical mobility - Moved within same county (%) - White
Geographical mobility - Moved within same county (%) - Black or African American
Geographical mobility - Moved within same county (%) - Asian
Geographical mobility - Moved within same county (%) - Hispanic or Latino
Geographical mobility - Moved within same county (%) - American Indian and Alaska Native
Geographical mobility - Moved within same county (%) - Multirace
Geographical mobility - Moved within same county (%) - Other Race
Geographical mobility - Moved from different county within same state (%)
Geographical mobility - Moved from different county within same state (%) - White
Geographical mobility - Moved from different county within same state (%) - Black or African American
Geographical mobility - Moved from different county within same state (%) - Asian
Geographical mobility - Moved from different county within same state (%) - Hispanic or Latino
Geographical mobility - Moved from different county within same state (%) - American Indian and Alaska Native
Geographical mobility - Moved from different county within same state (%) - Multirace
Geographical mobility - Moved from different county within same state (%) - Other Race
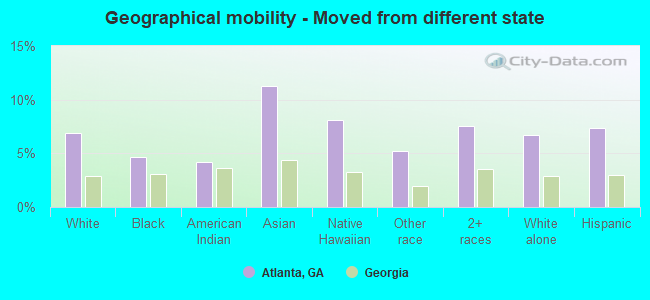
Geographical mobility - Moved from different state (%)
Geographical mobility - Moved from different state (%) - White
Geographical mobility - Moved from different state (%) - Black or African American
Geographical mobility - Moved from different state (%) - Asian
Geographical mobility - Moved from different state (%) - Hispanic or Latino
Geographical mobility - Moved from different state (%) - American Indian and Alaska Native
Geographical mobility - Moved from different state (%) - Multirace
Geographical mobility - Moved from different state (%) - Other Race
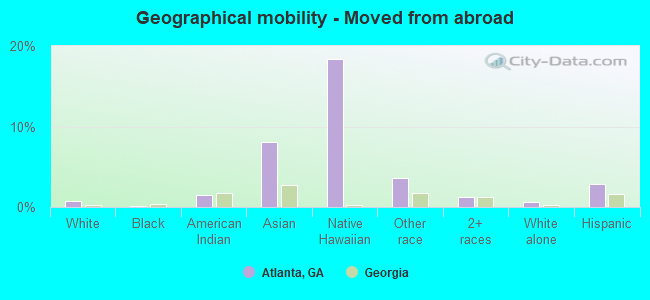
Geographical mobility - Moved from abroad (%)
Geographical mobility - Moved from abroad (%) - White
Geographical mobility - Moved from abroad (%) - Black or African American
Geographical mobility - Moved from abroad (%) - Asian
Geographical mobility - Moved from abroad (%) - Hispanic or Latino
Geographical mobility - Moved from abroad (%) - American Indian and Alaska Native
Geographical mobility - Moved from abroad (%) - Multirace
Geographical mobility - Moved from abroad (%) - Other Race
Place of birth for the foreign-born population - Ireland (%)
Place of birth for the foreign-born population - Denmark (%)
Place of birth for the foreign-born population - Norway (%)
Place of birth for the foreign-born population - Sweden (%)
Place of birth for the foreign-born population - United Kingdom (%)
Place of birth for the foreign-born population - England (%)
Place of birth for the foreign-born population - Scotland (%)
Place of birth for the foreign-born population - Other Northern Europe (%)
Place of birth for the foreign-born population - Austria (%)
Place of birth for the foreign-born population - Belgium (%)
Place of birth for the foreign-born population - France (%)
Place of birth for the foreign-born population - Germany (%)
Place of birth for the foreign-born population - Netherlands (%)
Place of birth for the foreign-born population - Switzerland (%)
Place of birth for the foreign-born population - Other Western Europe (%)
Place of birth for the foreign-born population - Greece (%)
Place of birth for the foreign-born population - Italy (%)
Place of birth for the foreign-born population - Portugal (%)
Place of birth for the foreign-born population - Spain (%)
Place of birth for the foreign-born population - Other Southern Europe (%)
Place of birth for the foreign-born population - Albania (%)
Place of birth for the foreign-born population - Belarus (%)
Place of birth for the foreign-born population - Bosnia and Herzegovina (%)
Place of birth for the foreign-born population - Bulgaria (%)
Place of birth for the foreign-born population - Croatia (%)
Place of birth for the foreign-born population - Czechoslovakia (%)
Place of birth for the foreign-born population - Hungary (%)
Place of birth for the foreign-born population - Latvia (%)
Place of birth for the foreign-born population - Lithuania (%)
Place of birth for the foreign-born population - North Macedonia (Macedonia) (%)
Place of birth for the foreign-born population - Moldova (%)
Place of birth for the foreign-born population - Poland (%)
Place of birth for the foreign-born population - Romania (%)
Place of birth for the foreign-born population - Russia (%)
Place of birth for the foreign-born population - Serbia (%)
Place of birth for the foreign-born population - Ukraine (%)
Place of birth for the foreign-born population - Other Eastern Europe (%)
Place of birth for the foreign-born population - China (%)
Place of birth for the foreign-born population - Hong Kong (%)
Place of birth for the foreign-born population - Taiwan (%)
Place of birth for the foreign-born population - Japan (%)
Place of birth for the foreign-born population - Korea (%)
Place of birth for the foreign-born population - Other Eastern Asia (%)
Place of birth for the foreign-born population - Afghanistan (%)
Place of birth for the foreign-born population - Bangladesh (%)
Place of birth for the foreign-born population - India (%)
Place of birth for the foreign-born population - Iran (%)
Place of birth for the foreign-born population - Kazakhstan (%)
Place of birth for the foreign-born population - Nepal (%)
Place of birth for the foreign-born population - Pakistan (%)
Place of birth for the foreign-born population - Sri Lanka (%)
Place of birth for the foreign-born population - Uzbekistan (%)
Place of birth for the foreign-born population - Other South Central Asia (%)
Place of birth for the foreign-born population - Burma (%)
Place of birth for the foreign-born population - Cambodia (%)
Place of birth for the foreign-born population - Indonesia (%)
Place of birth for the foreign-born population - Laos (%)
Place of birth for the foreign-born population - Malaysia (%)
Place of birth for the foreign-born population - Philippines (%)
Place of birth for the foreign-born population - Singapore (%)
Place of birth for the foreign-born population - Thailand (%)
Place of birth for the foreign-born population - Vietnam (%)
Place of birth for the foreign-born population - Other South Eastern Asia (%)
Place of birth for the foreign-born population - Armenia (%)
Place of birth for the foreign-born population - Iraq (%)
Place of birth for the foreign-born population - Israel (%)
Place of birth for the foreign-born population - Jordan (%)
Place of birth for the foreign-born population - Kuwait (%)
Place of birth for the foreign-born population - Lebanon (%)
Place of birth for the foreign-born population - Saudi Arabia (%)
Place of birth for the foreign-born population - Syria (%)
Place of birth for the foreign-born population - Turkey (%)
Place of birth for the foreign-born population - Yemen (%)
Place of birth for the foreign-born population - Other Western Asia (%)
Place of birth for the foreign-born population - Eritrea (%)
Place of birth for the foreign-born population - Ethiopia (%)
Place of birth for the foreign-born population - Kenya (%)
Place of birth for the foreign-born population - Somalia (%)
Place of birth for the foreign-born population - Uganda (%)
Place of birth for the foreign-born population - Zimbabwe (%)
Place of birth for the foreign-born population - Other Eastern Africa (%)
Place of birth for the foreign-born population - Cameroon (%)
Place of birth for the foreign-born population - Congo (%)
Place of birth for the foreign-born population - Democratic Republic of Congo (Zaire) (%)
Place of birth for the foreign-born population - Other Middle Africa (%)
Place of birth for the foreign-born population - Egypt (%)
Place of birth for the foreign-born population - Morocco (%)
Place of birth for the foreign-born population - Sudan (%)
Place of birth for the foreign-born population - Other Northern Africa (%)
Place of birth for the foreign-born population - South Africa (%)
Place of birth for the foreign-born population - Other Southern Africa (%)
Place of birth for the foreign-born population - Cabo Verde (%)
Place of birth for the foreign-born population - Ghana (%)
Place of birth for the foreign-born population - Liberia (%)
Place of birth for the foreign-born population - Nigeria (%)
Place of birth for the foreign-born population - Senegal (%)
Place of birth for the foreign-born population - Sierra Leone (%)
Place of birth for the foreign-born population - Other Western Africa (%)
Place of birth for the foreign-born population - Australia (%)
Place of birth for the foreign-born population - New Zealand (%)
Place of birth for the foreign-born population - Fiji (%)
Place of birth for the foreign-born population - Micronesia (%)
Place of birth for the foreign-born population - Bahamas (%)
Place of birth for the foreign-born population - Barbados (%)
Place of birth for the foreign-born population - Cuba (%)
Place of birth for the foreign-born population - Dominica (%)
Place of birth for the foreign-born population - Dominican Republic (%)
Place of birth for the foreign-born population - Grenada (%)
Place of birth for the foreign-born population - Haiti (%)
Place of birth for the foreign-born population - Jamaica (%)
Place of birth for the foreign-born population - St. Vincent and the Grenadines (%)
Place of birth for the foreign-born population - Trinidad and Tobago (%)
Place of birth for the foreign-born population - West Indies (%)
Place of birth for the foreign-born population - Other Caribbean (%)
Place of birth for the foreign-born population - Belize (%)
Place of birth for the foreign-born population - Costa Rica (%)
Place of birth for the foreign-born population - El Salvador (%)
Place of birth for the foreign-born population - Guatemala (%)
Place of birth for the foreign-born population - Honduras (%)
Place of birth for the foreign-born population - Mexico (%)
Place of birth for the foreign-born population - Nicaragua (%)
Place of birth for the foreign-born population - Panama (%)
Place of birth for the foreign-born population - Other Central America (%)
Place of birth for the foreign-born population - Argentina (%)
Place of birth for the foreign-born population - Bolivia (%)
Place of birth for the foreign-born population - Brazil (%)
Place of birth for the foreign-born population - Chile (%)
Place of birth for the foreign-born population - Colombia (%)
Place of birth for the foreign-born population - Ecuador (%)
Place of birth for the foreign-born population - Guyana (%)
Place of birth for the foreign-born population - Peru (%)
Place of birth for the foreign-born population - Uruguay (%)
Place of birth for the foreign-born population - Venezuela (%)
Place of birth for the foreign-born population - Other South America (%)
Place of birth for the foreign-born population - Canada (%)
Place of birth for the foreign-born population - Other Northern America (%)
Place of birth for the foreign-born population - Other (%)
Latest news about races in Atlanta, GA collected exclusively by city-data.com from local newspapers, TV, and radio stations
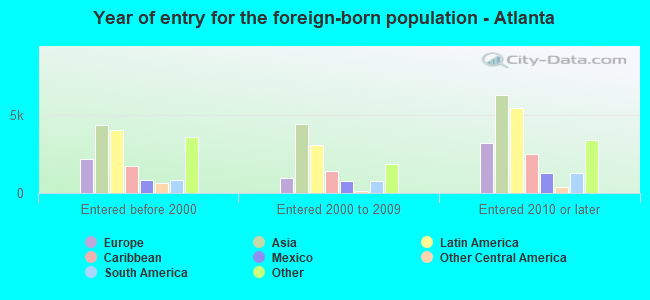
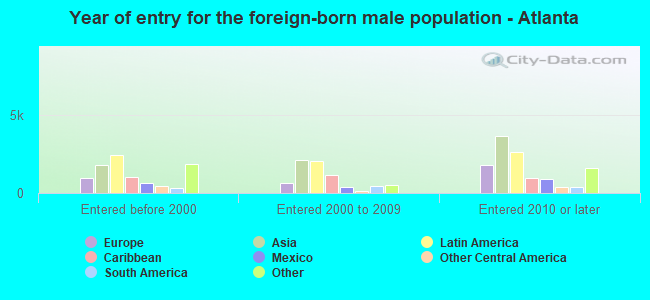
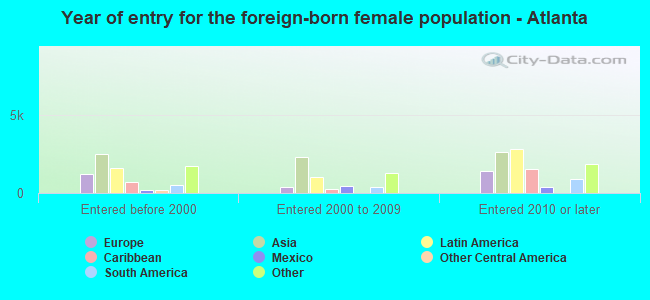
According to 2022 data, the most numerous races in Atlanta, GA are White alone (186,585 residents), Black alone (232,418 residents), and Hispanic (28,241 residents). 88.4% of Atlanta residents speak English at home. 8.5% of Atlanta, GA residents are foreign-born (3.3% born in Asia, 2.4% born in Latin America, 1.3% born in Europe, 0.9% born in Africa), which is 18.0% less than the foreign-born rate of 10.0% across the entire state of Georgia.
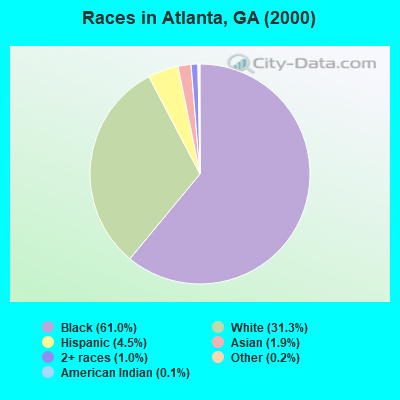
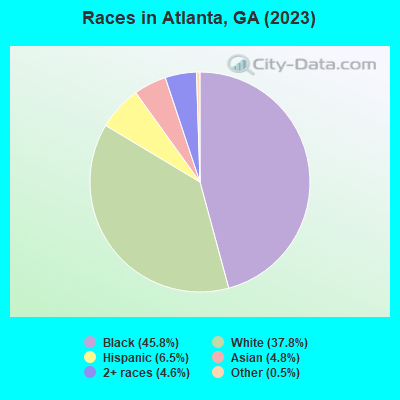
Race distribution in Atlanta
2000 2022
254,062 61.0% Black alone 130,222 31.3% White alone 18,720 4.5% Hispanic 7,949 1.9% Asian alone 4,166 1.0% Two or more races 630 0.2% Other race alone 594 0.1% American Indian alone 131 0.03% Native Hawaiian and Other
232,418 46.6% Black alone 186,585 37.4% White alone 28,241 5.7% Hispanic 26,363 5.3% Asian alone 22,129 4.4% Two or more races 2,719 0.5% Other race alone 470 0.09% American Indian alone 196 0.04% Native Hawaiian and Other
2000 2022
5,128,661 62.6% White alone 2,331,465 28.5% Black alone 435,227 5.3% Hispanic 171,513 2.1% Asian alone 87,364 1.1% Two or more races 17,670 0.2% American Indian alone 11,275 0.1% Other race alone 3,278 0.04% Native Hawaiian and Other
5,415,657 49.6% White alone 3,349,240 30.7% Black alone 1,132,604 10.4% Hispanic 479,156 4.4% Asian alone 462,923 4.2% Two or more races 54,416 0.5% Other race alone 11,923 0.1% American Indian alone 6,957 0.06% Native Hawaiian and Other
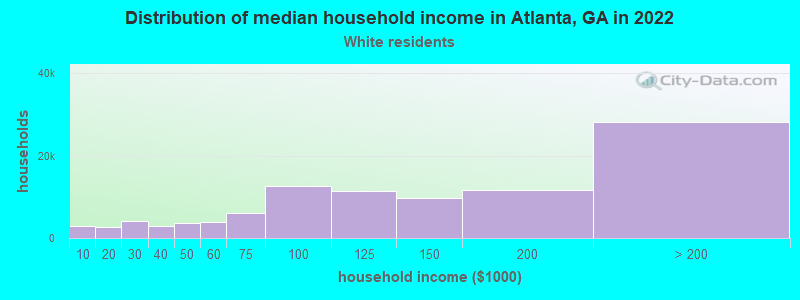
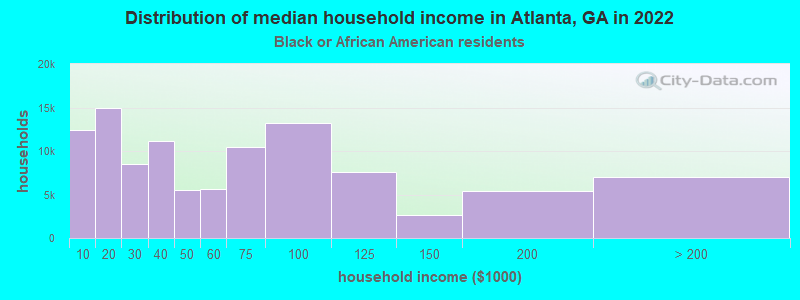
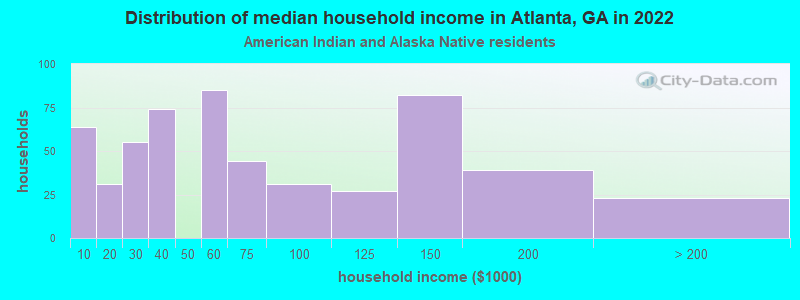
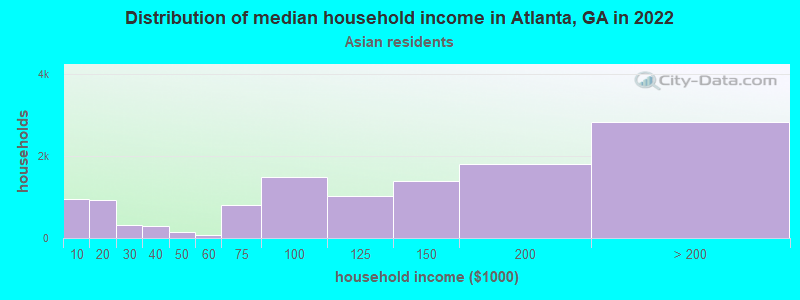
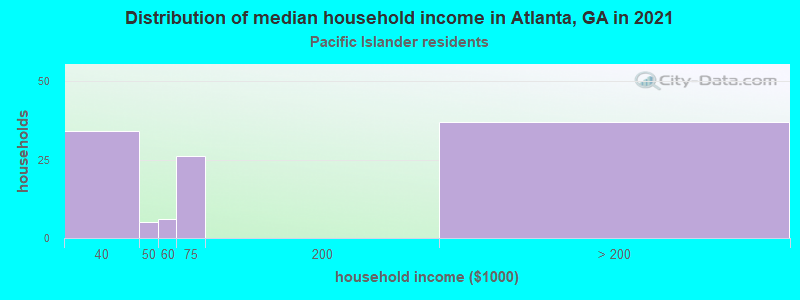
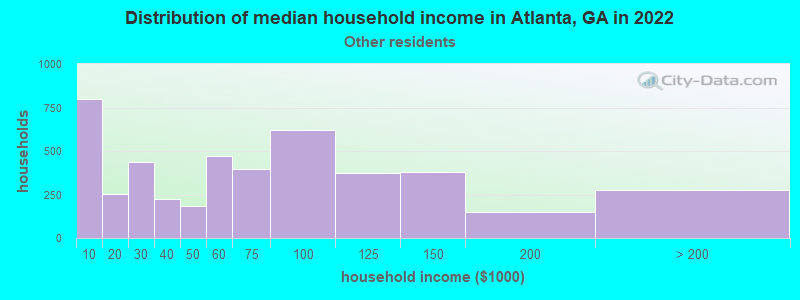
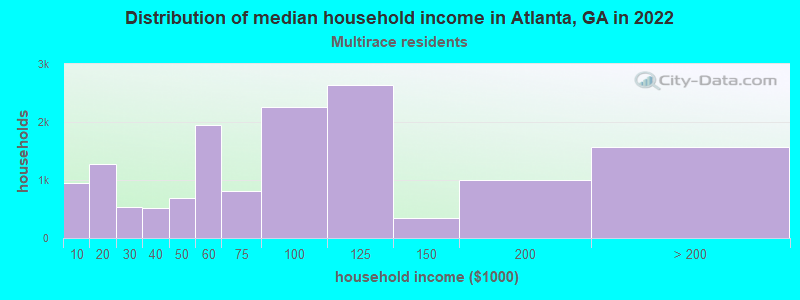
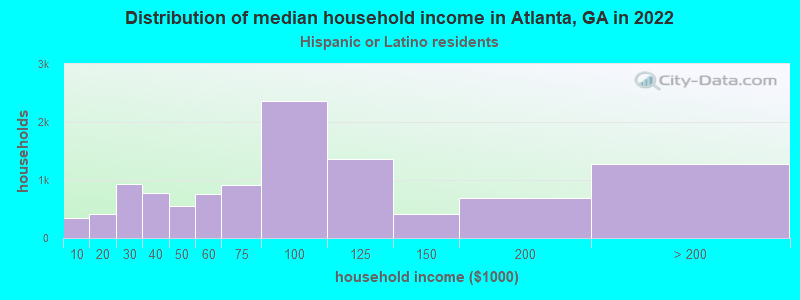
Income and house value in Atlanta Median household income in 2022 $125,253 White non-Hispanic householders$49,526 Black householders$81,793 American Indian and Alaska Native householders$125,163 Asian householders$68,058 Some other race householders$79,230 Two or more races householders$80,580 Hispanic or Latino race householdersMedian 2022 house value $953,213 White Non-Hispanic householders$228,653 Black or African American householders$241,912 American Indian or Alaska Native householders $612,001 Asian householders$331,488 Native Hawaiian and other Pacific Islander householders$381,285 Some other race householders$339,149 Two or more races householders$418,412 Hispanic or Latino householders
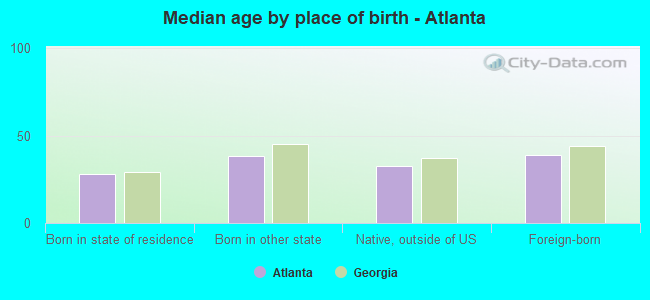
Median age by race in Atlanta
35.1 Median age for White residents35.6 34.4 34.8 Median age for Black or African American residents33.6 36.1 48.1 Median age for American Indian / Alaska Native residents38.5 66.6 30.1 Median age for Asian residents30.4 29.7 -666,666,666.0 Median age for Native Hawaiian / Pacific Islander residents-666,666,666.0 -666,666,666.0 32.1 Median age for Other race residents33.0 31.7 29.6 Median age for Two or more races residents29.7 29.3 35.5 Median age for White alone residents35.9 35.0 30.2 Median age for Hispanic or Latino residents29.8 30.5
Owner/renter occupied households by race in Atlanta
House owners and renters - White residents 55,552 55.6% Owner occupied44,365 44.4% Renter occupiedHouse owners and renters - Black or African American residents 38,759 37.0% Owner occupied65,878 63.0% Renter occupiedHouse owners and renters - American Indian / Alaska Native residents 145 45.3% Owner occupied175 54.7% Renter occupiedHouse owners and renters - Asian residents 5,092 42.3% Owner occupied6,956 57.7% Renter occupiedHouse owners and renters - Native Hawaiian / Pacific Islander residents 25 24.9% Owner occupied74 75.1% Renter occupiedHouse owners and renters - Other race residents 1,888 40.0% Owner occupied2,837 60.0% Renter occupiedHouse owners and renters - Two or more races residents 6,744 46.3% Owner occupied7,811 53.7% Renter occupiedHouse owners and renters - White alone residents 54,653 56.0% Owner occupied42,860 44.0% Renter occupiedHouse owners and renters - Hispanic or Latino residents 4,568 42.3% Owner occupied6,242 57.7% Renter occupied
Language usage in Atlanta
English speakers - Total 88.4% of residents of Atlanta speak English at home.
4.3% of residents speak Spanish at home 15,636 76.5% Speak English very well4,790 23.5% Speak English less than very well7.3% of residents speak other language at home 26,542 76.5% Speak English very well8,141 23.5% Speak English less than very well
English speakers - Born in the United States 93.6% of residents of Atlanta speak English at home.
3.1% of residents speak Spanish at home 5,641 85.4% Speak English very well967 14.6% Speak English less than very well3.3% of residents speak other language at home 5,518 78.0% Speak English very well1,555 22.0% Speak English less than very well
English speakers - Native, born elsewhere 72.0% of residents of Atlanta speak English at home.
12.3% of residents speak Spanish at home 887 75.2% Speak English very well292 24.8% Speak English less than very well15.7% of residents speak other language at home 1,436 95.5% Speak English very well68 4.5% Speak English less than very well
English speakers - Foreign-born 28.3% of residents of Atlanta speak English at home.
17.9% of residents speak Spanish at home 4,408 57.8% Speak English very well3,219 42.2% Speak English less than very well53.8% of residents speak other language at home 16,588 72.4% Speak English very well6,339 27.6% Speak English less than very well
White (Caucasian) - Speak only English Native:
96.6% (171,330)Foreign-born:
34.4% (3,054)
White (Caucasian) - Speak another language Native:
3.4% (6,042)Foreign-born:
65.6% (5,816)
Black or African American - Speak only English Native:
97.1% (204,625)Foreign-born:
43.8% (4,633)
Black or African American - Speak another language Native:
2.9% (6,048)Foreign-born:
56.2% (5,947)
American Indian / Alaska Native - Speak only English Native:
67.2% (484)Foreign-born:
10.7% (43)
American Indian / Alaska Native - Speak another language Native:
32.4% (234)Foreign-born:
89.8% (363)
Asian - Speak only English Native:
58.2% (6,998)Foreign-born:
19.7% (2,763)
Asian - Speak another language Native:
41.8% (5,036)Foreign-born:
80.3% (11,292)
Native Hawaiian / Pacific Islander - Speak only English Native:
49.8% (77)Foreign-born:
12.6% (12)
Native Hawaiian / Pacific Islander - Speak another language Native:
53.1% (82)Foreign-born:
88.7% (86)
Other race - Speak only English Native:
36.6% (2,598)Foreign-born:
8.5% (268)
Other race - Speak another language Native:
63.4% (4,507)Foreign-born:
91.5% (2,901)
Two or more races - Speak only English Native:
87.7% (20,555)Foreign-born:
23.3% (1,337)
Two or more races - Speak another language Native:
12.3% (2,875)Foreign-born:
76.7% (4,402)
White alone - Speak only English Native:
97.3% (167,713)Foreign-born:
38.5% (2,973)
White alone - Speak another language Native:
2.7% (4,704)Foreign-born:
61.5% (4,750)
Hispanic or Latino - Speak only English Native:
58.2% (10,381)Foreign-born:
6.4% (531)
Hispanic or Latino - Speak another language Native:
41.8% (7,442)Foreign-born:
93.6% (7,720)
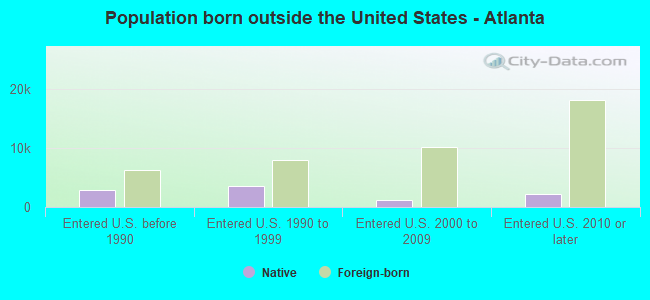
Foreign-born residents in Atlanta 42,453 residents are foreign born (3.3% Asia , 2.4% Latin America , 1.3% Europe , 0.9% Africa ).
This city:
8.5%Georgia:
10.4%
Marital status for residents in Atlanta Marital status - White (Caucasian) population 15 years and over
Males 51.5% Never married39.6% Now married0.7% Separated1.3% Widowed6.7% DivorcedFemales 46.0% Never married40.1% Now married1.4% Separated4.3% Widowed8.2% DivorcedWomen who gave birth in the past 12 months Now married:
90.0% (1,803)Unmarried:
10.0% (201)
Women who did not give birth in the past 12 months Now married:
35.6% (20,539)Unmarried:
64.4% (37,195)
Marital status - Black or African American population 15 years and over
Males 60.8% Never married23.0% Now married1.8% Separated3.0% Widowed11.4% DivorcedFemales 55.8% Never married17.4% Now married3.3% Separated8.4% Widowed15.1% DivorcedWomen who gave birth in the past 12 months Now married:
33.3% (907)Unmarried:
66.7% (1,819)
Women who did not give birth in the past 12 months Now married:
13.9% (8,850)Unmarried:
86.1% (55,044)
Marital status - American Indian / Alaska Native population 15 years and over
Males 28.4% Never married44.1% Now married7.8% Separated0.0% Widowed19.7% DivorcedFemales 23.6% Never married59.9% Now married3.0% Separated7.2% Widowed6.4% DivorcedWomen who did not give birth in the past 12 months Now married:
65.5% (502)Unmarried:
34.5% (265)
Marital status - Asian population 15 years and over
Males 67.2% Never married30.8% Now married0.0% Separated0.0% Widowed2.0% DivorcedFemales 61.0% Never married31.1% Now married0.0% Separated2.0% Widowed5.9% DivorcedWomen who gave birth in the past 12 months Now married:
49.6% (136)Unmarried:
50.4% (138)
Women who did not give birth in the past 12 months Now married:
25.0% (2,367)Unmarried:
75.0% (7,108)
Marital status - Native Hawaiian / Pacific Islander population 15 years and over
Males 56.2% Never married43.8% Now married0.0% Separated0.0% Widowed0.0% DivorcedFemales 52.2% Never married21.7% Now married0.0% Separated0.0% Widowed26.1% DivorcedWomen who did not give birth in the past 12 months Now married:
12.5% (6)Unmarried:
87.5% (44)
Marital status - Other race population 15 years and over
Males 57.5% Never married34.8% Now married1.7% Separated1.1% Widowed4.9% DivorcedFemales 46.6% Never married37.7% Now married2.8% Separated6.6% Widowed6.3% DivorcedWomen who gave birth in the past 12 months Now married:
100.0% (239)Unmarried:
0.0% (0)
Women who did not give birth in the past 12 months Now married:
35.0% (1,010)Unmarried:
65.0% (1,873)
Marital status - Two or more races population 15 years and over
Males 57.7% Never married29.1% Now married0.8% Separated0.0% Widowed12.4% DivorcedFemales 57.3% Never married24.6% Now married2.1% Separated5.6% Widowed10.3% DivorcedWomen who gave birth in the past 12 months Now married:
48.0% (264)Unmarried:
52.0% (286)
Women who did not give birth in the past 12 months Now married:
24.4% (2,216)Unmarried:
75.6% (6,862)
Marital status - White alone, not Hispanic / Latino population 15 years and over
Males 51.1% Never married39.9% Now married0.8% Separated1.4% Widowed6.9% DivorcedFemales 44.7% Never married40.9% Now married1.4% Separated4.5% Widowed8.4% DivorcedWomen who gave birth in the past 12 months Now married:
89.8% (1,775)Unmarried:
10.2% (201)
Women who did not give birth in the past 12 months Now married:
36.7% (20,015)Unmarried:
63.3% (34,490)
Marital status - Hispanic or Latino population 15 years and over
Males 54.7% Never married38.1% Now married0.4% Separated0.0% Widowed6.9% DivorcedFemales 53.3% Never married34.7% Now married0.7% Separated4.9% Widowed6.4% DivorcedWomen who gave birth in the past 12 months Now married:
100.0% (388)Unmarried:
0.0% (0)
Women who did not give birth in the past 12 months Now married:
28.1% (2,496)Unmarried:
71.9% (6,379)
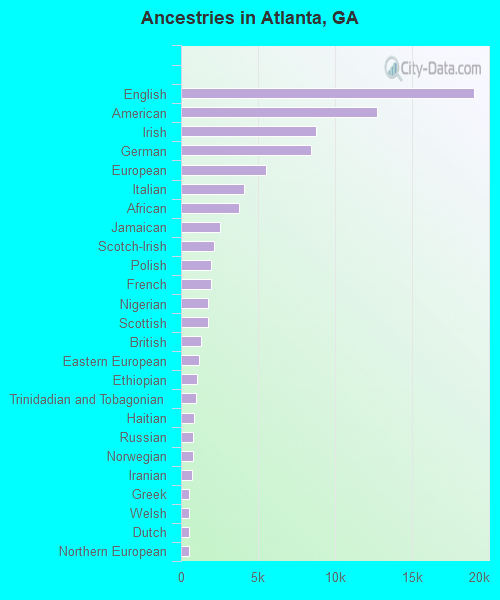
Ancestries in Atlanta
19,057 6.6% English12,750 4.4% American8,803 3.1% Irish8,474 2.9% German5,524 1.9% European4,116 1.4% Italian3,743 1.3% African2,523 0.9% Jamaican2,136 0.7% Scotch-Irish1,960 0.7% Polish1,926 0.7% French1,745 0.6% Nigerian1,726 0.6% Scottish1,293 0.4% British1,186 0.4% Eastern European1,061 0.4% Ethiopian1,005 0.3% Trinidadian and Tobagonian864 0.3% Haitian802 0.3% Russian767 0.3% Norwegian728 0.3% Iranian551 0.2% Greek538 0.2% Welsh524 0.2% Dutch513 0.2% Northern European465 0.2% Senegalese438 0.2% Swedish420 0.1% Ghanaian320 0.1% Portuguese314 0.1% Brazilian304 0.1% Egyptian300 0.1% French Canadian297 0.1% Scandinavian293 0.1% Canadian286 0.10% Hungarian286 0.10% West Indian273 0.09% Romanian259 0.09% South African259 0.09% Guyanese249 0.09% Ukrainian232 0.08% Latvian196 0.07% Lithuanian184 0.06% Danish183 0.06% Lebanese174 0.06% British West Indian172 0.06% Turkish154 0.05% Austrian148 0.05% Czech148 0.05% Finnish143 0.05% Moroccan132 0.05% Kenyan128 0.04% Slovak118 0.04% Armenian108 0.04% Swiss105 0.04% Yugoslavian103 0.04% Syrian93 0.03% Croatian87 0.03% Czechoslovakian68 0.02% Belgian65 0.02% Liberian65 0.02% Afghan61 0.02% Cajun60 0.02% Arab53 0.02% Somali52 0.02% Bahamian51 0.02% Maltese49 0.02% Bulgarian46 0.02% U.S. Virgin Islander45 0.02% Slavic43 0.01% Cape Verdean34 0.01% Israeli30 0.01% Luxembourger26 0.01% Sudanese21 0.01% Palestinian19 0.01% Cypriot18 0.01% Iraqi
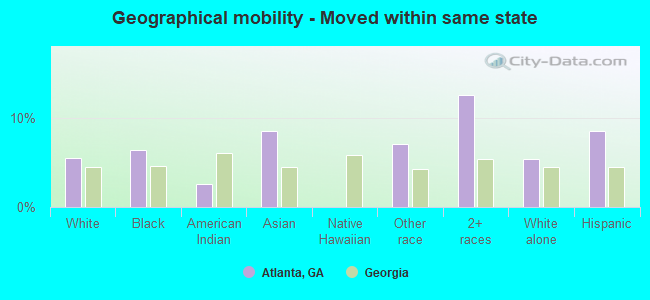
Geographical mobility in Atlanta Same house 1 year ago 148,635 77.8% White (Caucasian)195,549 83.7% Black or African American920 82.0% American Indian / Alaska Native17,414 65.7% Asian123 50.0% Native Hawaiian / Pacific Islander8,147 77.1% Other race23,494 73.7% Two or more races144,069 78.1% White alone, not Hispanic / Latino20,800 75.1% Hispanic or LatinoMoved within same county 17,336 9.1% White / Caucasian12,022 5.1% Black or African American188 16.8% American Indian / Alaska Native1,673 6.3% Asian34 13.8% Native Hawaiian / Pacific Islander736 7.0% Other race1,626 5.1% Two or more races16,937 9.2% White alone, not Hispanic / Latino1,675 6.1% Hispanic or LatinoMoved within same state 10,551 5.5% White / Caucasian14,948 6.4% Black or African American29 2.6% American Indian / Alaska Native2,260 8.5% Asian750 7.1% Other race3,995 12.5% Two or more races9,974 5.4% White alone, not Hispanic / Latino2,355 8.5% Hispanic or LatinoMoved from different state 13,169 6.9% White / Caucasian10,947 4.7% Black or African American47 4.2% American Indian / Alaska Native2,991 11.3% Asian20 8.1% Native Hawaiian / Pacific Islander553 5.2% Other race2,393 7.5% Two or more races12,350 6.7% White alone, not Hispanic / Latino2,044 7.4% Hispanic or LatinoMoved from abroad 1,325 0.7% White215 0.1% Black or African American17 1.5% American Indian / Alaska Native2,152 8.1% Asian45 18.4% Native Hawaiian / Pacific Islander379 3.6% Other race387 1.2% Two or more races1,176 0.6% White alone, not Hispanic / Latino807 2.9% Hispanic or Latino
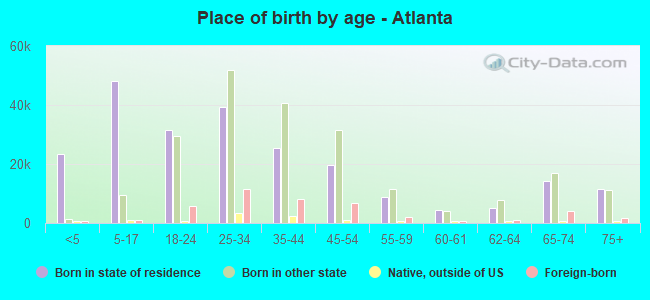
Children Nativity (place of birth) in Atlanta
Children under 6 years - Living with two parents Both parents native 11,773 100.0% NativeBoth parents foreign-born 562 100.0% NativeOne native, one foreign-born parent 2,099 100.0% NativeChildren under 6 years - Living with one parent Native parent 12,516 100.0% NativeForeign-born parent 345 100.0% NativeChildren 6 to 17 years - Living with two parents Both parents native 19,981 99.8% Native50 0.2% Foreign-bornBoth parents foreign-born 1,407 86.3% Native224 13.7% Foreign-bornOne native, one foreign-born parent 1,996 100.0% NativeChildren 6 to 17 years - Living with one parent Native parent 27,409 100.0% NativeForeign-born parent 2,052 57.6% Native1,509 42.4% Foreign-born
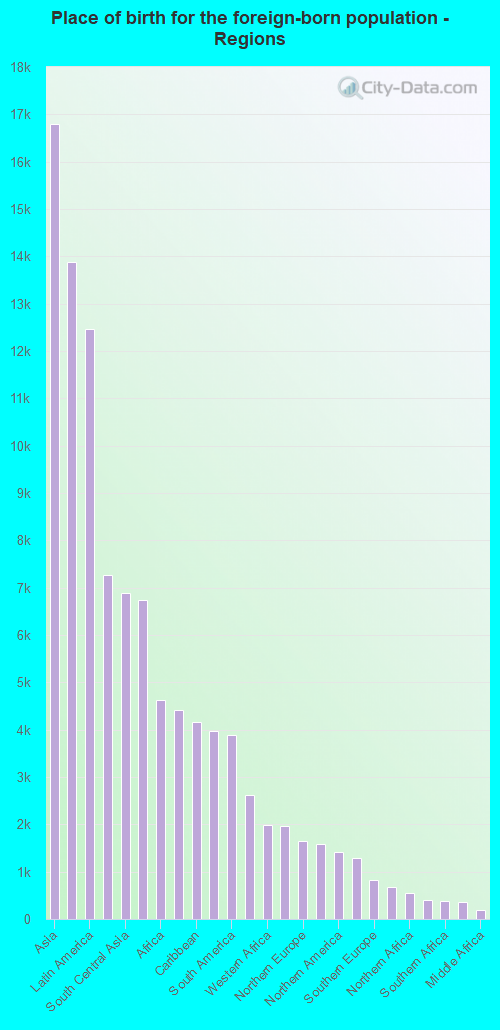
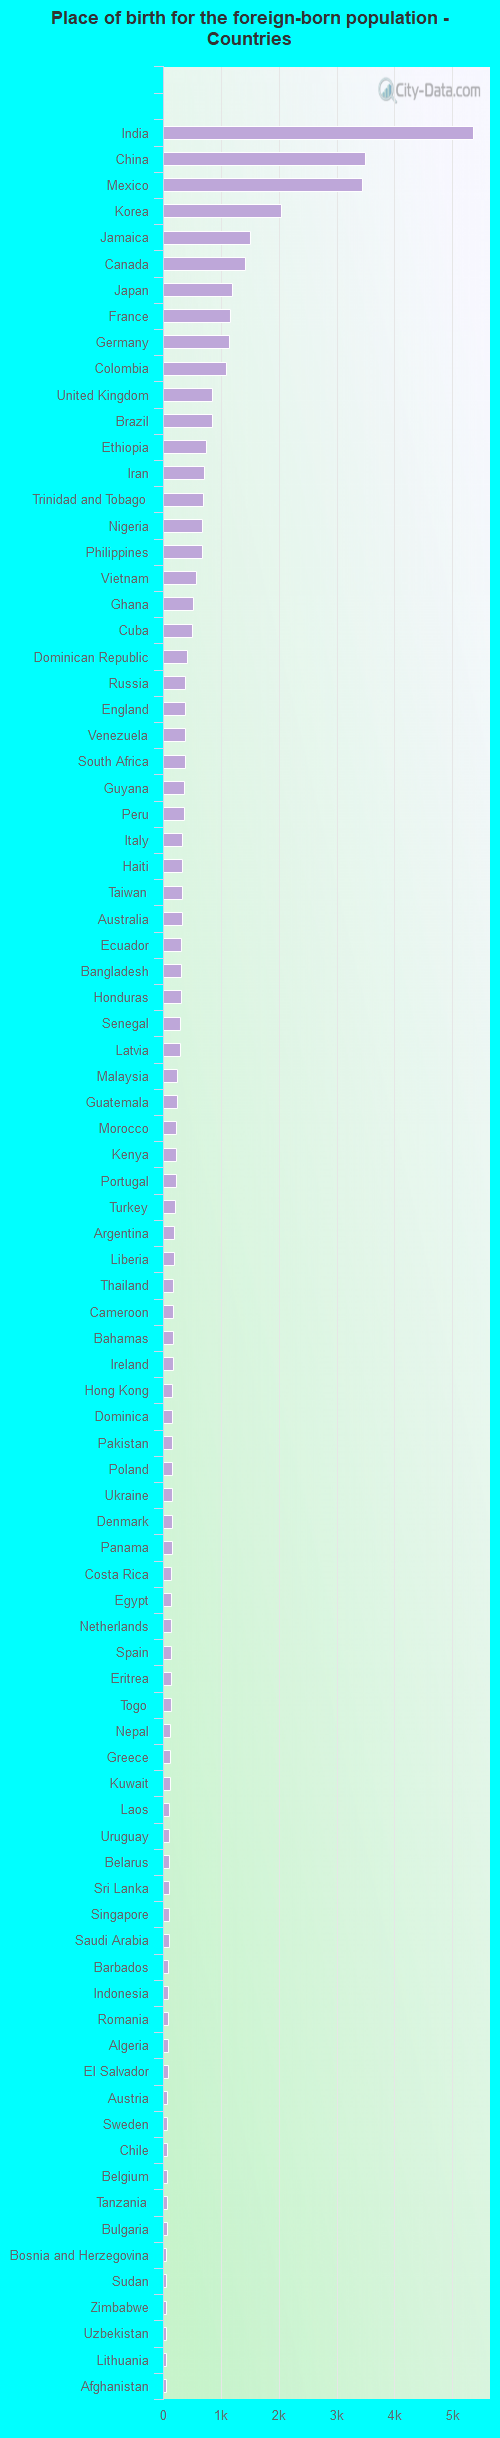
Place of birth for residents in Atlanta 16,801 Asia13,884 Americas12,464 Latin America7,271 Eastern Asia6,887 South Central Asia6,743 Europe4,623 Africa4,414 Central America4,165 Caribbean3,974 China3,883 South America2,627 Western Europe1,995 Western Africa1,974 South Eastern Asia1,655 Northern Europe1,578 Eastern Europe1,420 Northern America1,291 Eastern Africa821 Southern Europe667 Western Asia556 Northern Africa399 Oceania376 Southern Africa352 Australia and New Zealand Subregion197 Middle Africa5,367 India3,485 China3,441 Mexico2,037 Korea1,505 Jamaica1,420 Canada1,196 Japan1,166 France1,145 Germany1,081 Colombia851 United Kingdom846 Brazil737 Ethiopia712 Iran684 Trinidad and Tobago673 Nigeria669 Philippines573 Vietnam516 Ghana505 Cuba415 Dominican Republic379 Russia377 England377 Venezuela376 South Africa369 Guyana356 Peru335 Italy330 Haiti325 Taiwan320 Australia317 Ecuador308 Bangladesh304 Honduras302 Senegal299 Latvia249 Malaysia244 Guatemala231 Morocco228 Kenya218 Portugal204 Turkey193 Argentina184 Liberia174 Thailand173 Cameroon169 Bahamas166 Ireland163 Hong Kong163 Dominica161 Pakistan160 Poland159 Ukraine152 Denmark152 Panama146 Costa Rica145 Egypt142 Netherlands141 Spain135 Eritrea135 Togo129 Nepal125 Greece123 Kuwait109 Laos108 Uruguay105 Belarus103 Sri Lanka102 Singapore100 Saudi Arabia95 Barbados94 Indonesia92 Romania87 Algeria85 El Salvador77 Austria77 Sweden75 Chile73 Belgium70 Tanzania62 Bulgaria58 Bosnia and Herzegovina57 Sudan55 Zimbabwe54 Uzbekistan51 Lithuania50 Afghanistan46 Israel43 Grenada41 Syria40 Nicaragua40 Lebanon39 Ivory Coast39 Moldova37 Serbia32 New Zealand32 West Indies32 Georgia30 St. Vincent and the Grenadines26 Hungary26 Czechoslovakia25 Uganda23 Democratic Republic of Congo (Zaire)21 Switzerland18 United Arab Emirates18 St. Lucia12 Jordan12 Micronesia11 Croatia10 Armenia10 Scotland8 Iraq8 Azerbaijan7 Bolivia
Grandparents responsible for own grandchildren in Atlanta
Grandparents (30 to 59 years) White / Caucasian 8 13.1% Responsible for grandchildren51 86.9% Not responsible for grandchildrenBlack or African American 431 36.3% Responsible for grandchildren757 63.7% Not responsible for grandchildrenAmerican Indian / Alaska Native 52 100.0% Responsible for grandchildrenOther race 61 41.4% Responsible for grandchildren86 58.6% Not responsible for grandchildrenTwo or more races 61 100.0% Responsible for grandchildrenWhite alone, not Hispanic / Latino 8 22.2% Responsible for grandchildren27 77.8% Not responsible for grandchildrenHispanic or Latino 130 67.8% Responsible for grandchildren62 32.2% Not responsible for grandchildrenGrandparents (60 years and over) White / Caucasian 26 27.0% Responsible for grandchildren71 73.0% Not responsible for grandchildrenBlack or African American 872 49.0% Responsible for grandchildren909 51.0% Not responsible for grandchildrenOther race 89 100.0% Not responsible for grandchildrenTwo or more races 49 52.9% Responsible for grandchildren44 47.1% Not responsible for grandchildrenWhite alone, not Hispanic / Latino 27 26.5% Responsible for grandchildren76 73.5% Not responsible for grandchildrenHispanic or Latino 27 29.2% Responsible for grandchildren67 70.8% Not responsible for grandchildren
Zip codes: 30032 , 30303 , 30305 , 30306 , 30307 , 30308 , 30309 , 30310 , 30311 , 30312 , 30313 , 30314 , 30315 , 30316 , 30317 , 30318 , 30319 , 30324 , 30326 , 30327 , 30331 , 30332 , 30334, 30336 , 30342 , 30344 , 30354 , 30363 .